DAX Profile picture
Sep 25, 2022 5 tweets 2 min read Read on X
Ever wondered why your CHOCH, QM, or whatever you call it doesn't hold at times?

A 🧵
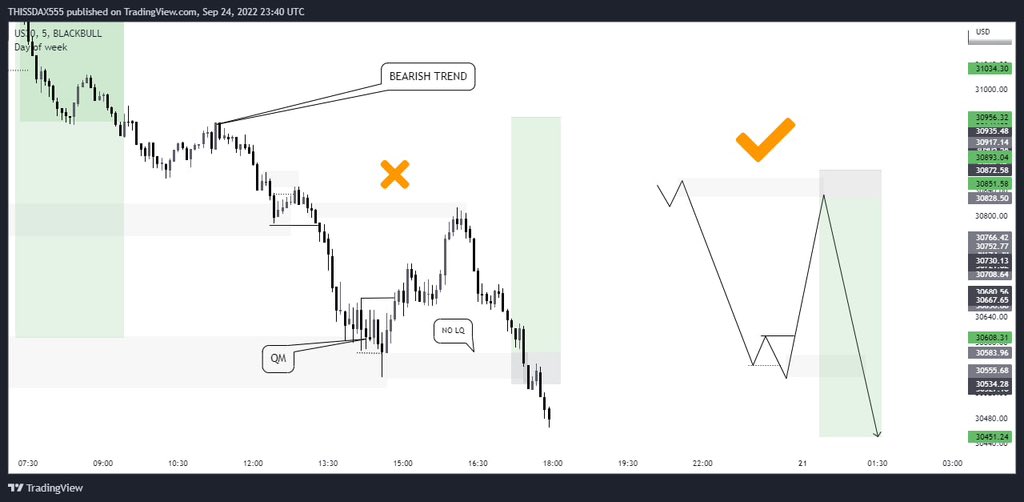
(IN A BEARISH TREND)
Once price does this, it creates a range with both strong lows and highs at the same time .the aim is to move to take out internal liquidity👇
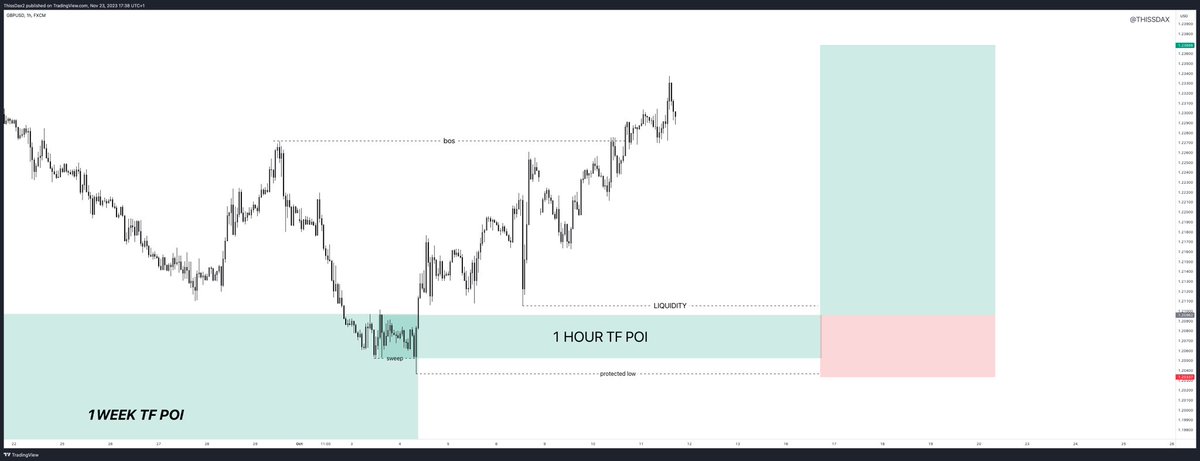
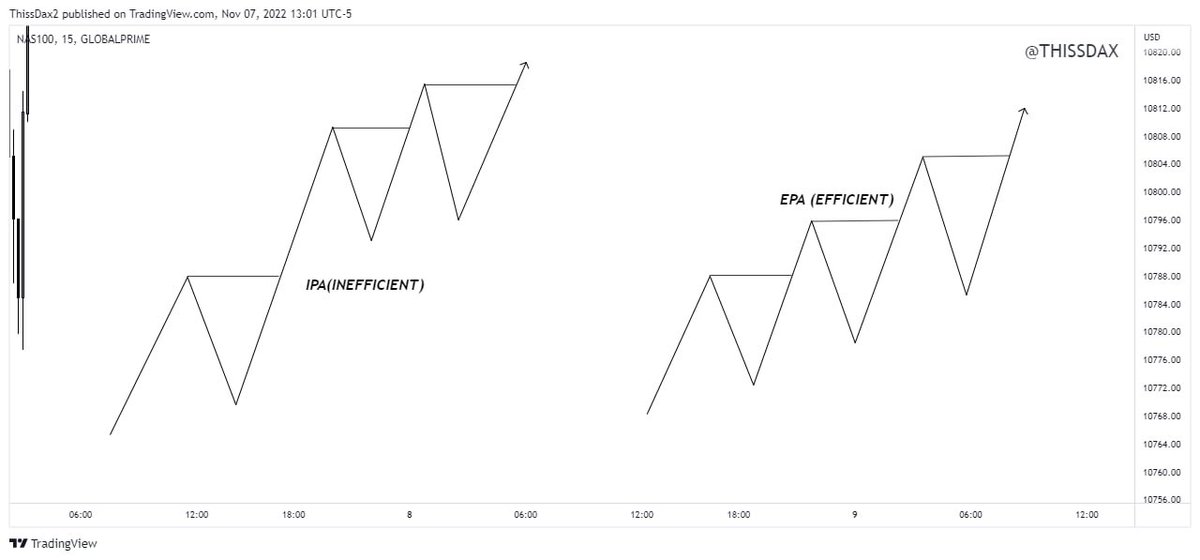
so if we can't catch the buy before it gets to the premium supply provided it aligns with HTF oderflow then the buy is no more valid and it turns to external liquidity to be grabbed in the sell continuation Image
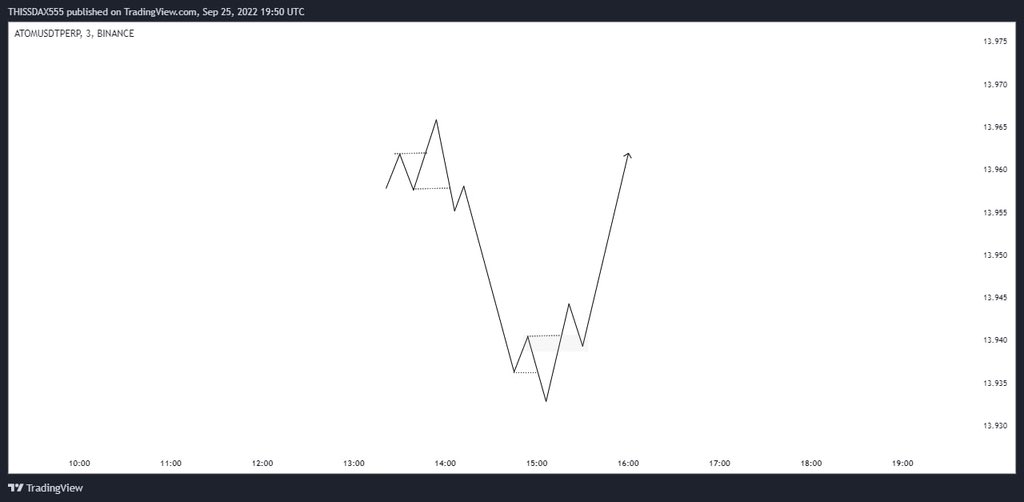
This is how the buy would have been valid since it hasn't moved into premium before retracing. Image
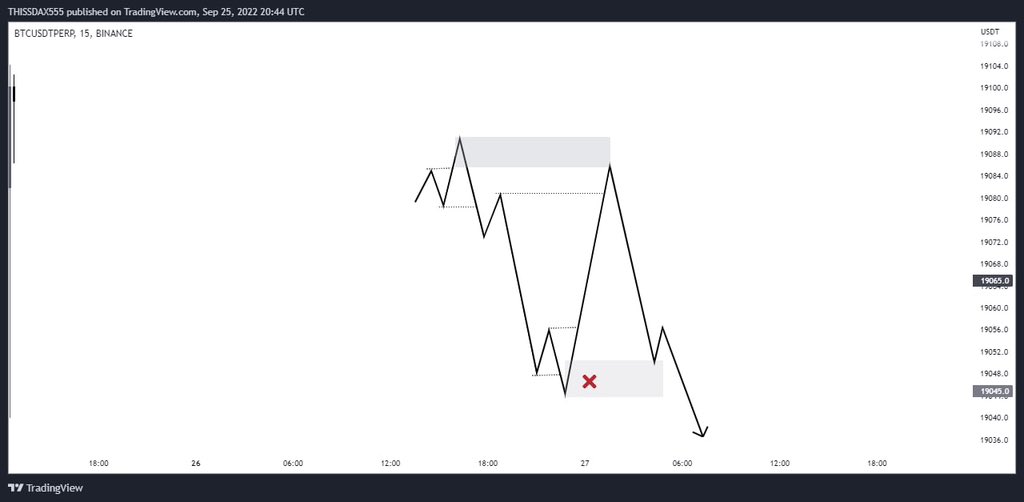
But here price left the buy order run into the range extreme, it now aligns with sells.

Then the Buy/ CHOCH is no longer valid.
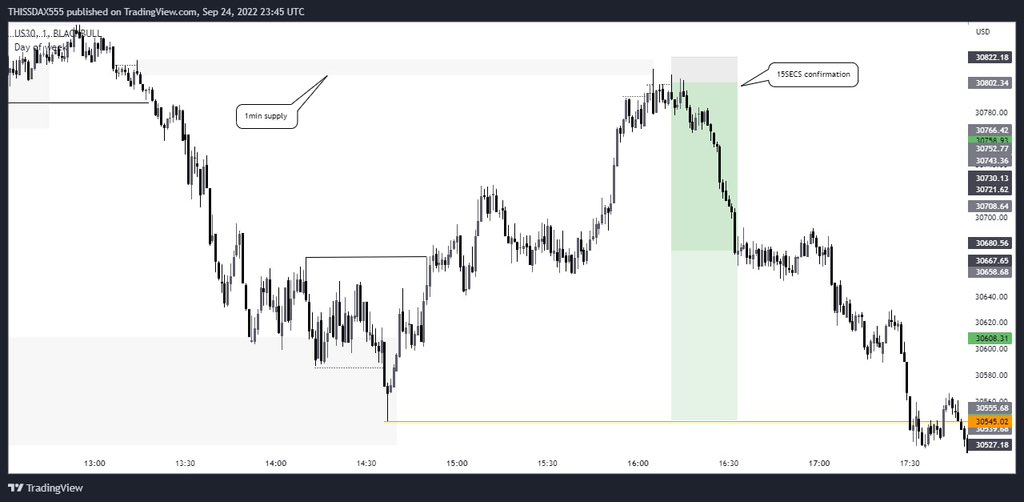
 Image
A chart example ImageImage

• • •

Missing some Tweet in this thread? You can try to force a refresh
 

Keep Current with DAX

DAX Profile picture

Stay in touch and get notified when new unrolls are available from this author!

Read all threads

This Thread may be Removed Anytime!

PDF

Twitter may remove this content at anytime! Save it as PDF for later use!

Try unrolling a thread yourself!

how to unroll video
  1. Follow @ThreadReaderApp to mention us!

  2. From a Twitter thread mention us with a keyword "unroll"
@threadreaderapp unroll

Practice here first or read more on our help page!

More from @thissdax

Dec 17, 2024
Theme of the Week: FOCUS

We’re studying hard all through this week, and here’s what to do if you’re not part of my trading community:

Study these 3 key topics:
1. Structure
2. Liquidity
3. POIs (Points of Interest)

How to Approach It:
• Dedicate one topic per day.
• Watch the video for that topic.
• Practice by studying at least one year of price action to deepen your understanding.

I’ve shared free but highly valuable resources to guide you. Watch them here:

youtube.com/playlist?list=…Image
Image
Image
Image
Image
Image
Image
Image
Image
Read 4 tweets
Nov 23, 2023
TOP-DOWN ANALYSIS EXPLAINED WITH 5 CHART IMAGES

1:
(a) 1-week timeframe market structure (premium and discount)
(b) point of interest
(c) anticipation Image
2: Price taps into the 1week point of interest Image
4: Drop down to the 1-hour time frame for a confirmation entry

(a) a sweep of the previous low, creating a protected low
(b) a break of structure creating a swing structure
(c) liquidity validates the point of interest
(d) entry Image
Read 4 tweets
Apr 3, 2023
If you used to pray before you got rich.

Then stopped praying after you got rich,

you're only preparing to FALL BIG and might never come back from it

Cause, that's the time to get much closer to God, lotta eyes on you, a few well-wishers, and lots of bad wishers

1/4
If you used to backtest, study and journal your trades before you made the big bag from trading

Then stopped doing it cause you think you already understand the markets,

One loss, just one loss will likely send you back to penury.
When we finally reach a high position or attain a level of success that we've been working towards,

it's easy to feel like we can finally relax and let go of everything that got us there.

But it's important to remember that
Read 4 tweets
Mar 19, 2023
What happens 80% of the time when you analyze the M1 timeframe

Greater chance of false signals: Due to the increased noise, there is a greater chance of false signals or fake BOS, which can lead to losses for traders.

Too busy to edit it, Do Enjoy🙏

1/4 🧵
This is how I trade👇

Simple with no complexity

Structure, Liquidity and Entry 🤷‍♂️
Read 4 tweets
Nov 8, 2022
39 YES! Let's Go.

To start with, most times when price sweeps LIQUIDITY, it tends to rally up or down immediately, so it taps into the GAP (IPA/FVG) instead of the order block.

Now what is IPA/FVG?
A short 🧵
Pay close attention to learn from this 🗣️ Image
IPA (Inefficient Price Action) is a price action where orders aren't transferred/tapped into. It's also FVG (FAIR VALUE GAP)

EPA (Efficient Price Action) is when all of the price action is already filled and most likely heading to the next LIQ pool or unbalanced price area. ImageImage
A Line example, Image
Read 5 tweets
Oct 1, 2022
Daily cycle?
How price actually moves on a Typical Trading day.

how you can create a setup /BIAS of the day and also avoid fake CHANGE OF CHARACTERS.

A short 🧵
what happens on a Typical Trading Day?
3 sessions: ASIA >LONDON>NEW YORK.

accumulation of the initial high and the Low of the day are set to create
A Trap or False move out of the Asia Range against the Real intended move.

A Trend real move forms THE (HIGH OF THE DAY)
Are you lost? Relax, try to read it again 👆👇

THE POWER OF CYCLE:

*ASIA SESSION TENDS TO BUILD UP LIQUIDITY.

*LONDON SESSION GRABS FRANKFURT/ASIA LOW +PDL (so this may be Low is the low of the Day )
Read 6 tweets

Did Thread Reader help you today?

Support us! We are indie developers!


This site is made by just two indie developers on a laptop doing marketing, support and development! Read more about the story.

Become a Premium Member ($3/month or $30/year) and get exclusive features!

Become Premium

Don't want to be a Premium member but still want to support us?

Make a small donation by buying us coffee ($5) or help with server cost ($10)

Donate via Paypal

Or Donate anonymously using crypto!

Ethereum

0xfe58350B80634f60Fa6Dc149a72b4DFbc17D341E copy

Bitcoin

3ATGMxNzCUFzxpMCHL5sWSt4DVtS8UqXpi copy

Thank you for your support!

Follow Us!

:(