The four defining elements of a trade setup are:
1. Expansion
2. Retracement
3. Reversal
4. Consolidation
The specific reference points in institutional order flow are:
1. Orderblocks
2. Fair Value Gaps & Liquidity Voids
3. Liquidity Pools
4. Equilibrium
1. Expansion
2. Retracement
3. Reversal
4. Consolidation
The specific reference points in institutional order flow are:
1. Orderblocks
2. Fair Value Gaps & Liquidity Voids
3. Liquidity Pools
4. Equilibrium
Understanding these two ideas will give you a greater understanding of the market efficiency paradigm:
The market efficiency paradigm describes how "smart money" interprets price and influences speculative, uninformed money.
The market efficiency paradigm describes how "smart money" interprets price and influences speculative, uninformed money.

The Interbank Price Delivery Algorithm (IPDA) also known as the ‘algo’ is an AI that delivers prices.
It is very efficient for markets to be made this way.
The markets are not ‘free’ and are manipulated especially in the Forex market.
It is very efficient for markets to be made this way.
The markets are not ‘free’ and are manipulated especially in the Forex market.

The True Day Daily Range:
IPDA defines the daily range between 12:00 am New York Time & 3:00 pm New York Time.
The period outside this specific range is referred to as “dead time”.
IPDA defines the daily range between 12:00 am New York Time & 3:00 pm New York Time.
The period outside this specific range is referred to as “dead time”.

The general daily range structure of how the markets move is as follows:
Price Equilibrium
Manipulation
Expansion
Reversal
Retracement
Consolidation
Price Equilibrium
Manipulation
Expansion
Reversal
Retracement
Consolidation
Expansion:
Expansion is where price moves quickly from a level of Equilibrium.
When price moves quickly from an area this shows a willingness of the Market Makers to show their hand.
In this case, we look for Orderblocks at or near Equilibrium.

Expansion is where price moves quickly from a level of Equilibrium.
When price moves quickly from an area this shows a willingness of the Market Makers to show their hand.
In this case, we look for Orderblocks at or near Equilibrium.


Retracement:
When the price moves back inside the recently created price range.
When price returns inside the recent price range this indicates the Market Makers want to reprice to levels inefficiently traded.
In this case, we look for Fair Value Gaps and Liquidity Voids.

When the price moves back inside the recently created price range.
When price returns inside the recent price range this indicates the Market Makers want to reprice to levels inefficiently traded.
In this case, we look for Fair Value Gaps and Liquidity Voids.


Reversal:
When price moves in the opposite direction that IPDA has been allowing.
When price has a reversal it indicates that Smart Money have ran liquidity and a large move should unfold in a new direction.
Look for Liquidity Pools above an old high or below an old low.

When price moves in the opposite direction that IPDA has been allowing.
When price has a reversal it indicates that Smart Money have ran liquidity and a large move should unfold in a new direction.
Look for Liquidity Pools above an old high or below an old low.


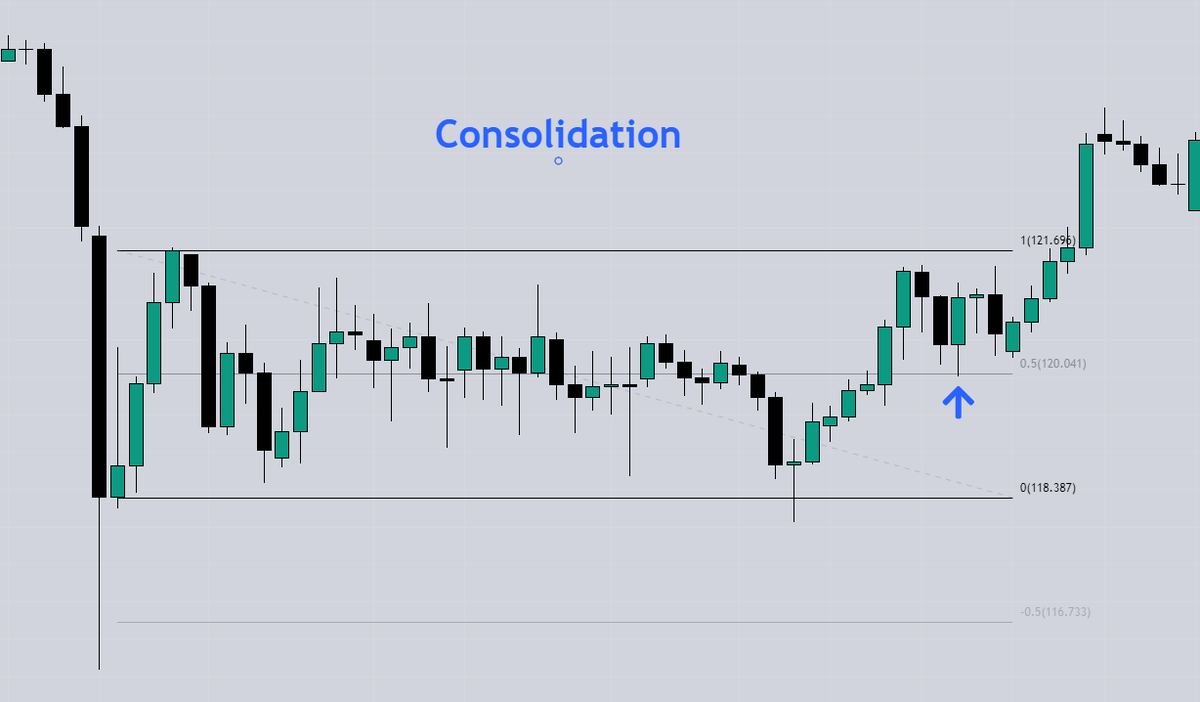
Consolidation:
Consolidation is when price moves in a range and shows no movement higher or lower.
When price consolidates it indicates Market Makers want to hold the price and build in orders on both sides of the market.
Look for the impulse price swing from the Equilibrium.

Consolidation is when price moves in a range and shows no movement higher or lower.
When price consolidates it indicates Market Makers want to hold the price and build in orders on both sides of the market.
Look for the impulse price swing from the Equilibrium.


Equilibrium vs. Discount:
After a market makes a run higher and begins to retrace lower, look for a drop below 50% of the price run.
A drop below 50% indicates a discounted price.
This frames ideal buy setups.
After a market makes a run higher and begins to retrace lower, look for a drop below 50% of the price run.
A drop below 50% indicates a discounted price.
This frames ideal buy setups.

Equilibrium vs. Premium
After a market runs lower and begins to retrace higher, look for a rise above the 50% level of the price run lower.
A rise above 50% indicates that the price is now at a premium.
Framing ideal sell setups.
After a market runs lower and begins to retrace higher, look for a rise above the 50% level of the price run lower.
A rise above 50% indicates that the price is now at a premium.
Framing ideal sell setups.

Liquidity Void:
After a sharp run in price, the largest candles that form at the last are efficiently traded.
Sudden runs in price will leave gaps in price action that tend to fill later on.
This is described as a void of market liquidity or a Liquidity Void.
After a sharp run in price, the largest candles that form at the last are efficiently traded.
Sudden runs in price will leave gaps in price action that tend to fill later on.
This is described as a void of market liquidity or a Liquidity Void.

Fair Valuation:
When the price trades back inside its current range and returns to the levels it moved from, this is Fair Valuation.
These are good locations to take profits on positions and do not require moving outside the current range.
When the price trades back inside its current range and returns to the levels it moved from, this is Fair Valuation.
These are good locations to take profits on positions and do not require moving outside the current range.

Fair Value Gap:
When price leaves a level and only has a small section of price action in one direction, this is known as a Fair Value Gap.
They can be objectives for profits or new setups, depending on the market environment.
When price leaves a level and only has a small section of price action in one direction, this is known as a Fair Value Gap.
They can be objectives for profits or new setups, depending on the market environment.

Low Resistance Liquidity Run:
When the price has little Resistance on its way running to an area of Liquidity.
This is classically seen just under an old high or above an old low.
Price will move quickly normally on the release of an economic news release.
When the price has little Resistance on its way running to an area of Liquidity.
This is classically seen just under an old high or above an old low.
Price will move quickly normally on the release of an economic news release.

Market Protraction
At specific times of day, a sudden move happens in the opposite to the daily range direction.
This is known as Market Protraction or “Judas Swing”.
It is a micro expansion in price-seeking liquidity before reversing.
At specific times of day, a sudden move happens in the opposite to the daily range direction.
This is known as Market Protraction or “Judas Swing”.
It is a micro expansion in price-seeking liquidity before reversing.

Conclusion:
The first month of the 12-month ICT Core Content was designed to introduce the foundation of ICT’s price action analysis.
Take Away:
Do not fear missing setups or trades.
They form daily for the institutional mindset trader.
The first month of the 12-month ICT Core Content was designed to introduce the foundation of ICT’s price action analysis.
Take Away:
Do not fear missing setups or trades.
They form daily for the institutional mindset trader.
Credit:
Here you can watch this month's module for free on ICTs YouTube
Original creator @I_Am_The_ICT
Graphics @daytradingrauf
Here you can watch this month's module for free on ICTs YouTube
Original creator @I_Am_The_ICT
Graphics @daytradingrauf
@I_Am_The_ICT @daytradingrauf Copy my winning trades!
Earn while you learn or get a second income.
Copy exactly what I’m doing in the markets.
7-day free trial for all who join!
Closes 2nd of October (for real).
Message me “FREE” to join!
twitter.com/messages/compo…
Earn while you learn or get a second income.
Copy exactly what I’m doing in the markets.
7-day free trial for all who join!
Closes 2nd of October (for real).
Message me “FREE” to join!
twitter.com/messages/compo…
I hope you enjoyed this thread.
If you did be sure to follow me @Trader_Theory for:
- Educational content
- Trading psychology tips
- Trading quotes
- And much more
If you did be sure to follow me @Trader_Theory for:
- Educational content
- Trading psychology tips
- Trading quotes
- And much more
• • •
Missing some Tweet in this thread? You can try to
force a refresh


