
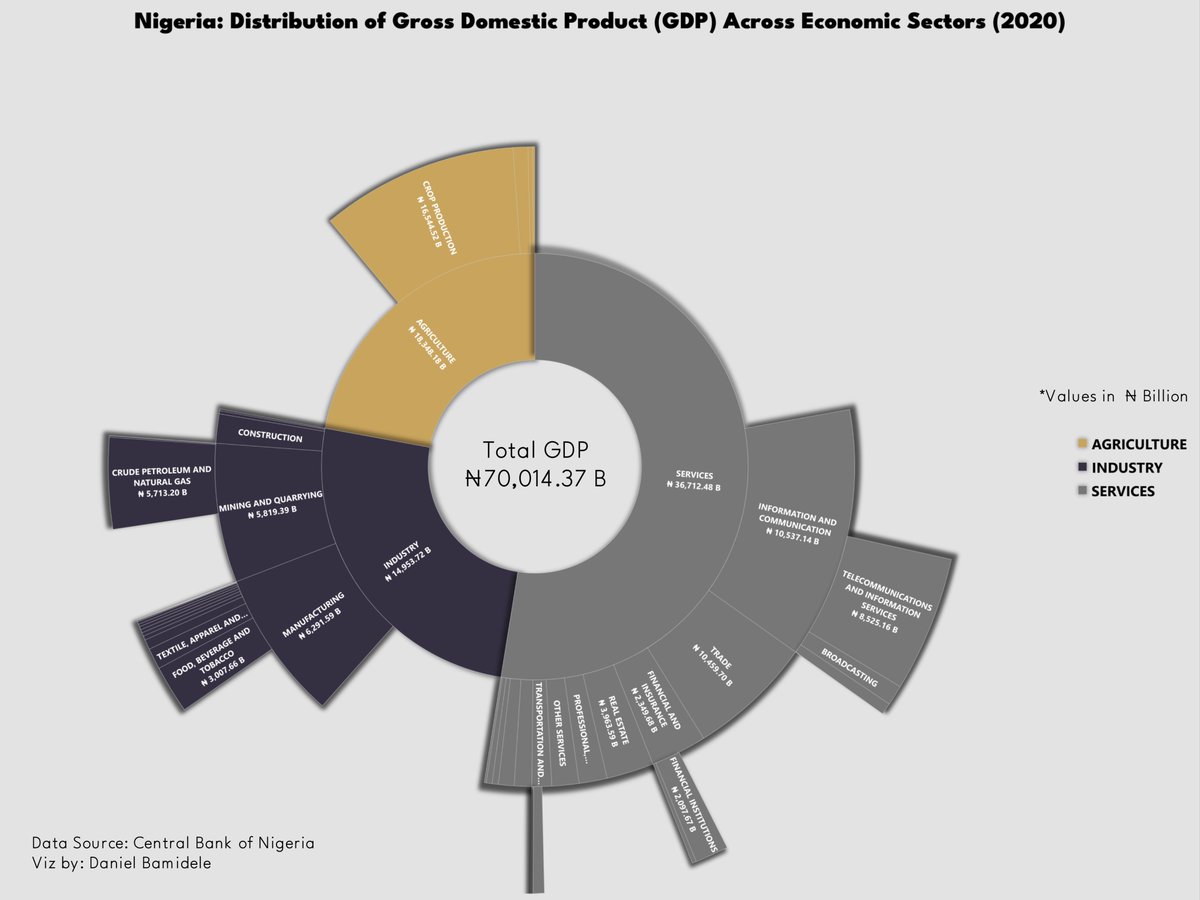
Hi #datafam, here’s a sunburst chart I made using Excel. This #viz shows how each economic sector contributed to Nigeria’s GDP in 2020. Data was obtained from CBN. Here's a thread with instructions on how to create this #viz in Excel.
🧵🧵
🧵🧵
@IbukunOshiga @Talktomissbela @HappyAdejoh @volkaseezn_ @IAGeographer1 @Angiepresh1 @el_victoriaa @_Promise_Nonso @agboolar3 @malcom_okonkwo @saltypip @Bawzz_lady
A Sunburst Chart is made up of an inner circle encircled by rings representing higher degrees of hierarchy. Each segment's angle is proportionate to a value or split evenly under its parent node.
The sunburst chart is best used for presenting hierarchical data.
The sunburst chart is best used for presenting hierarchical data.
Each level of the hierarchy is represented by a single ring or circle, with the innermost circle at the top. A sunburst chart demonstrates how the outer rings link to the inner circles. So, how exactly do we create a sunburst chart in Excel? It's quite simple.
All we need to do now is ensure that our data is formatted correctly. We must organize our table in a hierarchical order from left to right. Imagine the left-most column as the parent column and the ones on the right as the children.
Examine how the data in the table below is organized. Once you have your data in this format, simply highlight all the cells and insert a sunburst chart, and you're done.

Here's the sunburst chart for the data above.

Here's the data I used for my own #viz. It might look complicated but it follows the same principle. Also,😅😅 note that for larger hierarchies it's tricky to get the labeling right

That's all for today and as usual, if you have any questions, please leave them in the comments section and I'll do my best to answer them.
So guys, there are issues with this particular chart. And I'll address the pros and cons.
While this chart represents hierarchy very well, it doesn't do justice to actual proportions so that night be misleading. Thanks to @MalcolmNance for pointing this out to me.
If you look at the chart, you notice that the agriculture sector is larger than the industry sector by about 2tn but the chart makes the latter bigger.
I noticed that excel gives proportion based on how many children a particular node has. agriculture has 4 branches but industry has 5 so it looks bigger on the chart. This is misleading. You won't be able to visually understand the true data without reading the labels.
@seunmolz also pointed out to me that there's a more updated dataset for the gdp and the correct data to use is GDP at current price and I've seen the data on NBS's website so I'll be posting the updated chart soon.
So guys, of course I'm still learning and improving but one thing to always think about is the story your chart is telling. The viz might be visually compelling, but is it factual?
• • •
Missing some Tweet in this thread? You can try to
force a refresh


