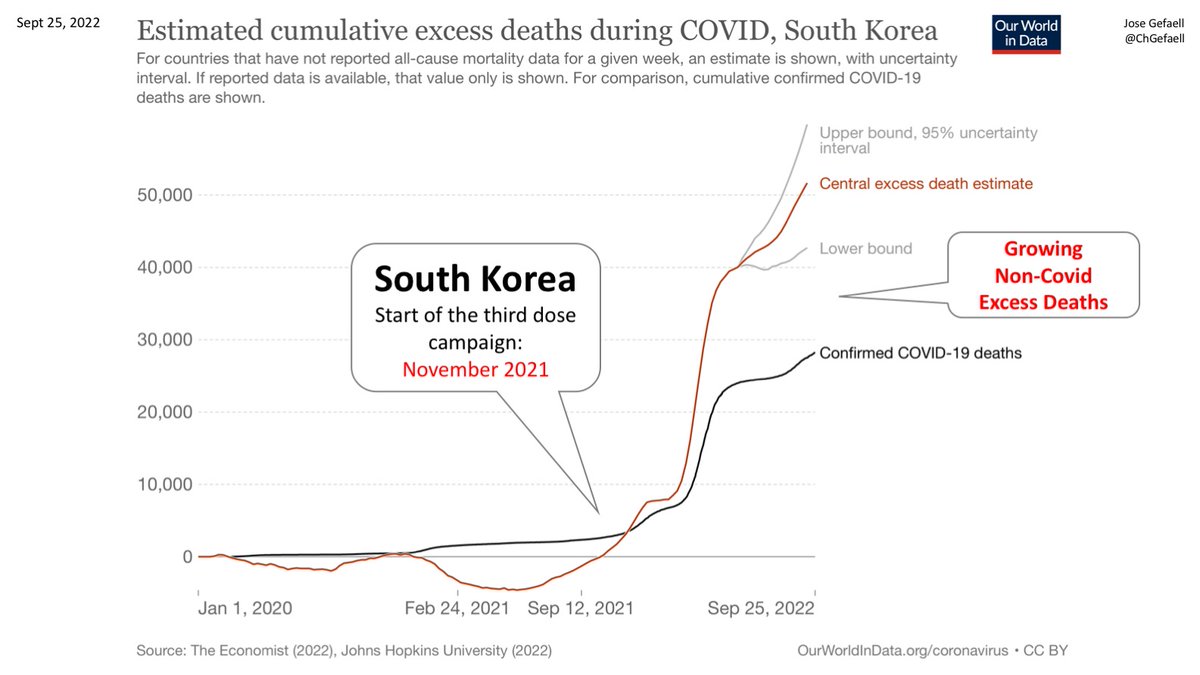
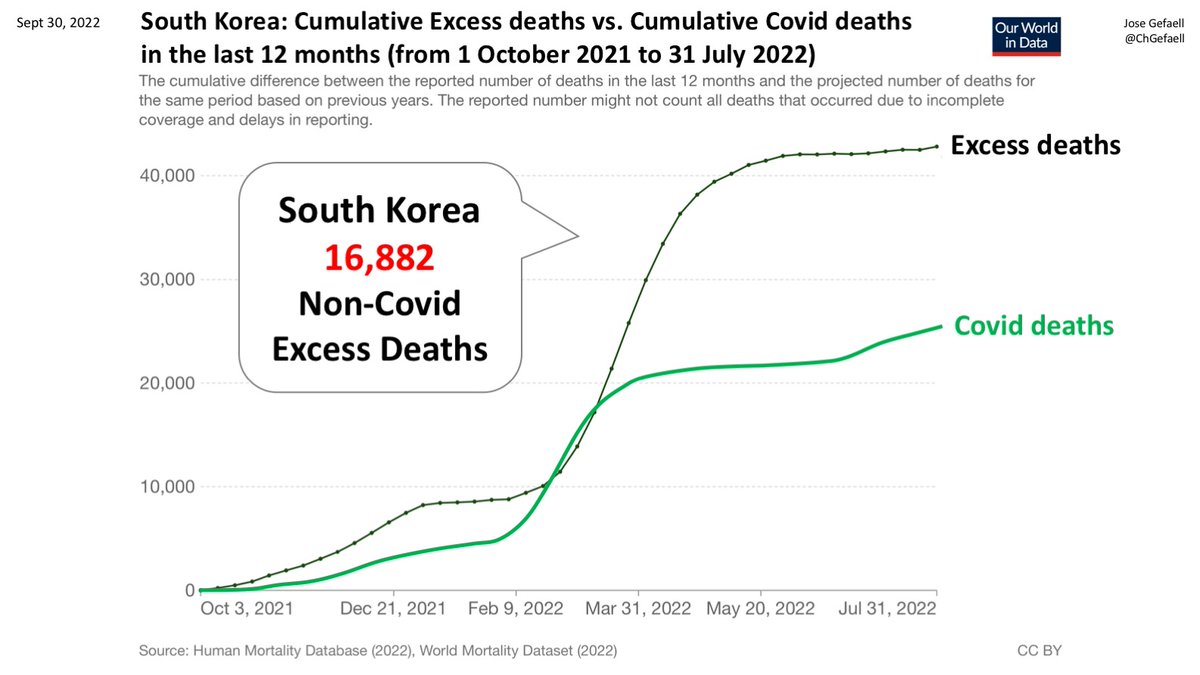
SOUTH KOREA
(Cumulative Non Covid Excess deaths since 1 October 2021 up to the date of the latest excess deaths release, as per Our World in Data).
1/
(Cumulative Non Covid Excess deaths since 1 October 2021 up to the date of the latest excess deaths release, as per Our World in Data).
1/
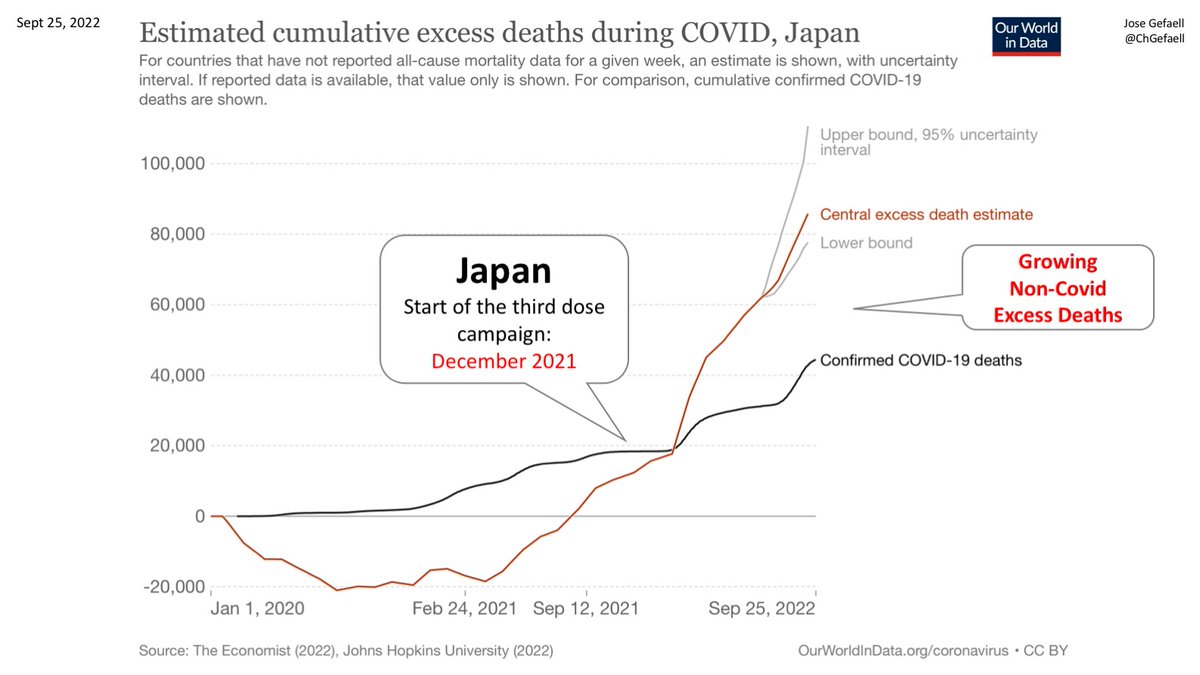
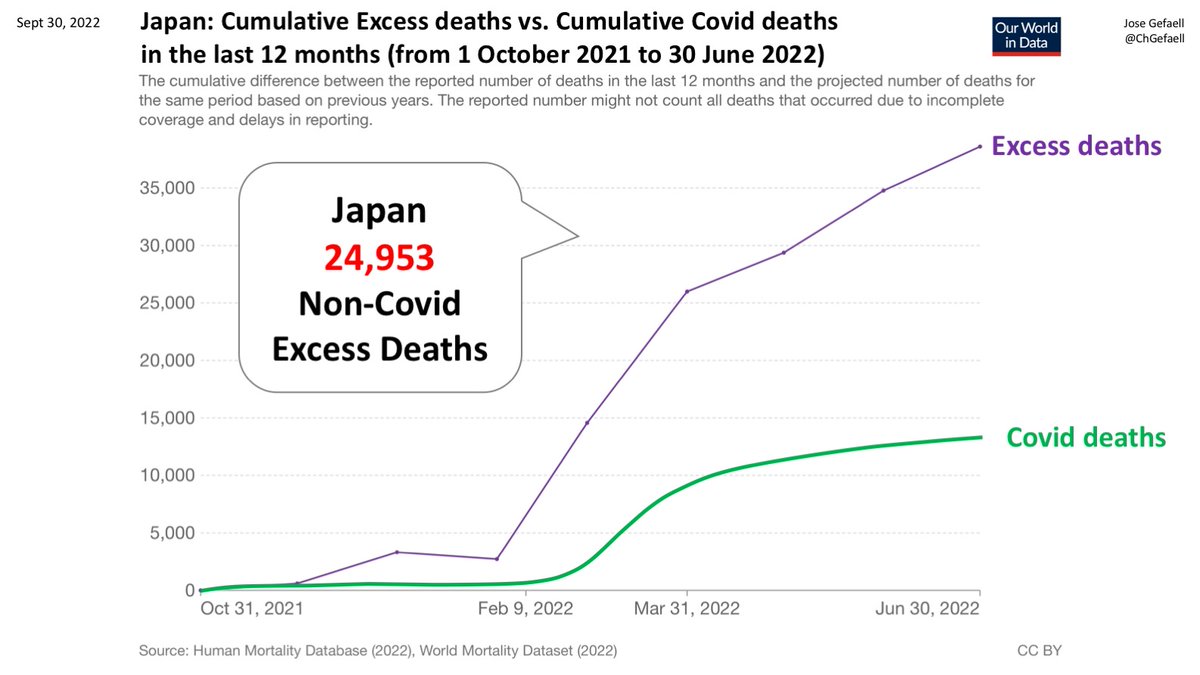
JAPAN
(Cumulative Non Covid Excess deaths since 1 October 2021 up to the date of the latest excess deaths release, as per Our World in Data).
2/
(Cumulative Non Covid Excess deaths since 1 October 2021 up to the date of the latest excess deaths release, as per Our World in Data).
2/
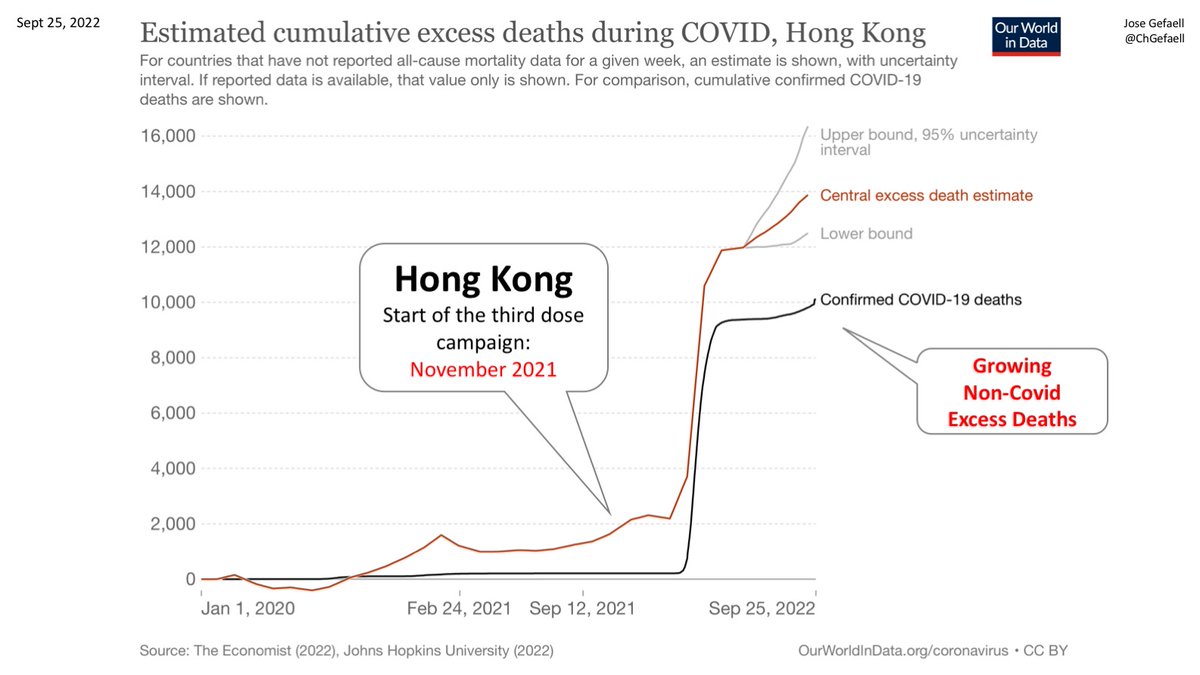
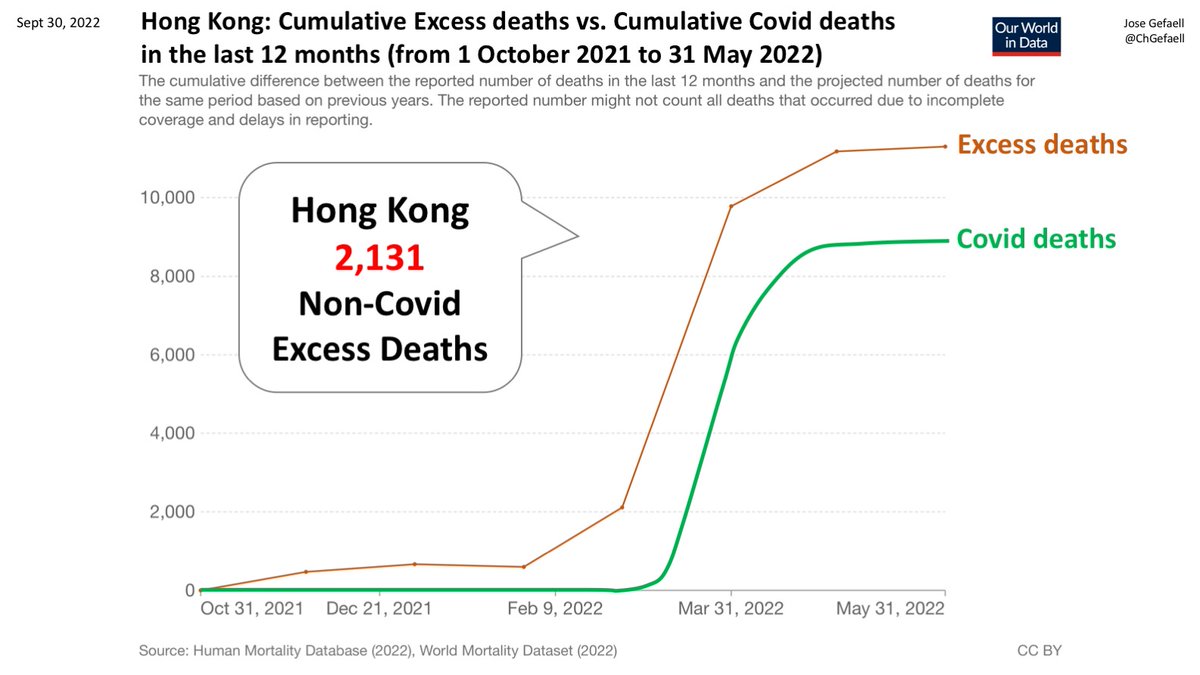
HONG KONG
(Cumulative Non Covid Excess deaths since 1 October 2021 up to the date of the latest excess deaths release, as per Our World in Data).
3/
(Cumulative Non Covid Excess deaths since 1 October 2021 up to the date of the latest excess deaths release, as per Our World in Data).
3/
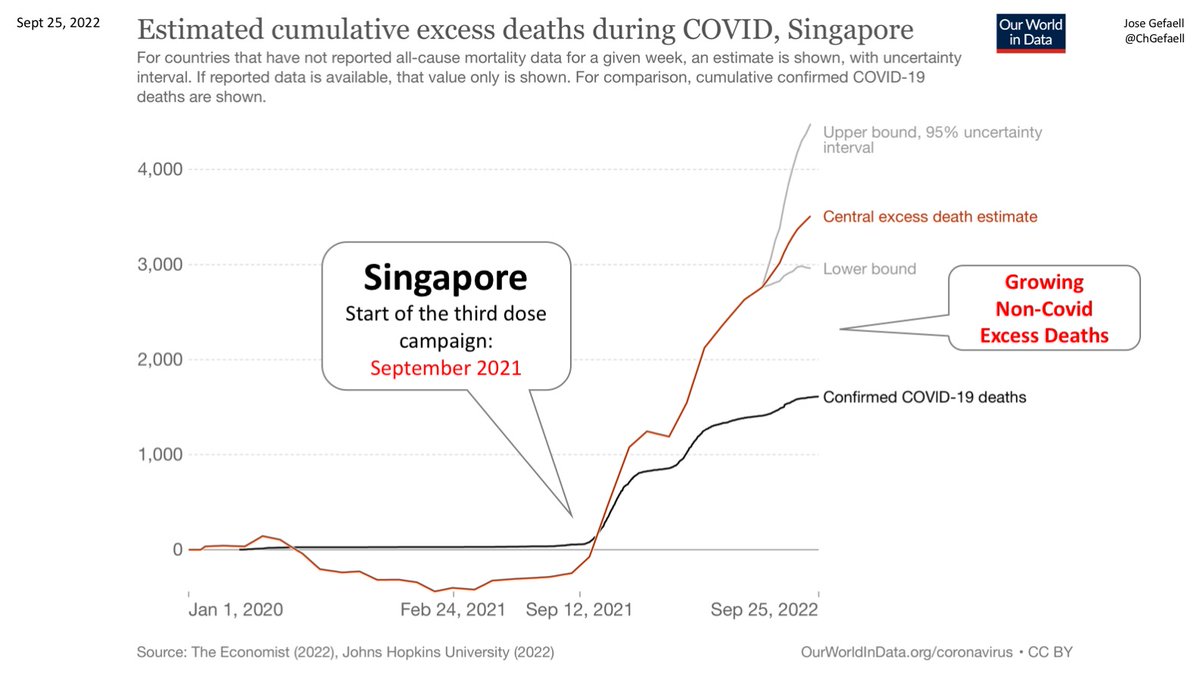
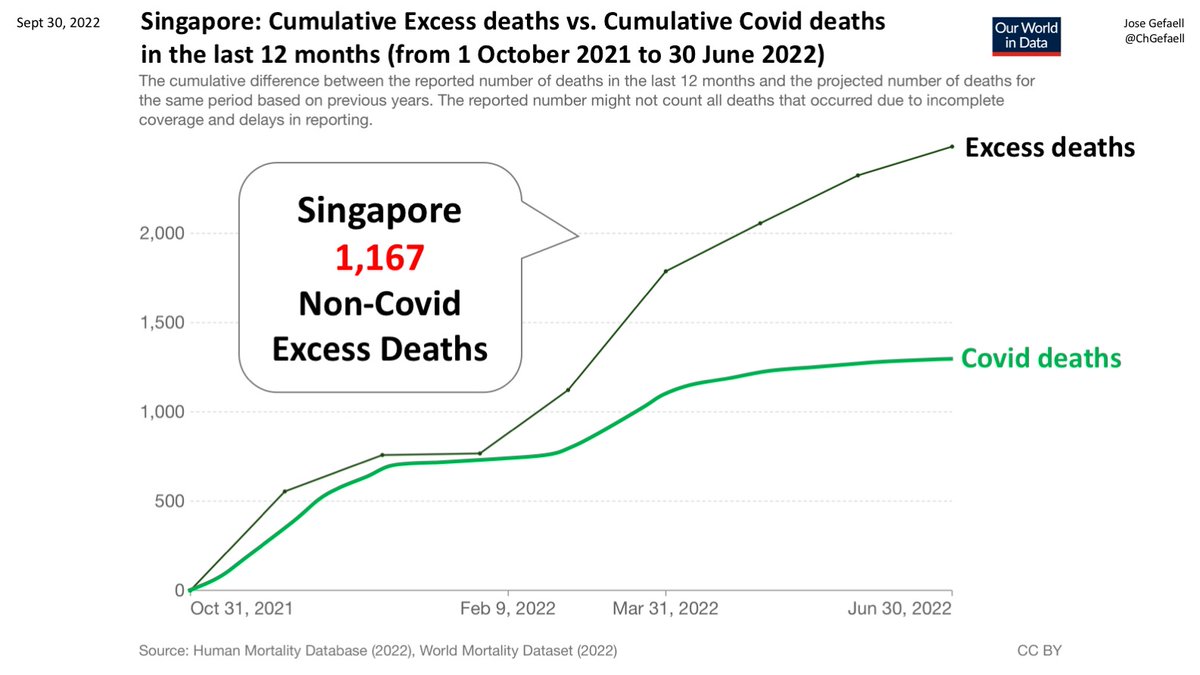
SINGAPORE
(Cumulative Non Covid Excess deaths since 1 October 2021 up to the date of the latest excess deaths release, as per Our World in Data).
4/
(Cumulative Non Covid Excess deaths since 1 October 2021 up to the date of the latest excess deaths release, as per Our World in Data).
4/
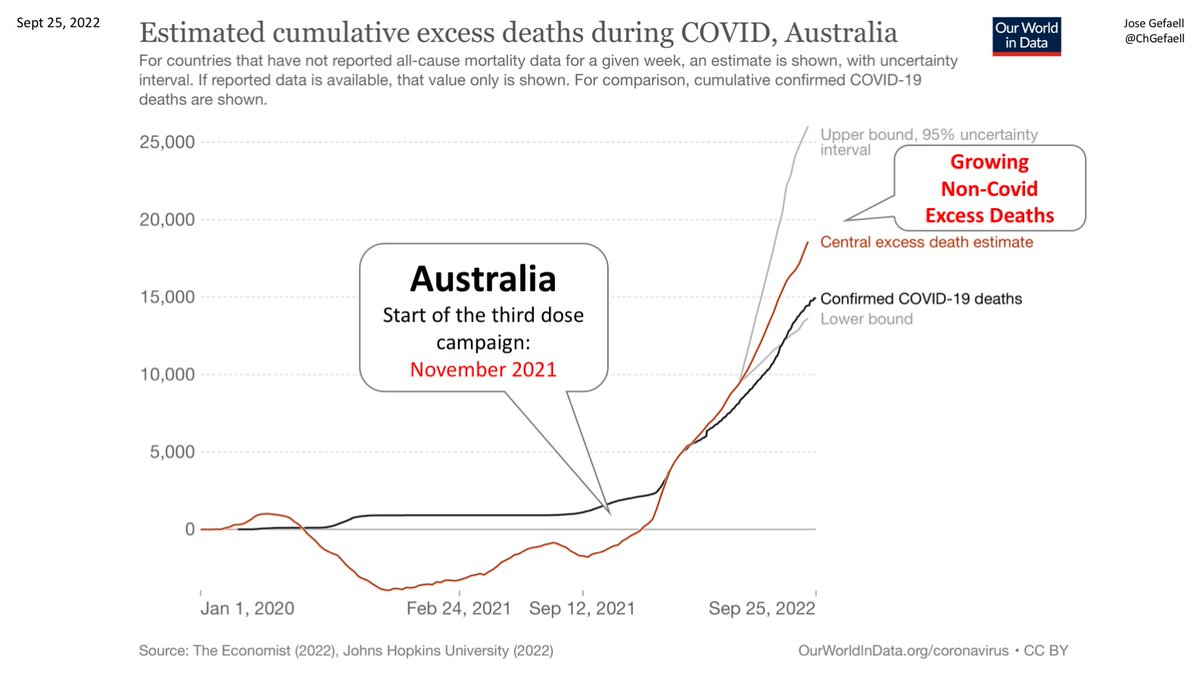
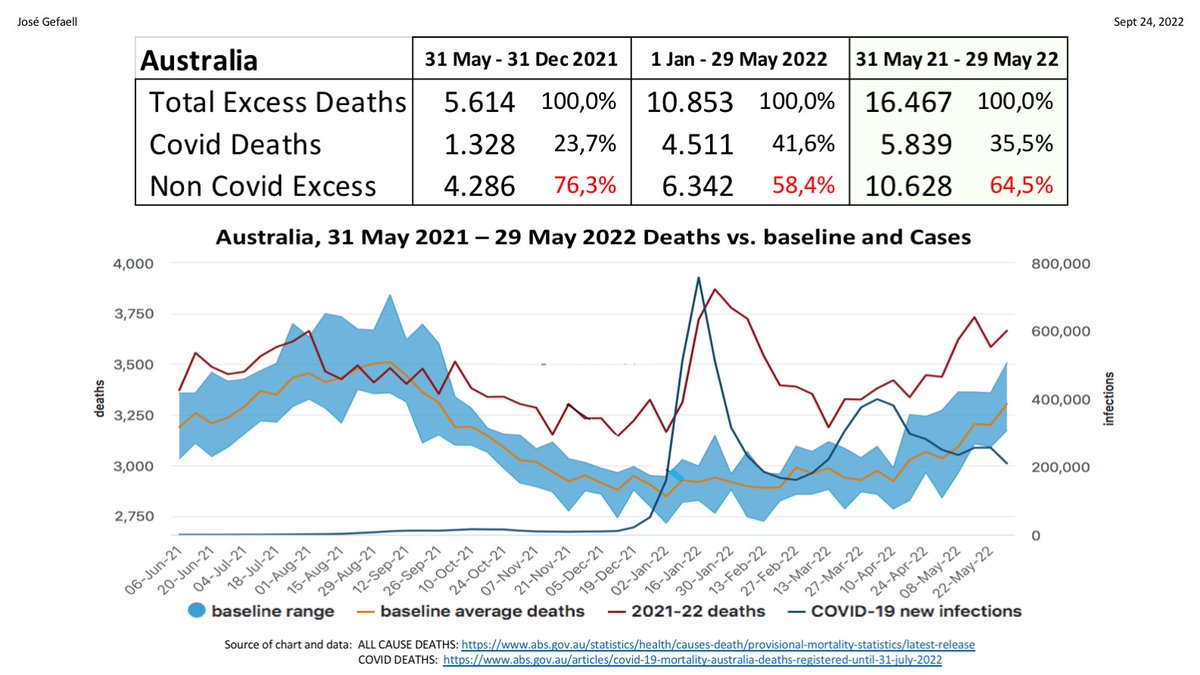
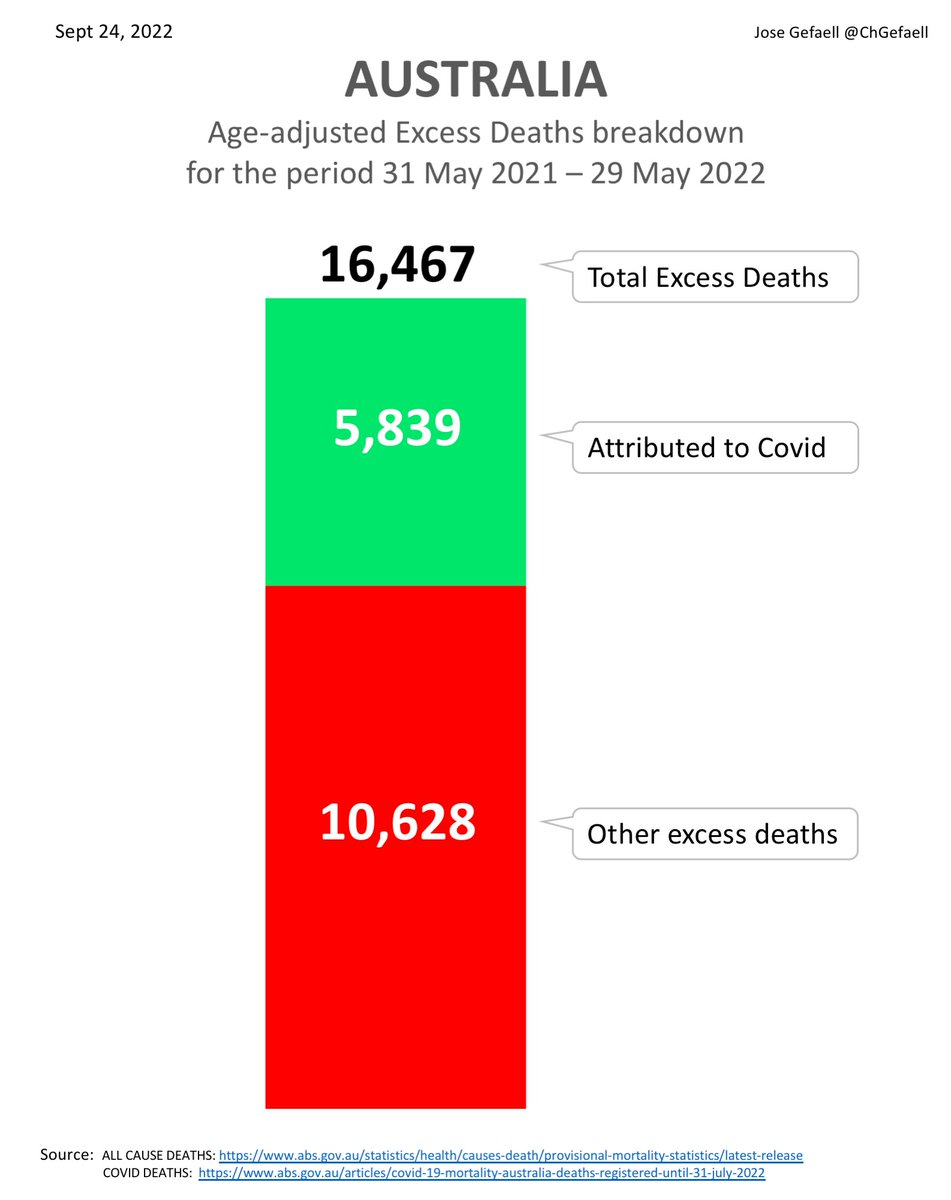
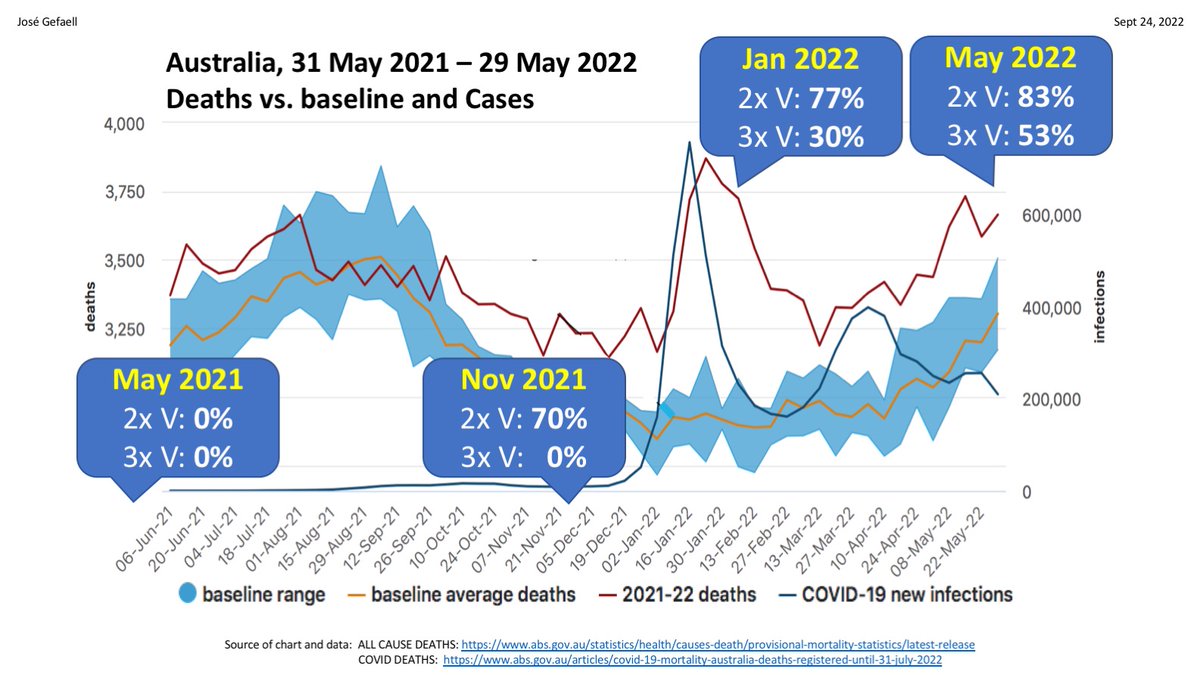
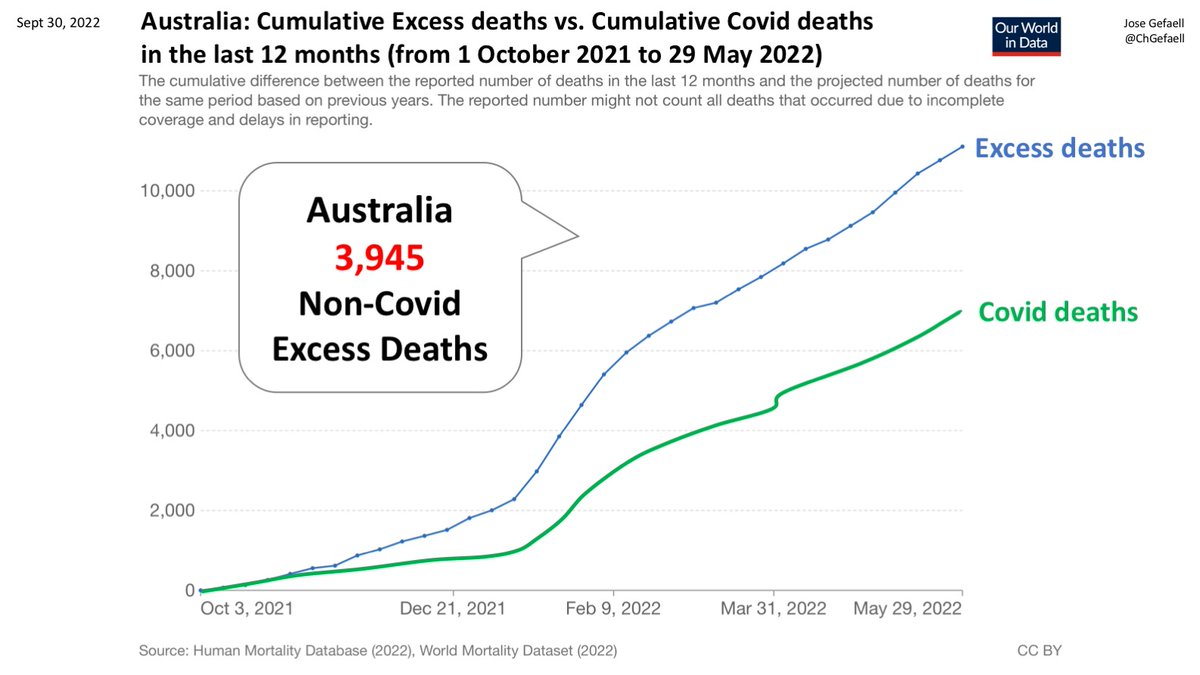
AUSTRALIA
(Cumulative Non Covid Excess deaths since 1 October 2021 up to the date of the latest excess deaths release, as per Our World in Data).
5/
(Cumulative Non Covid Excess deaths since 1 October 2021 up to the date of the latest excess deaths release, as per Our World in Data).
5/
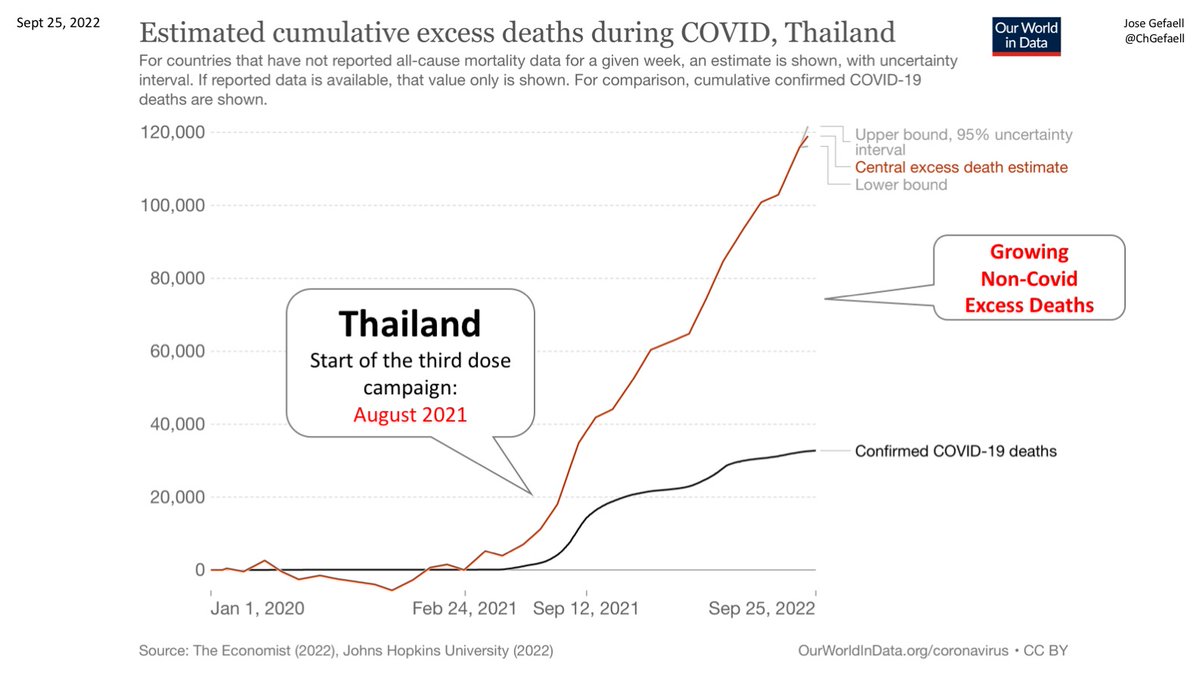
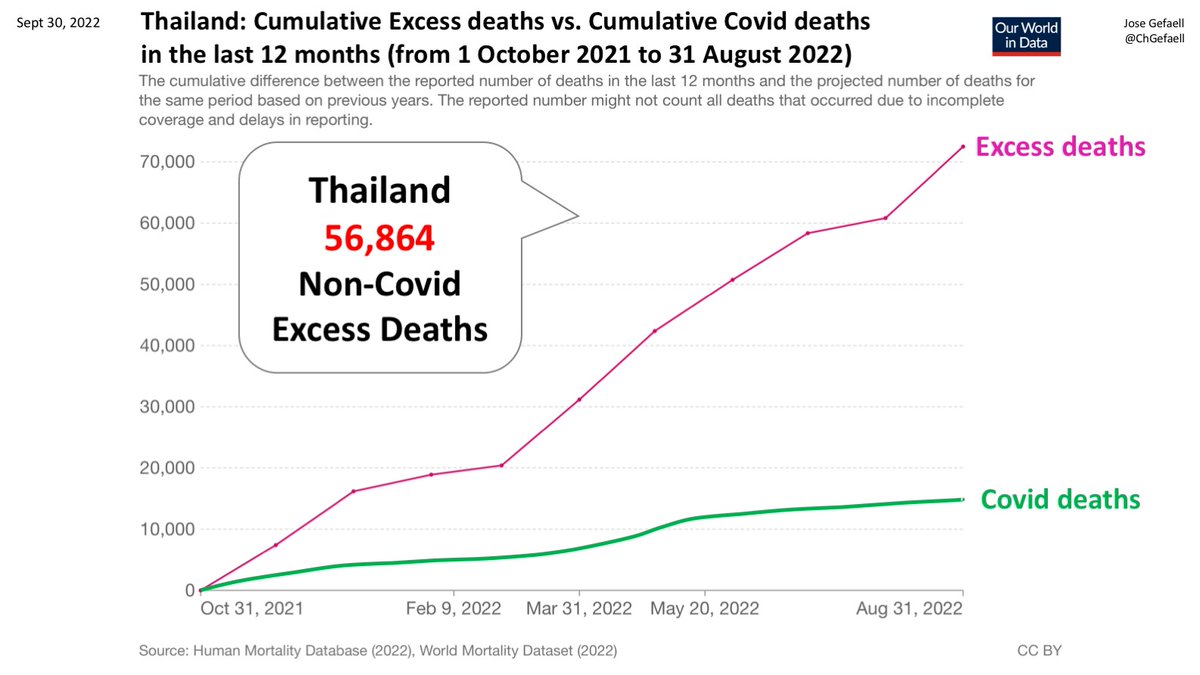
THAILAND
(Cumulative Non Covid Excess deaths since 1 October 2021 up to the date of the latest excess deaths release, as per Our World in Data).
6/
(Cumulative Non Covid Excess deaths since 1 October 2021 up to the date of the latest excess deaths release, as per Our World in Data).
6/
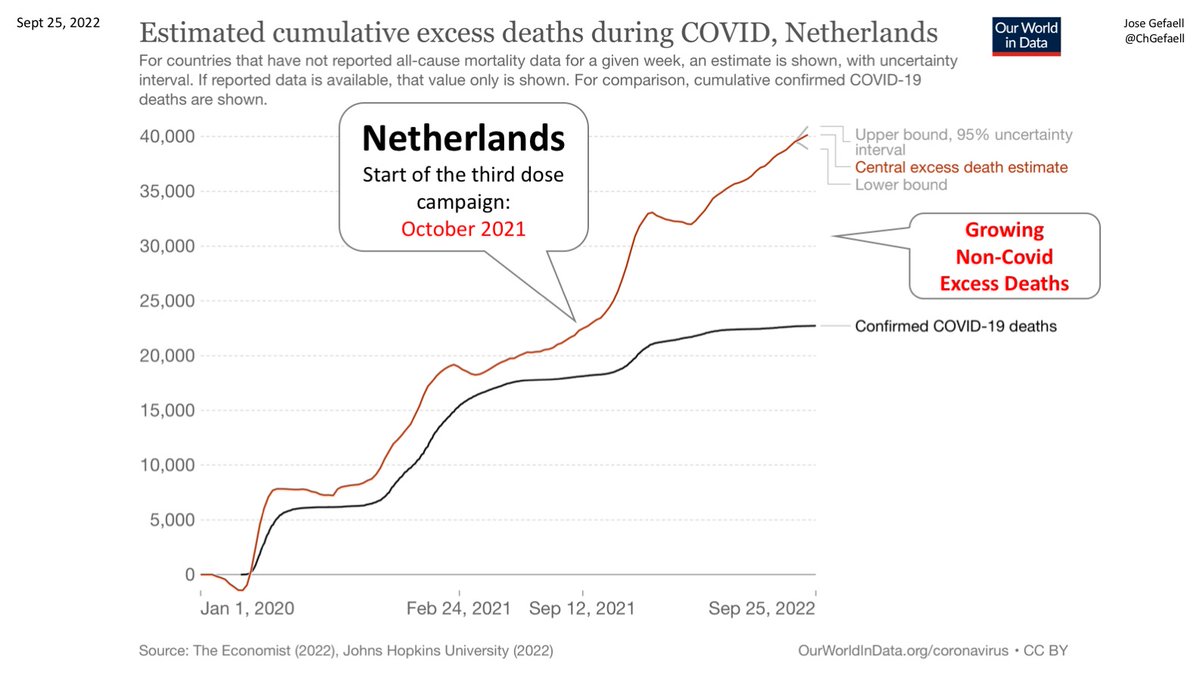
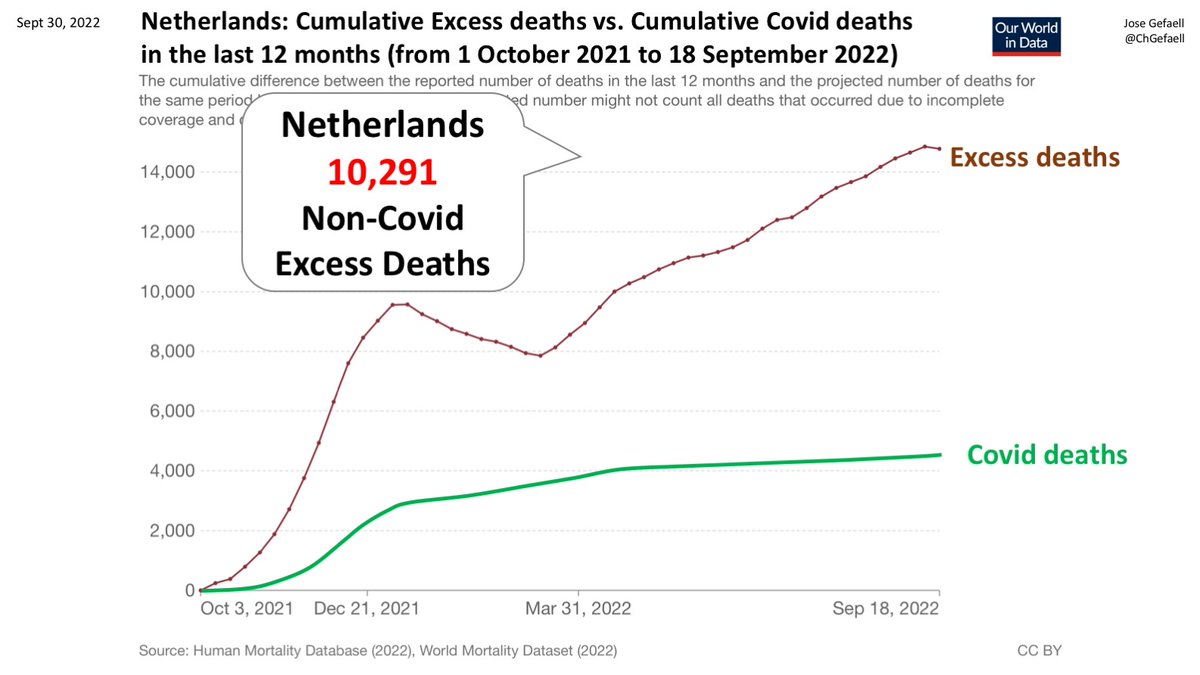
NETHERLANDS
(Cumulative Non Covid Excess deaths since 1 October 2021 up to the date of the latest excess deaths release, as per Our World in Data).
7/
(Cumulative Non Covid Excess deaths since 1 October 2021 up to the date of the latest excess deaths release, as per Our World in Data).
7/
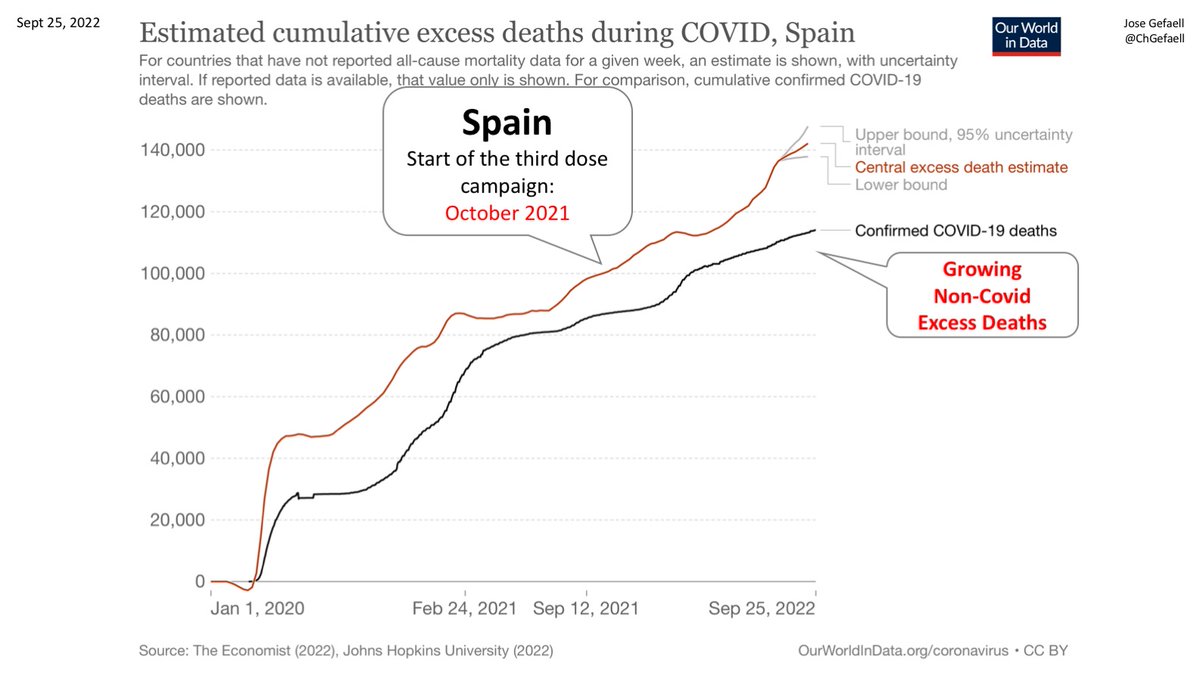
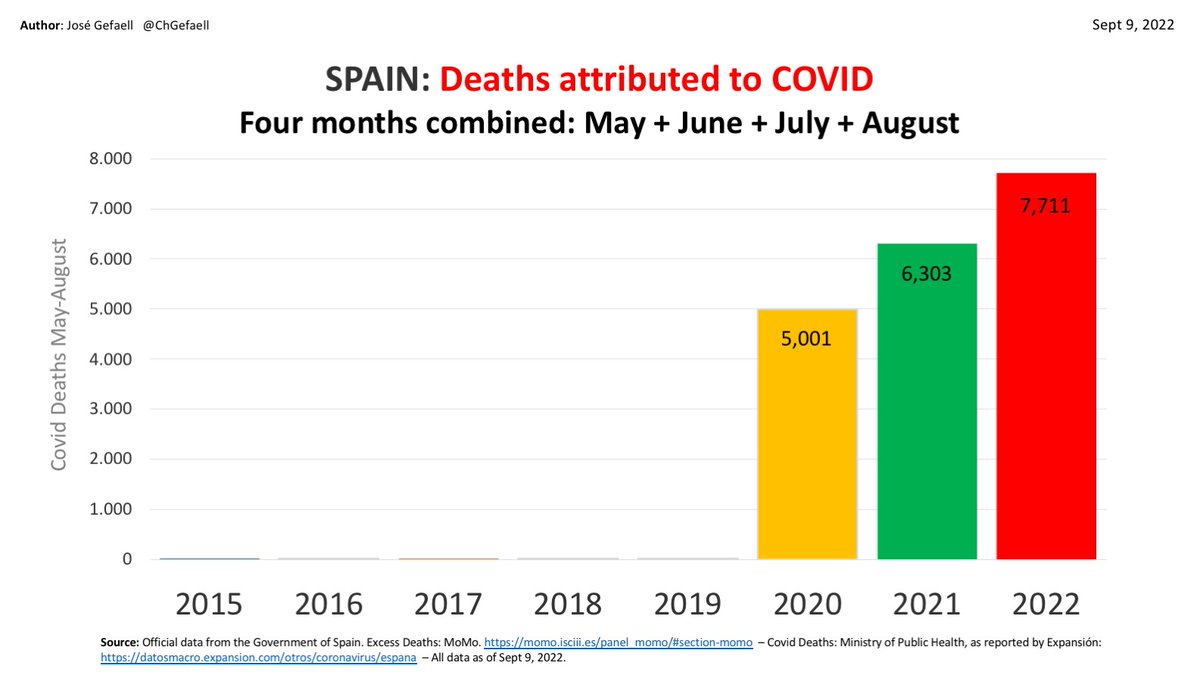
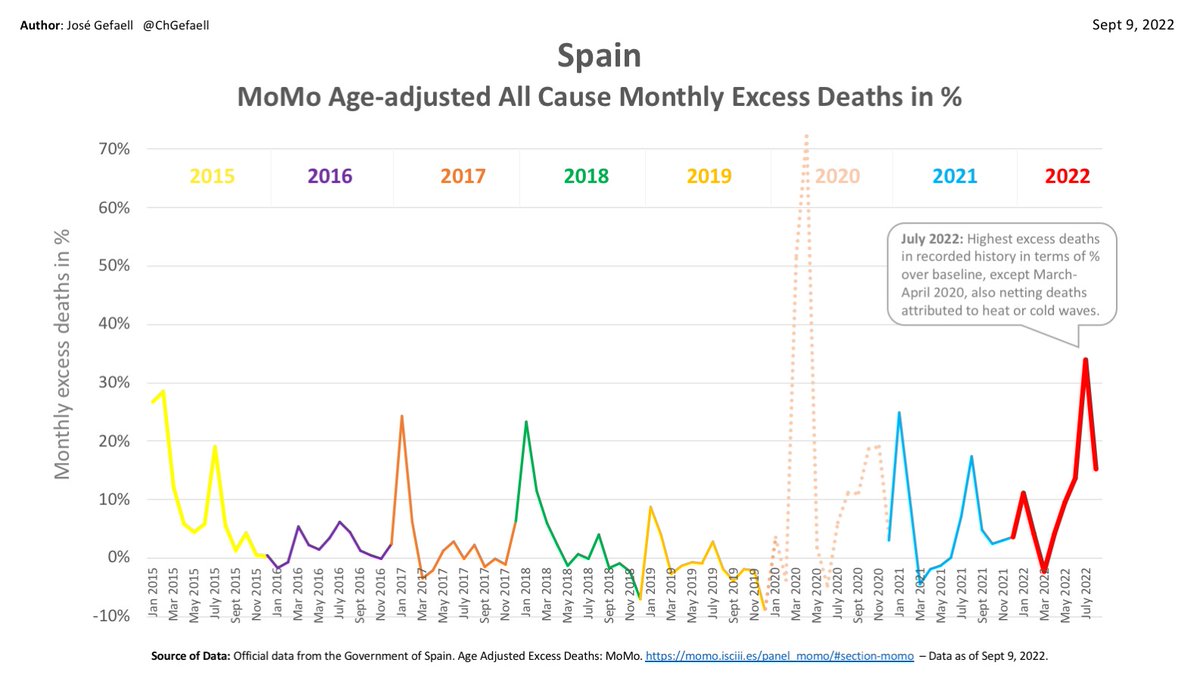
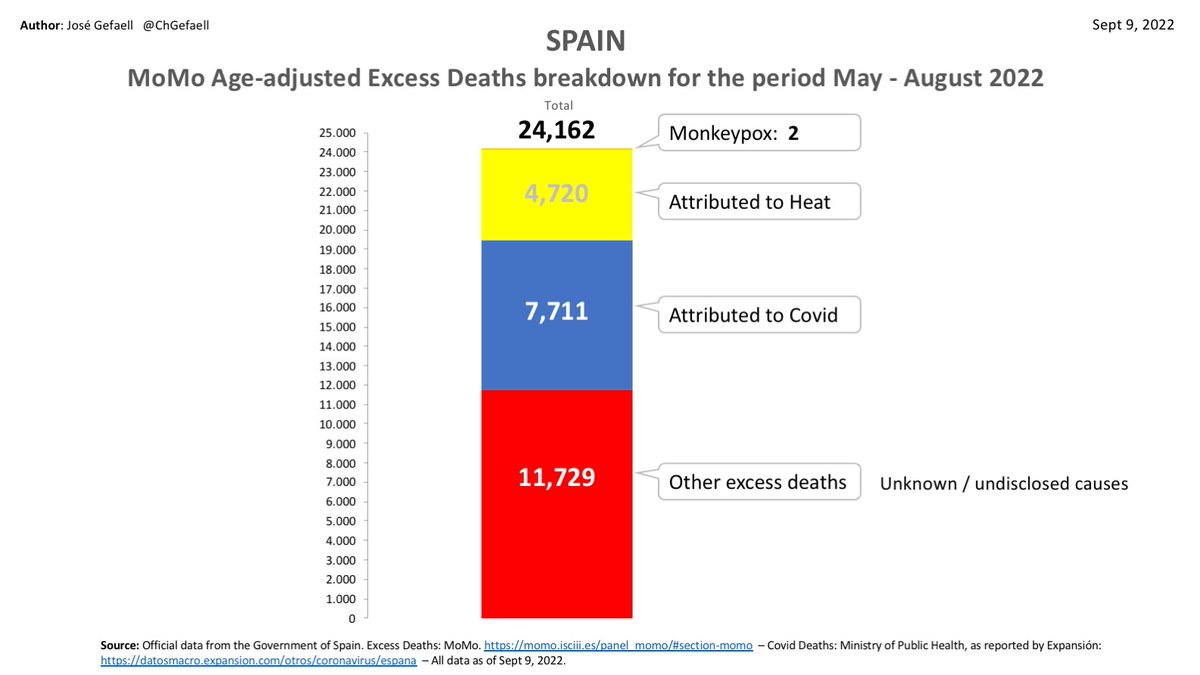
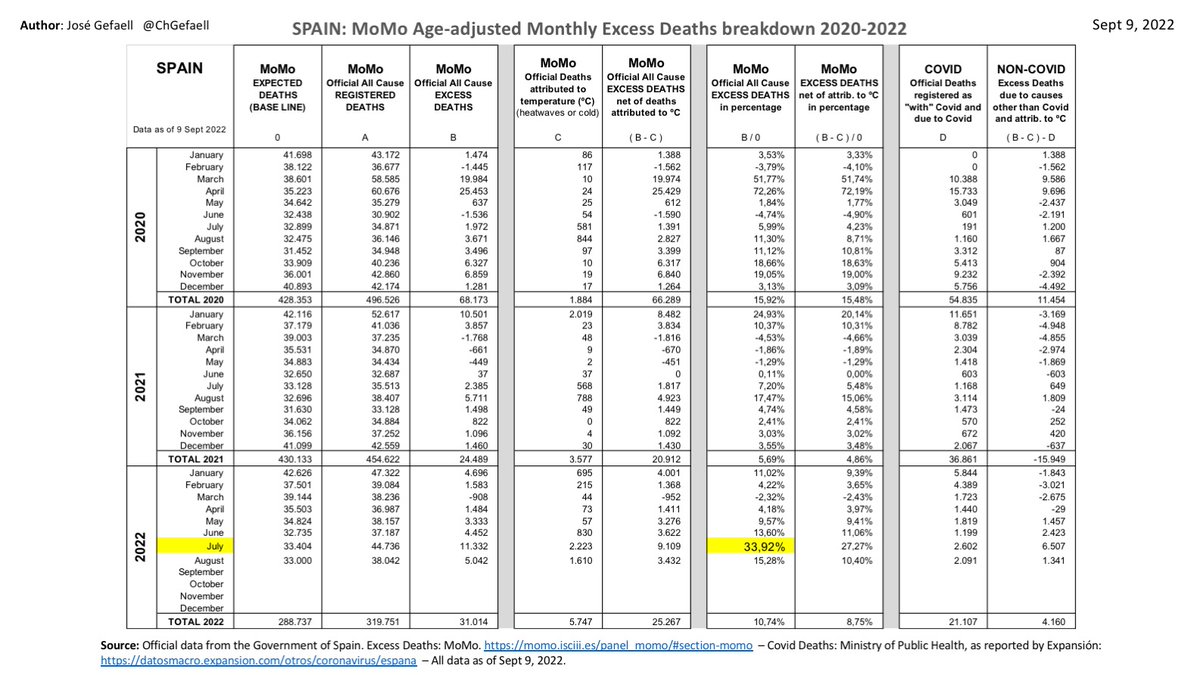
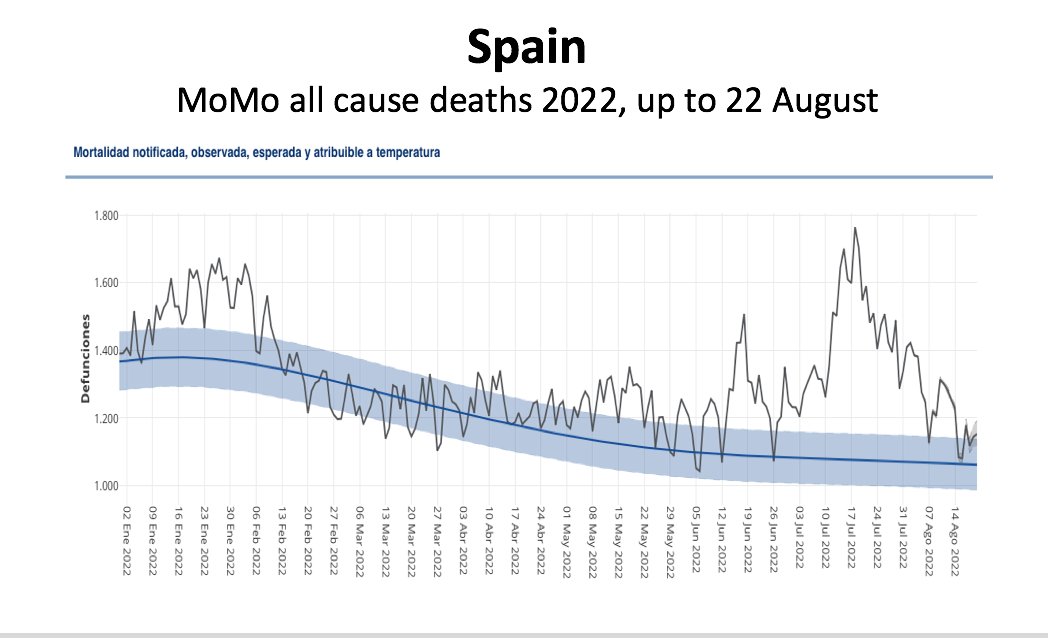
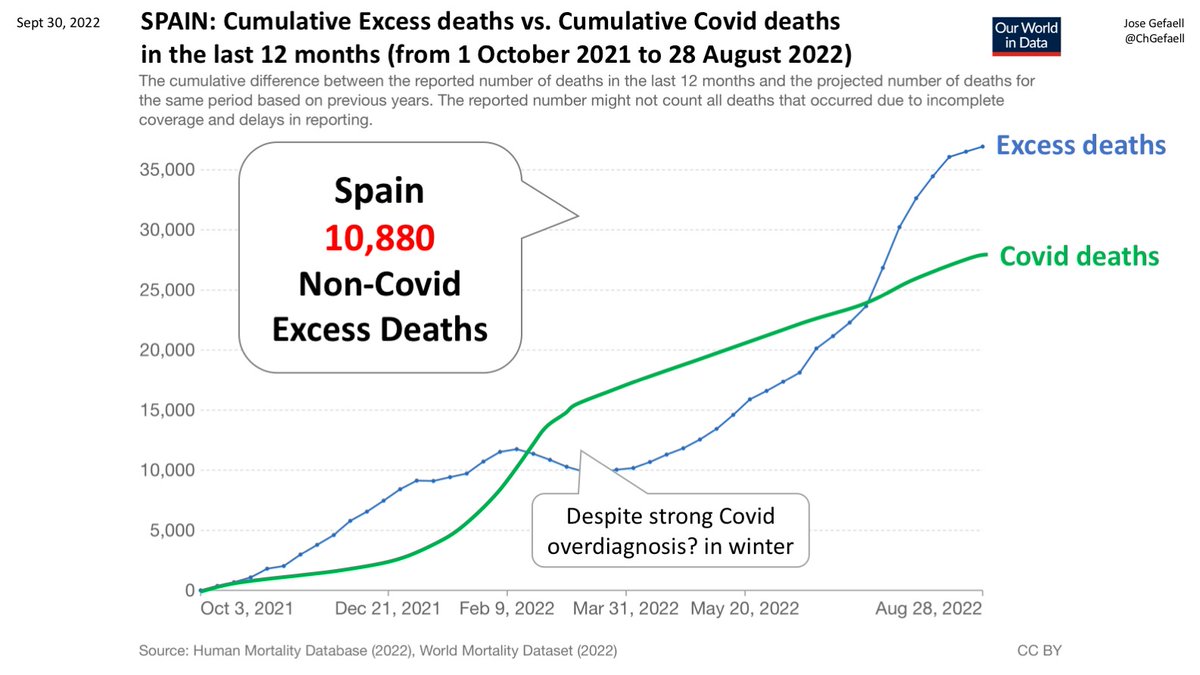
SPAIN
(Cumulative Non Covid Excess deaths since 1 October 2021 up to the date of the latest excess deaths release, as per Our World in Data).
8/
(Cumulative Non Covid Excess deaths since 1 October 2021 up to the date of the latest excess deaths release, as per Our World in Data).
8/
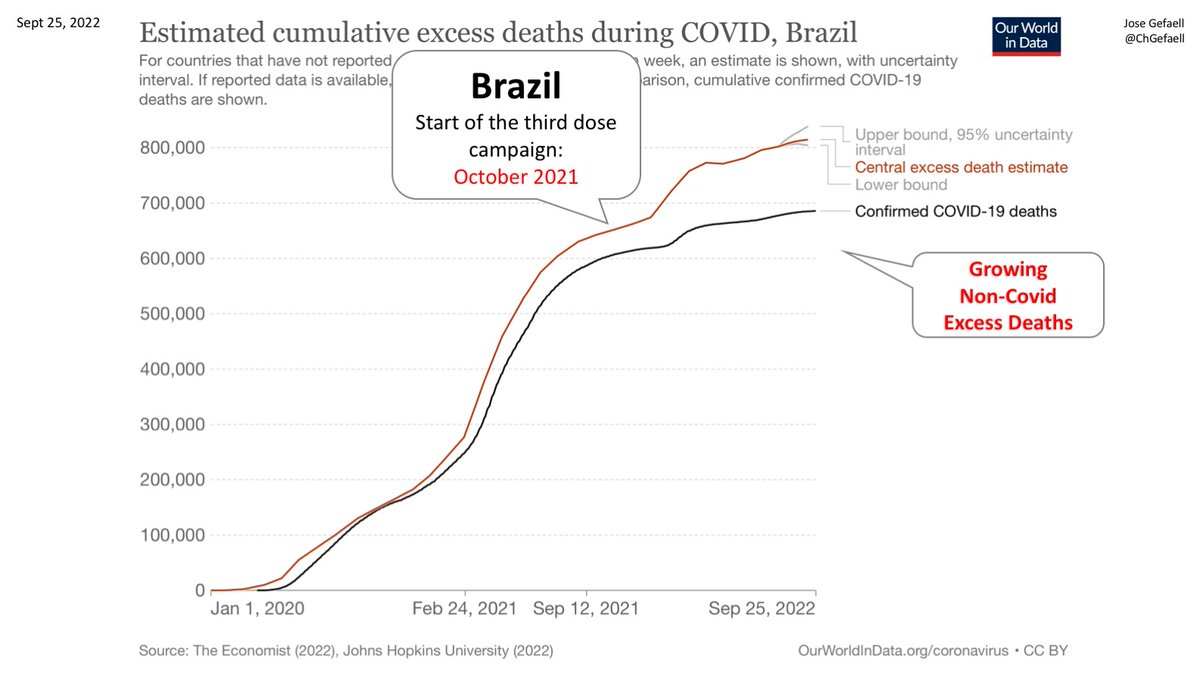
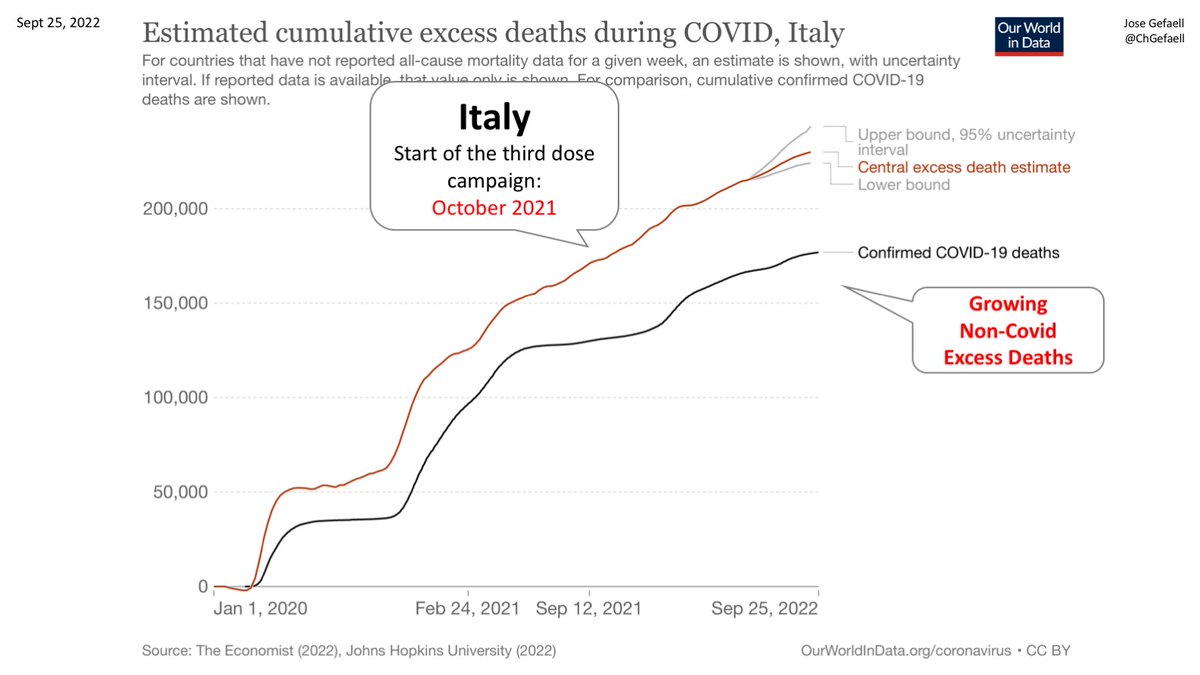
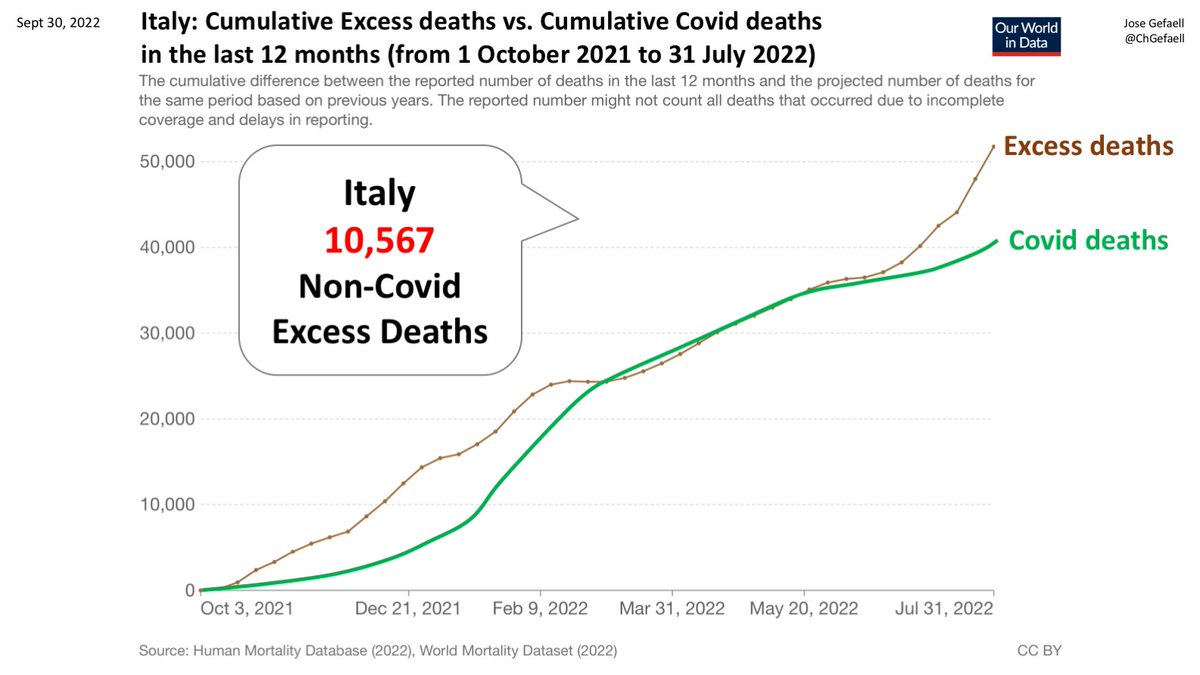
ITALY
(Cumulative Non Covid Excess deaths since 1 October 2021 up to the date of the latest excess deaths release, as per Our World in Data).
9/
(Cumulative Non Covid Excess deaths since 1 October 2021 up to the date of the latest excess deaths release, as per Our World in Data).
9/
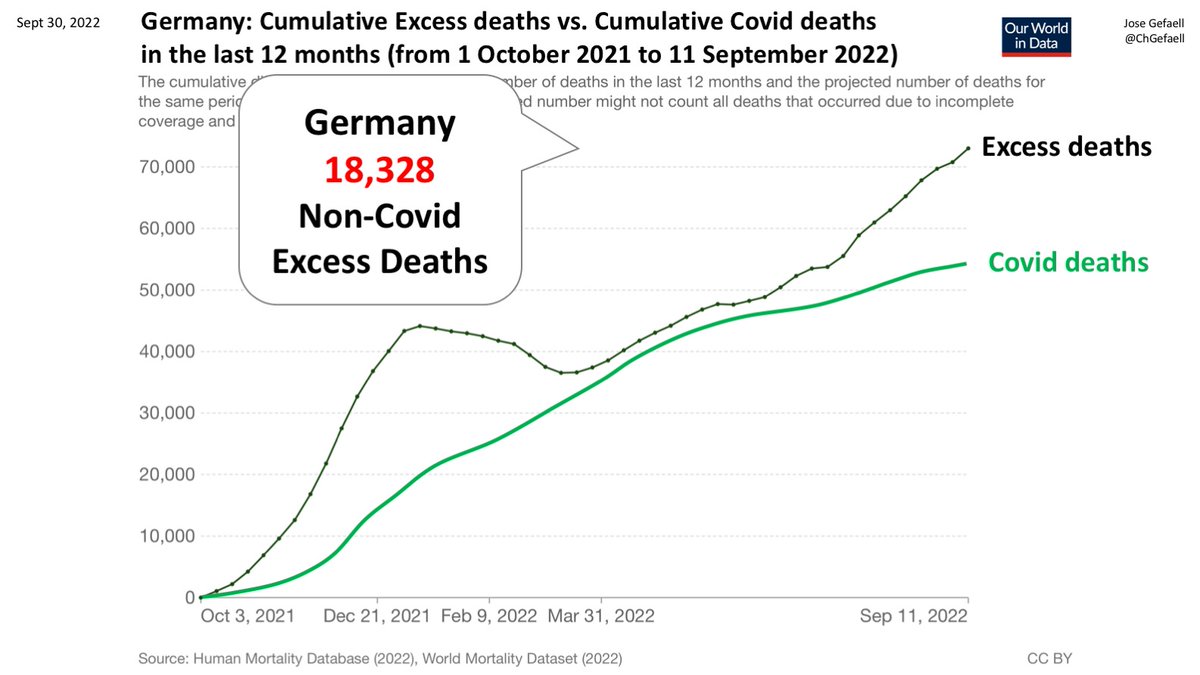
GERMANY
(Cumulative Non Covid Excess deaths since 1 October 2021 up to the date of the latest excess deaths release, as per Our World in Data).
10/
(Cumulative Non Covid Excess deaths since 1 October 2021 up to the date of the latest excess deaths release, as per Our World in Data).
10/
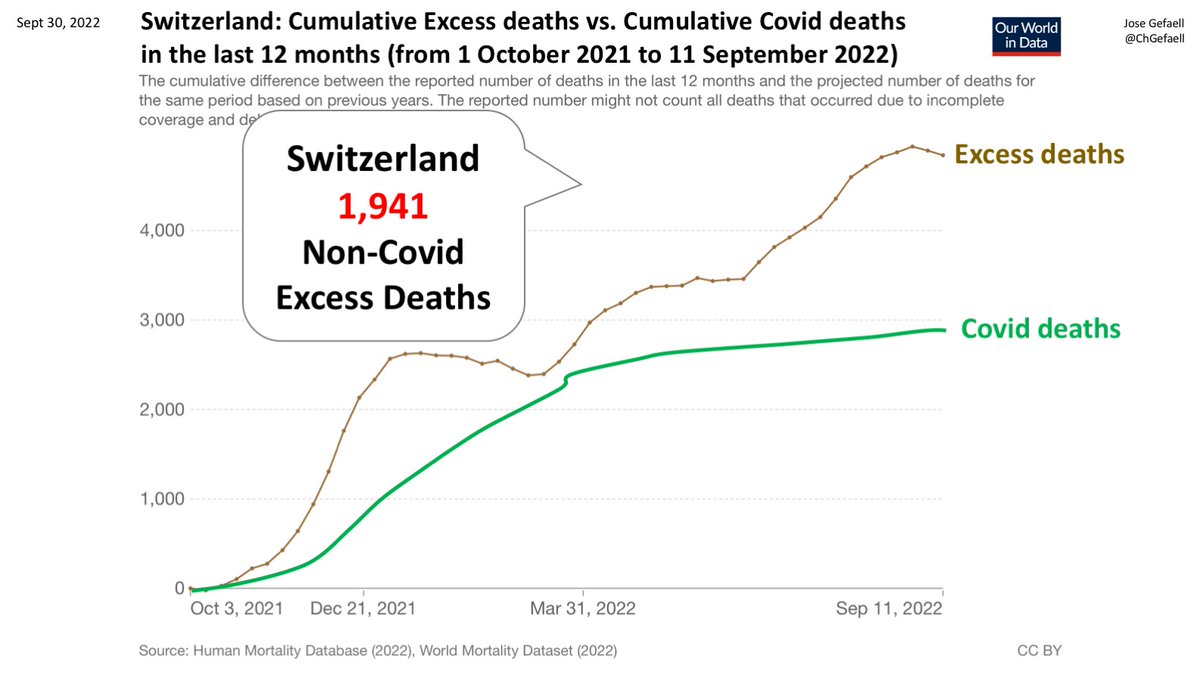
SWITZERLAND
(Cumulative Non Covid Excess deaths since 1 October 2021 up to the date of the latest excess deaths release, as per Our World in Data).
11/
(Cumulative Non Covid Excess deaths since 1 October 2021 up to the date of the latest excess deaths release, as per Our World in Data).
11/
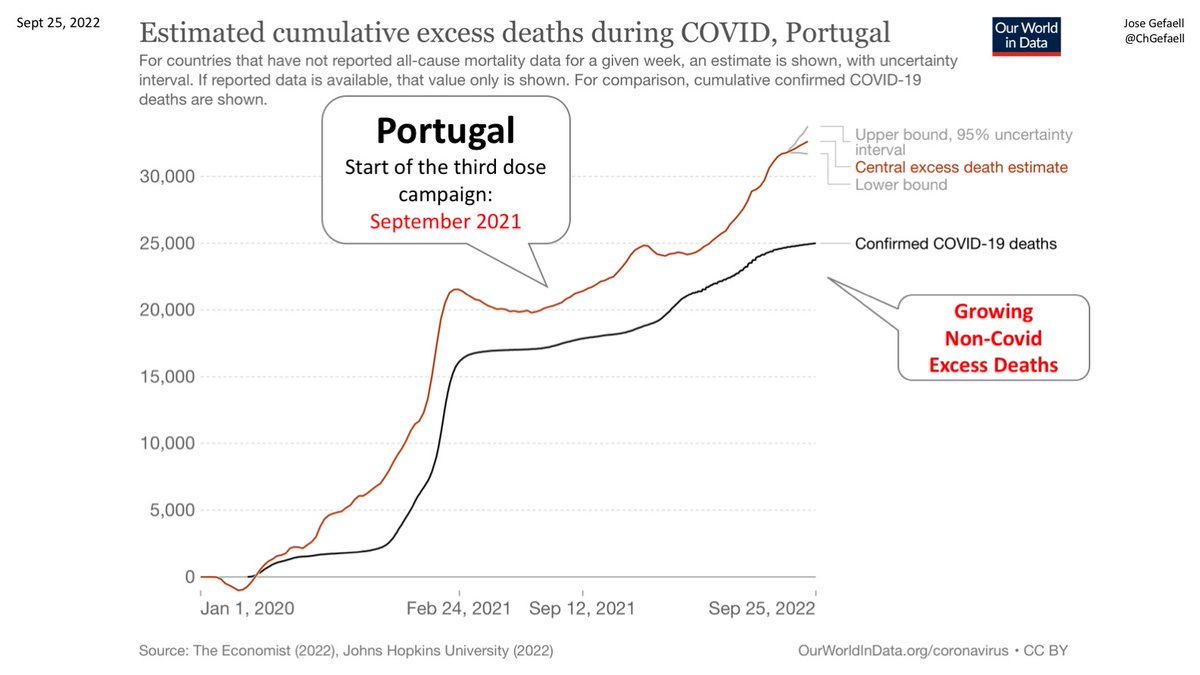
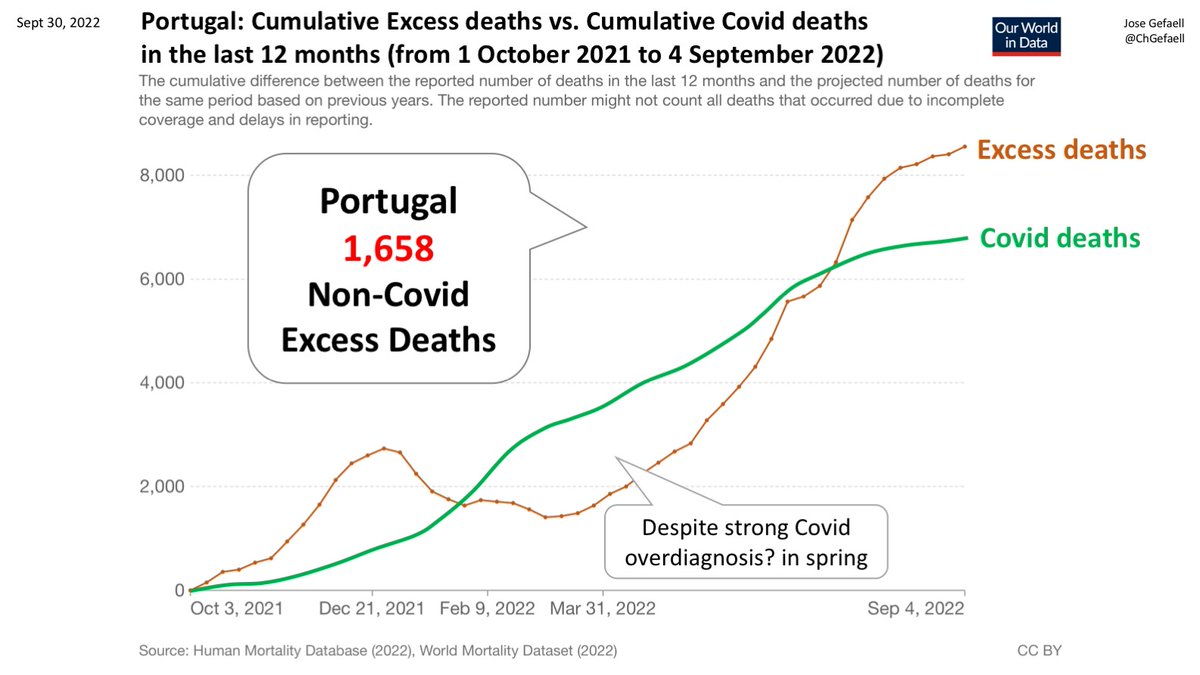
PORTUGAL
(Cumulative Non Covid Excess deaths since 1 October 2021 up to the date of the latest excess deaths release, as per Our World in Data).
12/
(Cumulative Non Covid Excess deaths since 1 October 2021 up to the date of the latest excess deaths release, as per Our World in Data).
12/
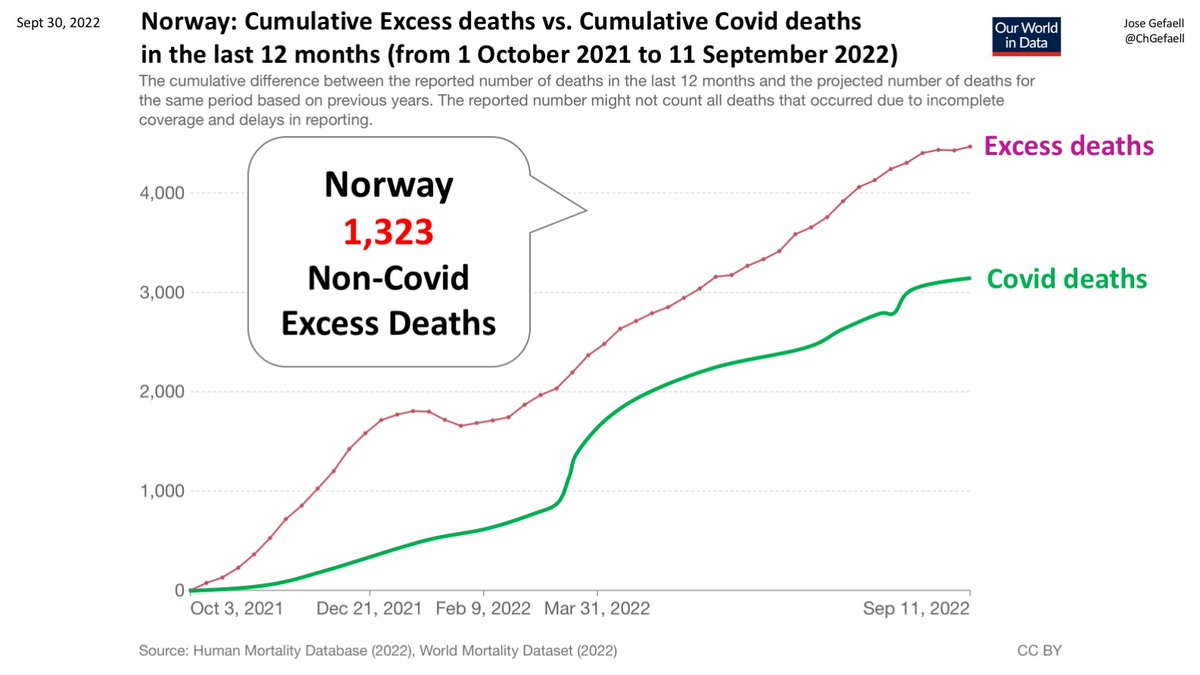
NORWAY
(Cumulative Non Covid Excess deaths since 1 October 2021 up to the date of the latest excess deaths release, as per Our World in Data).
13/
(Cumulative Non Covid Excess deaths since 1 October 2021 up to the date of the latest excess deaths release, as per Our World in Data).
13/
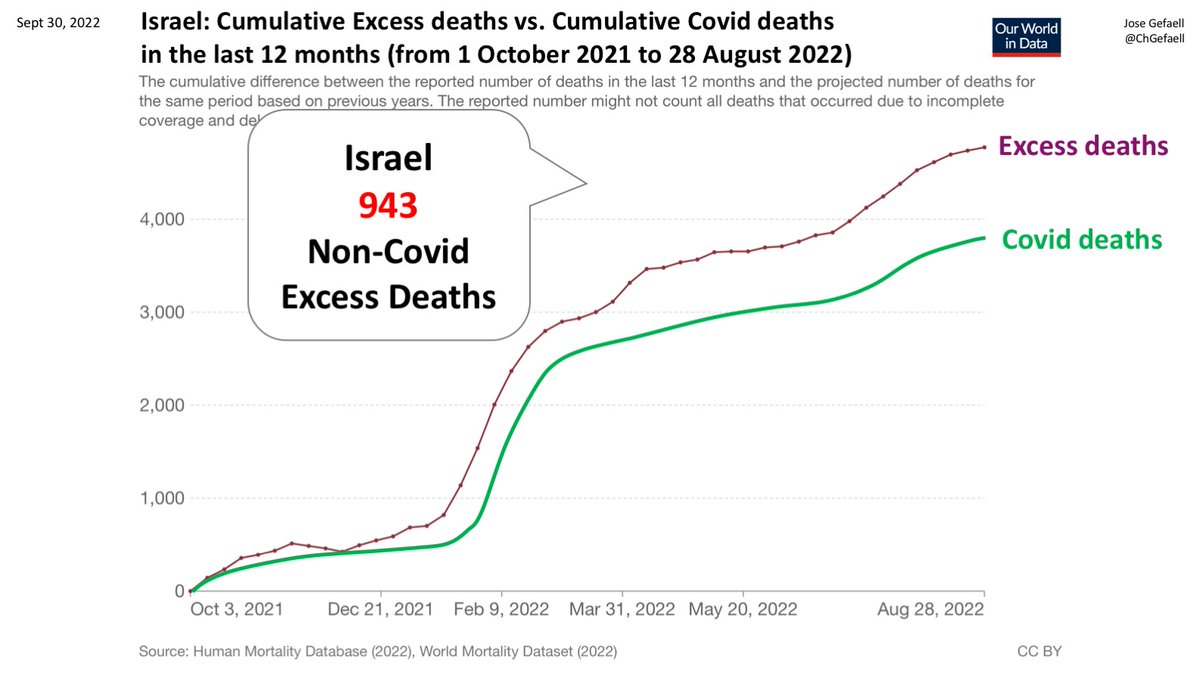
ISRAEL
(Cumulative Non Covid Excess deaths since 1 October 2021 up to the date of the latest excess deaths release, as per Our World in Data).
14/
(Cumulative Non Covid Excess deaths since 1 October 2021 up to the date of the latest excess deaths release, as per Our World in Data).
14/
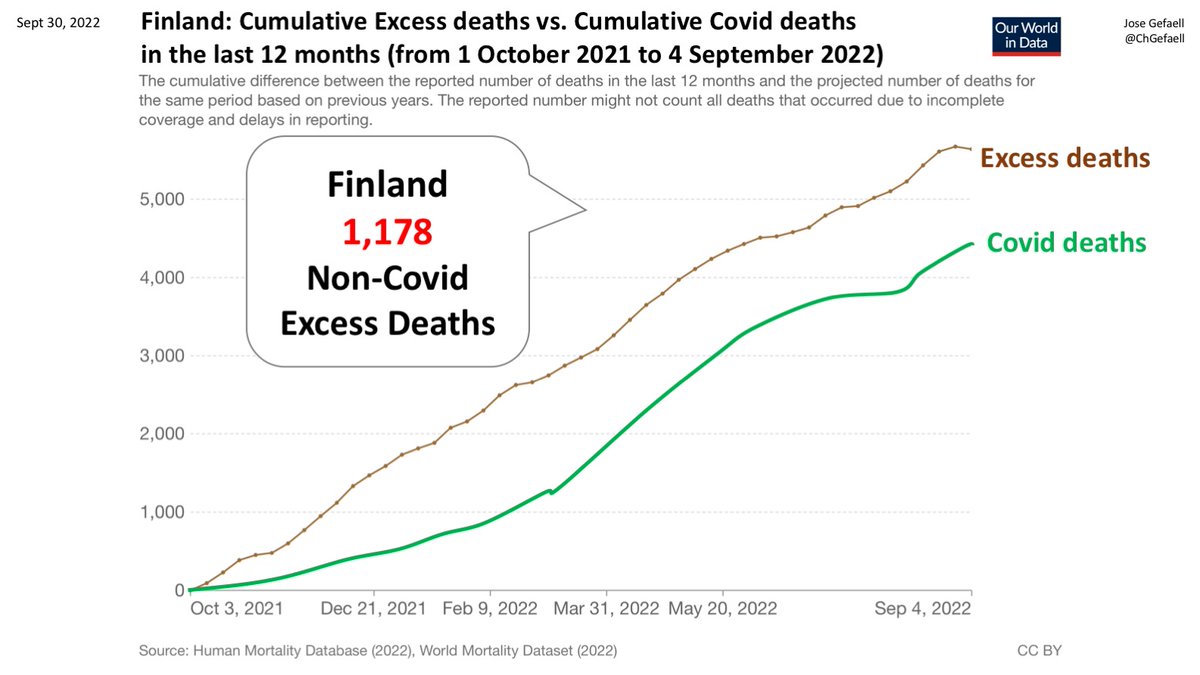
FINLAND
(Cumulative Non Covid Excess deaths since 1 October 2021 up to the date of the latest excess deaths release, as per Our World in Data).
15/
(Cumulative Non Covid Excess deaths since 1 October 2021 up to the date of the latest excess deaths release, as per Our World in Data).
15/
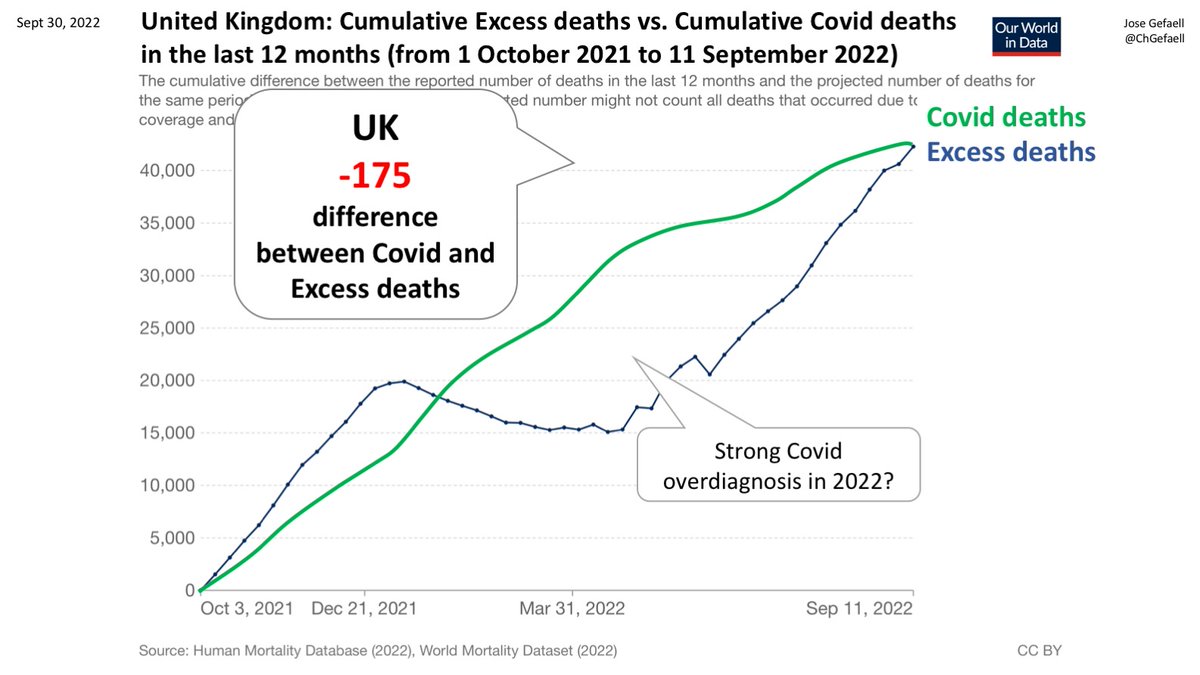
UK
(Cumulative difference between Excess deaths and Covid deaths since 1 October 2021 up to the date of the latest excess deaths release, as per Our World in Data).
16/
(Cumulative difference between Excess deaths and Covid deaths since 1 October 2021 up to the date of the latest excess deaths release, as per Our World in Data).
16/
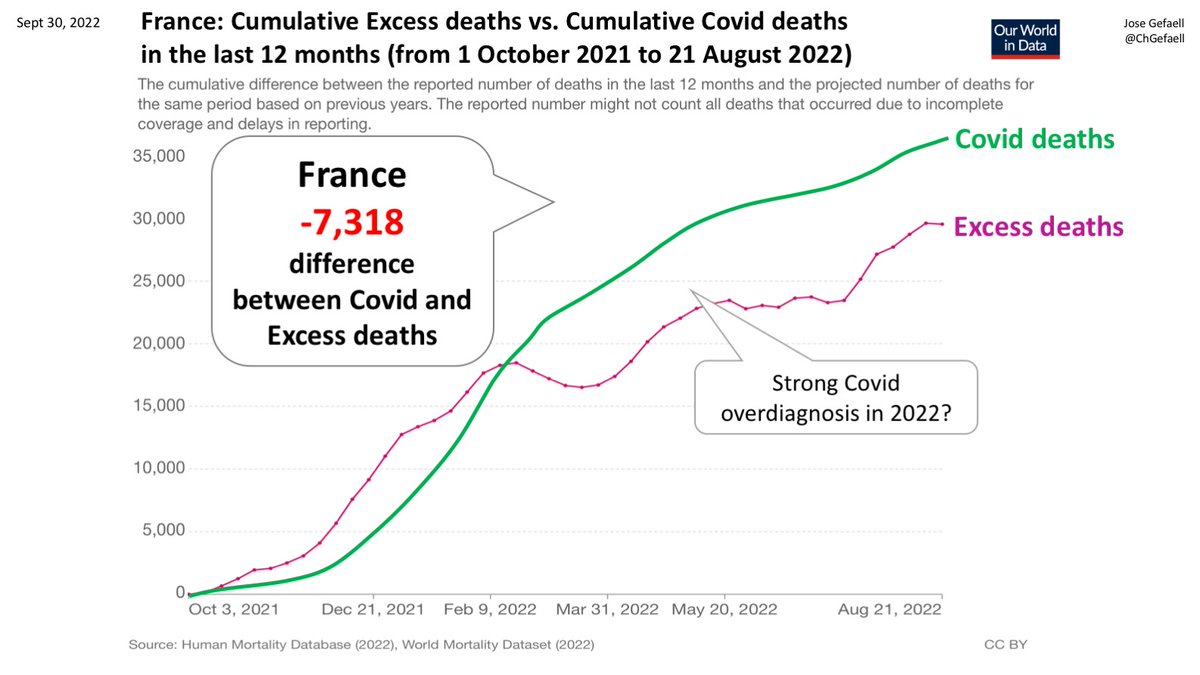
FRANCE
(Cumulative difference between Excess deaths and Covid deaths since 1 October 2021 up to the date of the latest excess deaths release, as per Our World in Data).
17/
(Cumulative difference between Excess deaths and Covid deaths since 1 October 2021 up to the date of the latest excess deaths release, as per Our World in Data).
17/
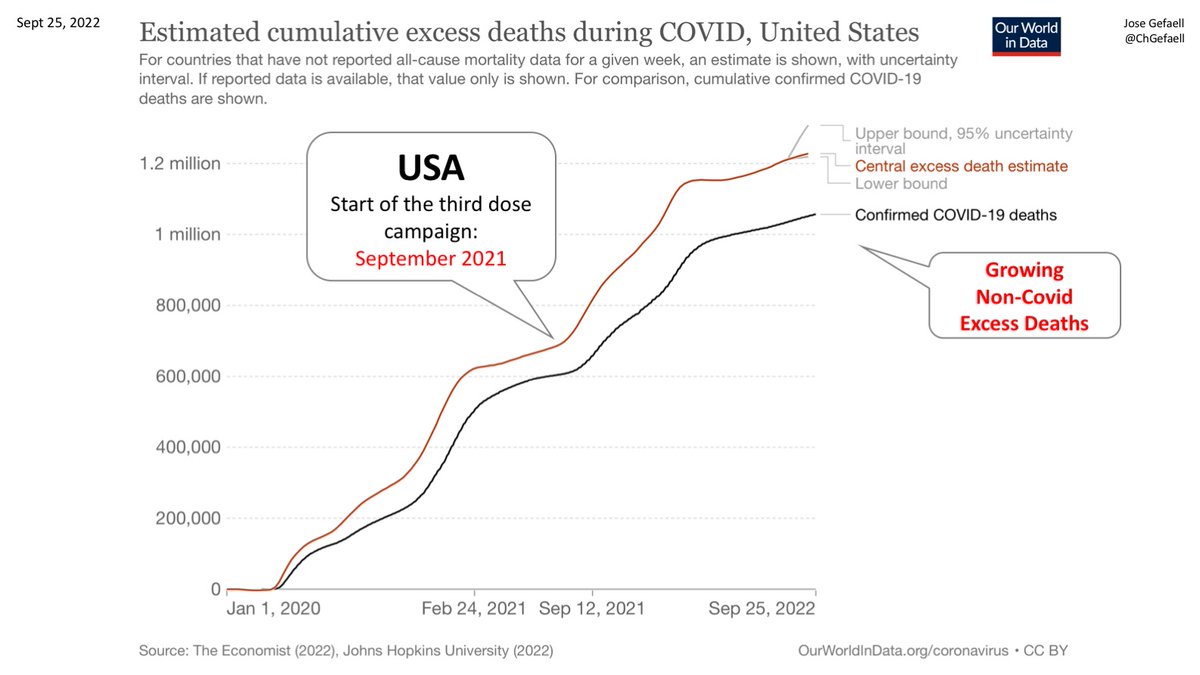
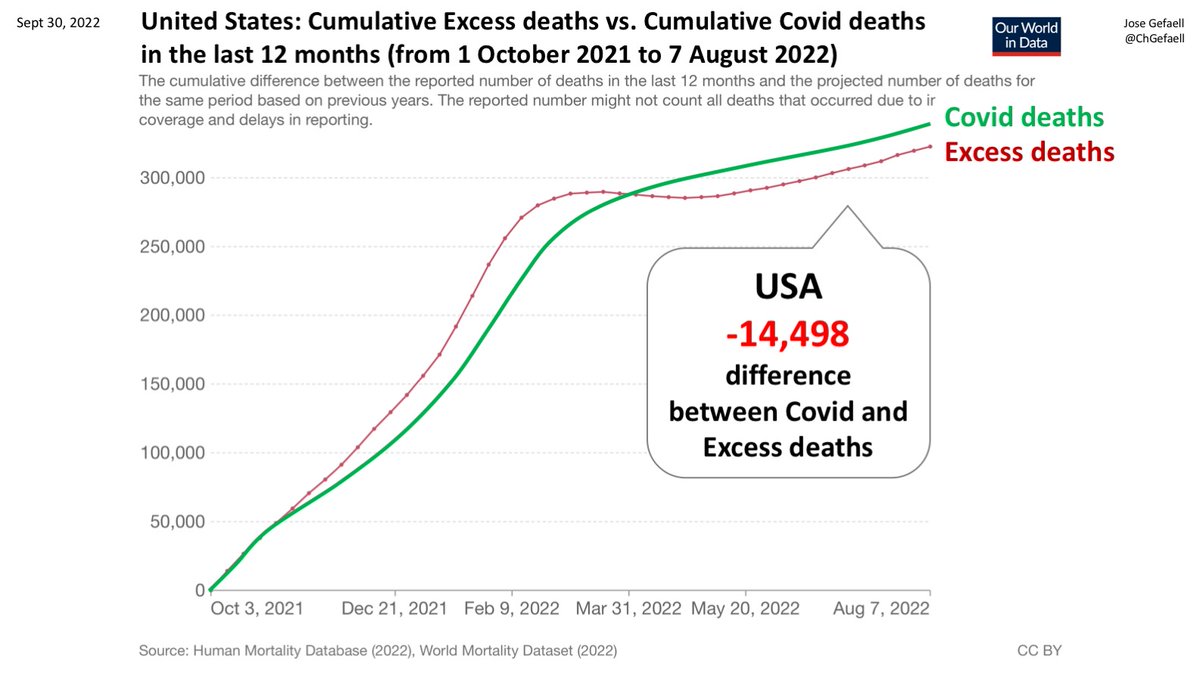
UNITED STATES
(Cumulative difference between Excess deaths and Covid deaths since 1 October 2021 up to the date of the latest excess deaths release, as per Our World in Data).
18/
(Cumulative difference between Excess deaths and Covid deaths since 1 October 2021 up to the date of the latest excess deaths release, as per Our World in Data).
18/
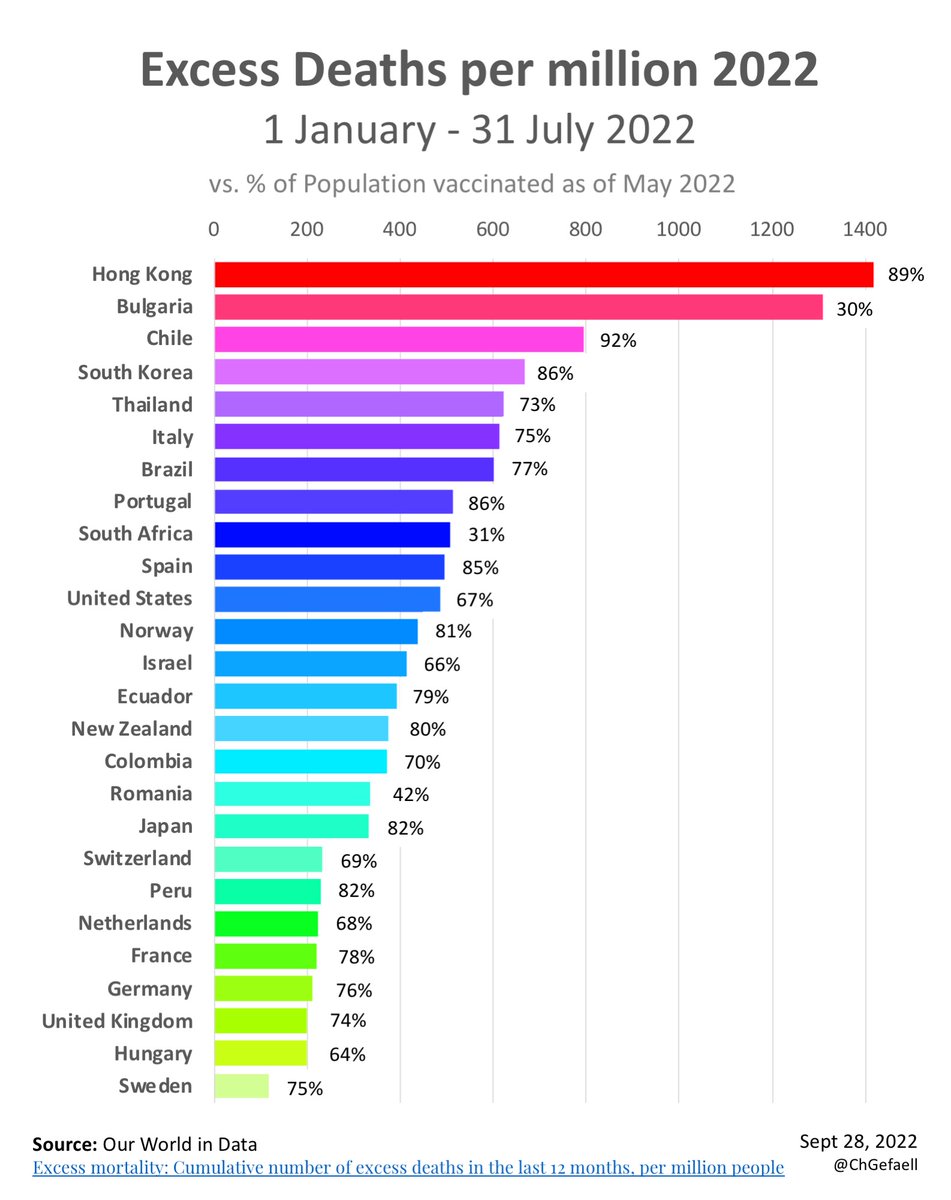
2022 through July Excess deaths vs Cumulated Cases up to January 2022, and % of population Vaccinated


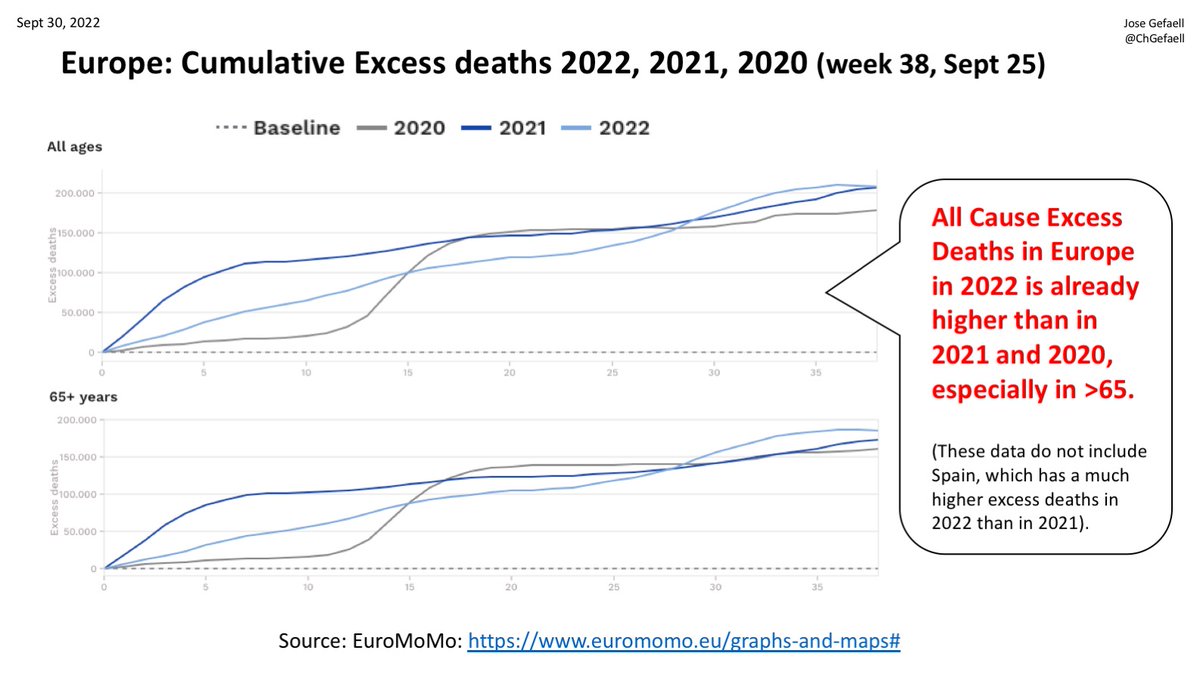
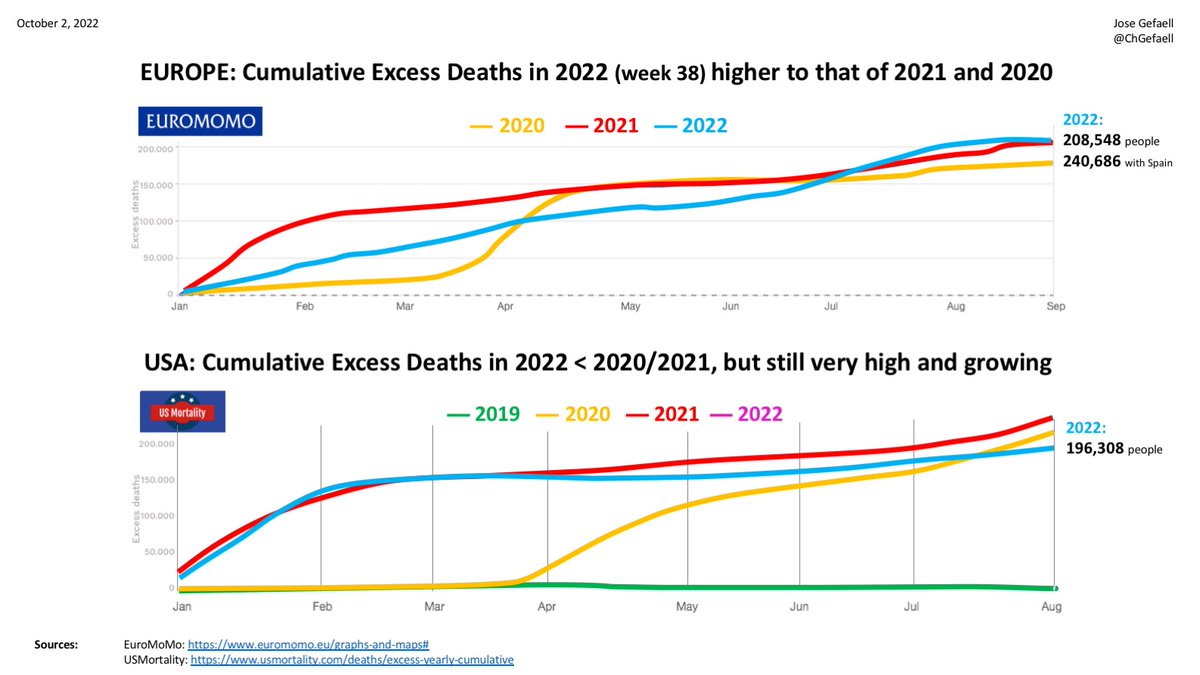
Cumulative All Cause Excess Deaths in Europe in 2022 through week 38 (Sept 25) is already higher than in 2021 and 2020, especially in those >65.
(These charts do not include Spain because this week did not contribute to EuroMoMo. Spain has a much higher excess in 2022 than 2021)
(These charts do not include Spain because this week did not contribute to EuroMoMo. Spain has a much higher excess in 2022 than 2021)
Europe: Non Covid Excess Deaths as per EuroMoMo Total Excess Deaths and Our World in Data Covid Deaths. (Countries: Aust, Belg, Cyp, Den, Est, Finl, France, Germany, Greece, Hung, Isr, Israel, Italy, Luxembourg, Malta, Nether, Norway, Port, Slovenia, Sweden, Switz, UK, Spain).
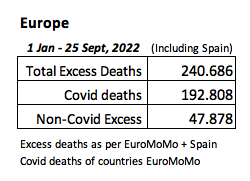
Beyond the calculation of the non-Covid excess, a large number of countries in 2022 still show rising, not flattening, excess deaths curves. In Europe the excess is 240K, more than 2020 and 2021. In USA it is 196K, slightly lower than 2020 and 2021 but still very high and growing
So, where have all the VE gone?
Sources:
12 months Excess Deaths, Our World in Data: ourworldindata.org/explorers/coro…
12 months Covid Deaths: Our World in Data: ourworldindata.org/explorers/coro…
EuroMoMo: euromomo.eu/graphs-and-map…
USMortality: usmortality.com/deaths/excess-…
Sources:
12 months Excess Deaths, Our World in Data: ourworldindata.org/explorers/coro…
12 months Covid Deaths: Our World in Data: ourworldindata.org/explorers/coro…
EuroMoMo: euromomo.eu/graphs-and-map…
USMortality: usmortality.com/deaths/excess-…
• • •
Missing some Tweet in this thread? You can try to
force a refresh