
MARKET JOURNAL
The UK/BOE pension crisis since it broke out two weeks ago gave FED the opportunity to prove its resolve in real time in the face of volatility, and harden the path of hikes. And as evidenced by BOE flip-flopping and the RBA’s dovish surprise, it’s clear that now
is not the time for dovish pivots. BOE doesn’t have enough financial market stress evidence to go all-in on QE, and the AUD continues to fall.
IMO, we’re mid-crash right now. It’s choppy. It’s messy. It’s confusing. But the risk/reward short here is even better than pre-BOE/UK.
IMO, we’re mid-crash right now. It’s choppy. It’s messy. It’s confusing. But the risk/reward short here is even better than pre-BOE/UK.
OIS climbing and TIPS curve high and inverted. In the meantime, equity investors continue to drool over the possibility of a softening in inflation to underpin a "peak hawkishness" trade. 


Meanwhile, market-based inflation expectations are moving in the wrong direction. 1-year TIPS break-even now higher than August 26, Powell's Jackson Hole speech.


Odious price action this morning with defensive sectors strong, VVIX > VIX, and bonds/Tech weak.
Bonds in desperate need of macro weakness. Unfortunately, the 1960s to 1980s say rates stay high and sticky even with weak macro.
Bonds in desperate need of macro weakness. Unfortunately, the 1960s to 1980s say rates stay high and sticky even with weak macro.
Still think @agurevich23 ends up right on deflation next year, but it’s going to take FED really keeping rates high while unemployment rises.
Pre-market: BTC down and NDX lagging SPX despite Gilt/Bund yields down, on top of Utes getting pounded yesterday, smells an awful lot like sticky inflation.
BTC getting crunched. Not what I would want to see if long for a “soft CPI trade”.

CC’ing those who get it:
@BobEUnlimited @JulianMI2 @biancoresearch @gnoble79
@BobEUnlimited @JulianMI2 @biancoresearch @gnoble79
https://twitter.com/LiveSquawk/status/1580536672885780480
There’s always a tell. The crunching continues


@FZucchi TIPS curve high and stinky.

Bulls feeling good this morning about the bounce off 3500 and red VIX/VVIX.
Have fun with that. See you at the close.
LFG
Have fun with that. See you at the close.
LFG
Ugly movement in market-based inflation expectations.
FED can't stop until pivot takes and dip buying stops. It's that simple.
FED can't stop until pivot takes and dip buying stops. It's that simple.


One can be bullish based on this reflationary trading this morning only and only if you believe FED doesn’t have the resolve.
If FED has the resolve, odds are high and rising that the 10-year US Treasury must go to 800+ bps.
CC: @NickTimiraos
If FED has the resolve, odds are high and rising that the 10-year US Treasury must go to 800+ bps.
CC: @NickTimiraos
Just hideous, hideous Cleveland Fed data.

Huge move up in break-evens driving lower TIPS yields. Market is saying Powell doesn't have the guts to ramp it up again.


But not so fast. BTC is barely up, and HY CDX is only down 9 bps. If this was a monster rally launching even a sustained BMR, HY CDX would be down at least -30 bps on a day like today.

In conclusion: This is a monstrously bearish day for the 3-12 month SPX outlook.
The anatomy of a crash. September 18, 2008 SPX hammers off a -28.08% cumulative decline level, rips 11% into the following day then proceeds to crash for good.
CC: @PauloMacro @gnoble79
CC: @PauloMacro @gnoble79

Today SPX hammered off a -27.54% decline level.
Just getting started...
Just getting started...

Good progress today on the 2008 analog.


HY CDX looks coiled.


5y5y inflation expectations really moving in the wrong direction for FED despite real rates moving up alongside a higher terminal rate.
CC: @BobEUnlimited
CC: @BobEUnlimited

Bullard's "bullish" comments did nothing to the June OIS contract.


Between high and sticky nominals, TIPS, and OIS rates and rising inflation expectations, odds are rising the 10-year Treasury needs to move up to 700-800 bps, ala the late 1960s, early 1970s.
CC: @FedGuy12 @gnoble79 @biancoresearch
CC: @FedGuy12 @gnoble79 @biancoresearch

VIX and BTC not confirming the pre-market bond/stock ramp.

Folks really are failing to grasp the concept of the “FED Call” here. Strike price is a very hard 3637, if not lower. Throw out your technicals and fundamentals until the Call expires.
https://twitter.com/carlquintanilla/status/1581959983562133504
Sentiment tracking the 2008 analog closely.


It's heads bears win, tails bulls lose right now. If 10s aren't going higher because the economy is so weak disinflation cometh despite high nominals, bonds bid is not bullish equities with last Thursday's SPX bottom at the highest P/E in recessionary bear market history.
Every single day that a big equity rip drags inflation expectations higher simply adds to the ultimate downside. FED needs to get that much tighter for that much longer to kill inflation.
Keep buying. Have a party. If you are, you're part of the problem.
Keep buying. Have a party. If you are, you're part of the problem.


Bob friggin GETS IT.
https://twitter.com/BobEUnlimited/status/1582148769885220864
Bob’s analysis above + “FED can’t be independent” sentiment below = Powell goes even higher for even longer.
https://twitter.com/TheCarter758/status/1582102899857195008
Critical to follow those who have been right for the right reasons.
https://twitter.com/LHSummers/status/1582019849898799105
Unfortunately, Siegel has be-clowned himself out of usefulness.
https://twitter.com/TheCarter758/status/1582074688716435456
October 18, 2022
Only bullish takes. Nobody believes Powell.
https://twitter.com/carlquintanilla/status/1582328585532018688
11% off the 3490 low is 3874.
https://twitter.com/TheCarter758/status/1580630363532951552
HY CDX versus its 50dma closely tracking the 2008 analog.


Everyone says they're bearish but there hasn't been much selling, net net.


BAML is 100% spot on with regard to the need for policy capitulation.

If SPX 3490 was THE low, it would be the most expensive recessionary bear market low in history at 17x peak earnings, and the first time FED was actively hiking rates. At bare minimum FED needs to be on hold for a durable low to develop.

My short hand game plan is to cover at SPX 3000, buy at SPX 2500, and lever up on an overshoot to SPX 2000.
The more nuanced view is that at SPX 3000 VIX is probably over 50 and the market is swinging wildly by 5-10% a day. So better said: "trade L/S at SPX 3000".
The more nuanced view is that at SPX 3000 VIX is probably over 50 and the market is swinging wildly by 5-10% a day. So better said: "trade L/S at SPX 3000".
Hideous housing data, yet rates remain high and sticky.
https://twitter.com/MichaelKantro/status/1582384976665853952?s=20&t=-iGYDTgVDfkeSAKtyB-1yQ
Taking Powell at his word is the biggest edge one can have in this market. The second edge, IMO, is holding the view that inflation is deep, embedded, and spreading...and therefore the 10-year US Treasury yield must move a LOT higher than market participants expect.
Team Transitory will continue to be a rich source of alpha.
FED’s reaction function is asymmetric until probably sub-SPX 3000. Softening headline doesn’t matter with Median, Trimmed Mean and Sticky CPI showing little sign of softening.
FED’s reaction function is asymmetric until probably sub-SPX 3000. Softening headline doesn’t matter with Median, Trimmed Mean and Sticky CPI showing little sign of softening.
https://twitter.com/carlquintanilla/status/1582395816827703297
And @NickTimiraos with the dunk on Team Transitory.
https://twitter.com/NickTimiraos/status/1582397472407969793
Weird day. VVIX definitely didn’t confirm mid-day weakness. But $XLU outperforming $SPY and $KBWB with $TLT and $ZROZ weak says not all is well. Perhaps OPEX is maintaining a floor.
@neelkashkari goes on an unprompted Volcker tangent in response to the question at 22:45. Paraphrasing:
“Monetary-induced recessions tend to be short.”
“What’s at stake here is the economy we enjoyed for decades post-Volcker.”
“Monetary-induced recessions tend to be short.”
“What’s at stake here is the economy we enjoyed for decades post-Volcker.”
Elsewhere in the Q&A @neelkashkari says that avoiding a hard landing requires help from the supply side.
We know from former FED officials that FED knew in 2021 that the inflation problem was principally demand-driven…
We know from former FED officials that FED knew in 2021 that the inflation problem was principally demand-driven…
…and that in late 2021 they needed a recession to wring it out.
Powell has done a REMARKABLE job of slow-walking markets to the hard landing reality so he can bring rates up to appropriately restrictive levels without causing a market crash.
But now we’re here.
Powell has done a REMARKABLE job of slow-walking markets to the hard landing reality so he can bring rates up to appropriately restrictive levels without causing a market crash.
But now we’re here.
The “we won’t repeat the 1970s stop-and-go mistake” message began in early July with @NickTimiraos and Bill Dudley and was cemented with Powell at Jackson Hole and FEDspeak post-JH.
Now the messaging is shifting to the degree of the downturn.
Now the messaging is shifting to the degree of the downturn.
I believe the message tonight from @neelkashkari was a VERY intentional softening of the hard landing beach.
Median, Trimmed Mean, and Core CPI are all running at 7% annualized over the last 2 months. Say these average 5% over the NTM…
Median, Trimmed Mean, and Core CPI are all running at 7% annualized over the last 2 months. Say these average 5% over the NTM…

…That means FED needs to get the entire UST curve up to at least 600 bps to exert meaningful downward pressure on underlying inflation.

I think Michelle Bowman has outlined the path quite succinctly: 75s are on the table as long as inflation has not inflected downward.
So, 75s are baked for November and December, which brings FFR to 450 by December.
Base case for 2/1/23, 3/22, and 5/3 has to be 50/25/25.
So, 75s are baked for November and December, which brings FFR to 450 by December.
Base case for 2/1/23, 3/22, and 5/3 has to be 50/25/25.
So base case gets to 550 by May 2023.
But the problem with the base case is equity bros will ease financial conditions on such a quick step-down to 25s.
I think 50/50/25 then a final 25 on June 14 is more likely, which brings FFR to 600 by June.
But the problem with the base case is equity bros will ease financial conditions on such a quick step-down to 25s.
I think 50/50/25 then a final 25 on June 14 is more likely, which brings FFR to 600 by June.
This path to a 600 FFR by next June is unlikely to get the UST curve up to the necessary 600 to exert meaningful downward pressure on underlying inflation, but the path there should finally crack the equity market, as @JulianMI2 has been saying is necessary all along.
All of the above is contingent upon $SPY $QQQ sticking around current levels. If FED could get to FFR 450 and SPX 3000, that would be a pretty decent policy spot to sit at and watch how Median, Trimmed Mean and Core CPI evolve over the next 12-18 months.
October 19, 2022
HY CDX with a decent spike up given $SPY and $QQQ haven't moved much pre-market.

TIPS and OIS now back to post-CPI levels. TIPS 10s circa 170 and the June 2023 FFR at 495.


$QQQ and $SOXX relative strength is very ugly, helping to confirm that higher rates cometh.


I'm struggling with Banks vs. Utilities. This relationship is behaving as if the economy can handle higher rates. BUT, this also happened circa the September 19, 2008 pre-crash snap-back equity rally. Huge head fake. I think that's where we're currently at.

BUT, I am also cognizant of the fact this is a very different interest rate and overall banking environment than September 2008. I get that. But from a macro/market cycle perspective, directionally the relationship is useful and I think the 2008 comp likely holds. Still noodling
Inspired by
@PauloMacro
's dive into the 2001 history books this morning, here are a couple of WSJ articles from Lehman week in 2008 (the analog I've been using since CPI day last week).
wsj.com/articles/SB122…
wsj.com/articles/SB122…
@PauloMacro
's dive into the 2001 history books this morning, here are a couple of WSJ articles from Lehman week in 2008 (the analog I've been using since CPI day last week).
wsj.com/articles/SB122…
wsj.com/articles/SB122…
SECOND DAY IN A ROW, Kashkari discusses the fact monetary-induced recessions are short-lived and set the economy up for a boom.
The softening of the hard landing beach continues.
CC those who get it: @JulianMI2 @gnoble79 @biancoresearch @BobEUnlimited
The softening of the hard landing beach continues.
CC those who get it: @JulianMI2 @gnoble79 @biancoresearch @BobEUnlimited
The above comment is at minute 33. Below is the clip from yesterday.
https://twitter.com/TheCarter758/status/1582562654383902720
Circa minute 14 Bullard dismisses the notion SPX down -27% is a sign of tight financial conditions FED should react to. Says wealth to disposable income is still elevated.
bloomberg.com/news/videos/20…
bloomberg.com/news/videos/20…
Softening the hard landing beach.
https://twitter.com/financialjuice/status/1582878887906009089
October 20, 2022
Despite weakening economic data, “peak” inflation, and global CBs concerned about financial stability, the UST curve continues its march higher.
The curve either gets up to at least 600, or equities fall sufficiently to do FED’s work for it.
The curve either gets up to at least 600, or equities fall sufficiently to do FED’s work for it.

Bullard’s interview yesterday was really key:
1. St. Louis Fed Financial Stress Index is still very low
2. Stocks down -27% from frothy levels does not mean financial conditions are tight
3. Wealth to disposable income is still elevated
4. And most critically…
1. St. Louis Fed Financial Stress Index is still very low
2. Stocks down -27% from frothy levels does not mean financial conditions are tight
3. Wealth to disposable income is still elevated
4. And most critically…
…FED needs to get up to a sufficiently tight policy rate before it becomes “data dependent”.
bloomberg.com/news/videos/20…
bloomberg.com/news/videos/20…
St. Louis Fed Financial Stress Index.

This morning the June OIS has FFR at 500.

TIPS 10s coiling at the highs circa 170 bps.

My working thesis on rate hikes is as follows.
November: 75
December: 75
February: 50
March: 50
May: 25
June: 25
Terminal: 600
This should be enough to bring SPX down to the 2500-3000 range, but if not, then it'll go to 700.
November: 75
December: 75
February: 50
March: 50
May: 25
June: 25
Terminal: 600
This should be enough to bring SPX down to the 2500-3000 range, but if not, then it'll go to 700.

The bull on the CNBC set with @ScottWapnerCNBC and @steveliesman demonstrates well just how much alpha is left to be mined from the vein of BTFDers.
cnbc.com/2022/10/20/fed…
cnbc.com/2022/10/20/fed…
FFR 600 by next June, as outlined above, might appear unreasonable. But it’s not when viewed in the context of BTFDers buying the dip on the possibility of “just” two more 75s then done.
FED can do NOTHING that is interpreted as dovish until SPX falls to levels that…
FED can do NOTHING that is interpreted as dovish until SPX falls to levels that…
…allow for an easing of financial conditions that does not reignite inflation.
My long-held thesis was SPX 3000. But the more FED is challenged and the higher rates go, the lower that number falls.
SPX 2500 is the target.
My long-held thesis was SPX 3000. But the more FED is challenged and the higher rates go, the lower that number falls.
SPX 2500 is the target.
October 21, 2022
10-year TIPS breaking out this morning.

But overall funky action in the TIPS with the front-end up, belly down, and long-end up. Break-evens all over the place.


Action in nominal and TIPS yields appears to be catching up to the OIS market. OIS is really pretty stable around the 500 level for next June. It's equities and fixed income that are slow to react, for whatever reason.

OIS stable around 500, yet 10-year TIPS pushing higher even since this morning.


All pre-market analysis from this morning wholly upended by the Pivot Plant.
https://twitter.com/TheCarter758/status/1583479801163436032?s=20&t=EaSDexsjHyEG5Qe9vxz6VA
Inflation expectations going vertical. Exactly what you want to see if you're "Volcker 2.0".


Terrible day for my FED thesis, but a few critical offsets:
1. The final version of the @NickTimiraos column made it very clear FED will not tolerate SPX rallying. So, as painful as today was, it only served to EXPAND the ultimate SPX downside because it’s now clear…
1. The final version of the @NickTimiraos column made it very clear FED will not tolerate SPX rallying. So, as painful as today was, it only served to EXPAND the ultimate SPX downside because it’s now clear…
…FED needs to go that much harder to maintain tight financial conditions.
2. Defensive sectors lagged, but not bad.
3. VIX and VVIX climbed throughout the day.
4. The 10-year TIPS hung in reasonably well.
5. Most critically - and frankly, sad for the American economy -
2. Defensive sectors lagged, but not bad.
3. VIX and VVIX climbed throughout the day.
4. The 10-year TIPS hung in reasonably well.
5. Most critically - and frankly, sad for the American economy -
inflation expectations went VERTICAL. People have no idea how hard FED is going to have to crank to get to Dudley’s “80% confidence” level that inflation has returned to 2%.
@hkuppy is dead friggin right about oil. It’s a rocket about to launch. No bueno.
@hkuppy is dead friggin right about oil. It’s a rocket about to launch. No bueno.
October 24, 2022
Those pesky inflation expectations. Moving higher despite rates up because now the entire market is questioning Powell's resolve, as encapsulated well by the Dudley op-ed this morning.


5y5 expectations straight up the gut.

My pastor this Sunday said they’re raising extra money for the “deacons’ fund” to help those struggling with inflation and high energy bills.
Same afternoon, unprompted, my aunt said inflation is a huge problem for her and my uncle on fixed salaries.
RationalCloseAttention#
Same afternoon, unprompted, my aunt said inflation is a huge problem for her and my uncle on fixed salaries.
RationalCloseAttention#
VIX and VVIX saying SPX wants to continue moving higher. But leadership is defensive.
Banks up, Tech down with rates up.
This all smacks of early January price action before 2s went vertical.
Inflation expectations say 2s need to go vertical…again.
Banks up, Tech down with rates up.
This all smacks of early January price action before 2s went vertical.
Inflation expectations say 2s need to go vertical…again.
October 25, 2022
3877 is 11% up from the CPI day low. HY CDX settling in right around the 50dma.
Analog playing out well.
Analog playing out well.
https://twitter.com/TheCarter758/status/1582897903882108929
HY CDX

The trial balloon rally. What a thing of friggin beauty.
75 in December to 450, then 50/50 Feb/March to 550 is the path if SPX stays up here.
Rip ‘em.
75 in December to 450, then 50/50 Feb/March to 550 is the path if SPX stays up here.
Rip ‘em.
October 26, 2022
Red VIX this morning despite red SPX/NDX says big bounce coming. Awesome. Keep extending the length of the noose rope and the height of the stool. See how that goes.
VIX and HY CDX flat. Definitely a BTFD morning.
Let’s see what Timiraos *cough - Powell* has to say about the easing of financial conditions at noon.
Let’s see what Timiraos *cough - Powell* has to say about the easing of financial conditions at noon.

And there it is. VIX/VVIX and HY CDX always know.
Was Dudley’s column a hint that Powell is about to blink? Maybe we find out at noon.
Was Dudley’s column a hint that Powell is about to blink? Maybe we find out at noon.

On the volatility front, VVIX is not confirming VIX move. Something to watch.
Goldman's Dominic Wilson: "Tightening, but more gradual"
"No asset market is pricing a very high risk of the more severe recession outcome. If a recession is coming, this implies further repricing ahead, particularly if the Fed needs to push rates higher to engineer it. Equities and credit would probably be especially vulnerable.
"Beyond the pressure on earnings and cashflows, if the labor market was to crack more clearly, that could lead to sharper upward pressure on equity volatility and equity multiples and returns and, by implication, a tougher environment for credit.
"Conversely, the longer the labor market remains resilient, the more that may provide some protection against deep downside risks to equities and keep rate shorts and USD longs as the dominant drivers of any tightening in financial conditions."
Scenario analysis.
Moderate hawkish: UST 5s 450, SPX 3370
Severe hawkish: UST 5s 540, SPX 2888
Moderate hawkish: UST 5s 450, SPX 3370
Severe hawkish: UST 5s 540, SPX 2888
"Fed commentary has been quite focused on the level of rates, with several officials anchoring on the 4.50-4.75 level embedded in the Fed dot plot. But this anchoring relies more heavily on confidence in “neutral rates” than we think is justified.
"If we approach these levels without a recession appearing and inflation still well above target, they may prove to be loose anchors, as Minneapolis Fed President Kashkari recently hinted."
Bridgewater data says recession is coming. Goldman says recession isn't priced (SPX 3370). BW says recession isn't enough to bring inflation down. Goldman says "severe hawkish scenario" means SPX 2888.
It all boils down to Powell. Does he have the resolve. It's that simple.
It all boils down to Powell. Does he have the resolve. It's that simple.
Good follow-on thread to close out the day here.
https://twitter.com/BobEUnlimited/status/1585316811205382146?s=20&t=ErwgPWnhhdJWVq9vFUnBKQ
Ok, not done. Post-Lehman price action analog update.
https://twitter.com/TheCarter758/status/1584915548051226626?s=20&t=iwWOKXI65rRRW09JKRS9jQ
11-12% rip right up to just above the 50dma with HY CDX sitting


HY CDX sitting right around the 50dma.


October 27, 2022
Nice to finally have clarity about what’s behind the move since last Friday.
https://twitter.com/TheCarter758/status/1585658061754089474
Meanwhile, $AAPL is sitting on the edge of a cliff begging for a push.

HY CDX is down pretty decently given green VVIX vs. Fed VIX and red indices.
$XLU outperforming, perhaps on rates. $QQQ $XLK weak despite rates.
Bizarre day. No idea where it goes ST. If I had to guess, HY CDX is probably the “tell” that $AAPL beats and $SPY $QQQ rip.
$XLU outperforming, perhaps on rates. $QQQ $XLK weak despite rates.
Bizarre day. No idea where it goes ST. If I had to guess, HY CDX is probably the “tell” that $AAPL beats and $SPY $QQQ rip.
LOL. $AMZN implosion dragging HY CDX back up after hours. $AAPL on deck. Hence why I don't trade ST, just document observations to build a picture of market conditions.
UST curve head sharply lower. Back to post-GFC action to be expected in a weakening macro.
UST curve head sharply lower. Back to post-GFC action to be expected in a weakening macro.
We'll see if labor, compensation and inflation cooperate enough to allow FED to "pivot" in time to engineer a soft landing.
October 28, 2022
Pre-market VIX and HY CDX say this market is going to explode today.
Ok, fine. All the bagholders get their "pivot" wish...for now. Bottom is not in.
Ok, fine. All the bagholders get their "pivot" wish...for now. Bottom is not in.

If the high inflation recessionary bear markets of the 70s and 80s are the appropriate comps, then the SPX bottom doesn't occur until the 3/10 UST curve is at par. Not there yet. 3s are still 8% above 10s today and were 12% above at the October 13 SPX low.


I'm now wondering if Dudley's op-ed wasn't the foreshadowing of Powell going soft, at least in the near-term. We'll see.
Unless @NickTimiraos puts a fork in the rally, which seems unlikely - and barring any exogenous event - the runway is pretty clear until FOMC next week.
Unless @NickTimiraos puts a fork in the rally, which seems unlikely - and barring any exogenous event - the runway is pretty clear until FOMC next week.
VVIX/VIX and HY CDX not showing any contra signs for this $SPY $QQQ rally. But 2s are exhibiting very early signs FED isn't going away to the extent price action would suggest.
Powell's credibility is firmly on the precipice here. He knows how financialized this economy is...
Powell's credibility is firmly on the precipice here. He knows how financialized this economy is...
...and that any sustained rallying will put a fork in his credibility.
Continue to rip 'em, bagholders. Please.
Continue to rip 'em, bagholders. Please.
June OIS starting to hook back up, now 485 up from sub-480.

VVIX starting to show initial signs of rally exhaustion, diverging from VIX as VIX makes new lows for the day.


I really don’t think it’s #3. Why rip up the JH speech if true?
https://twitter.com/TheCarter758/status/1586137239528030209
Defensive sectors hanging in there in a risk-on tape and the 3/10 UST curve inversion strongly suggest it’s a combo of #1 and #2.
BW data says inflation requires more. So, if Powell chooses path #1, then SPX probably rallies until inflation persistence hits it in the face.
BW data says inflation requires more. So, if Powell chooses path #1, then SPX probably rallies until inflation persistence hits it in the face.
October 29, 2022
My Saturday morning musing is the market collapses post-midterms.
It’s all about Powell. He’s a political animal.
He pivoted hawkish once re-nominated last November. He pivoted Volcker once confirmed in May.
Once midterms are over FED should start sucking liquidity back out.
It’s all about Powell. He’s a political animal.
He pivoted hawkish once re-nominated last November. He pivoted Volcker once confirmed in May.
Once midterms are over FED should start sucking liquidity back out.
Powell won’t want to crash markets into Election Day, so he’ll sweet talk markets next week, leaving 75 on the table for December. But then as soon as midterms are over the liquidity vacuum will fire up behind the scenes.
I’ll leave it to the great @maxjanderson to track this.
I’ll leave it to the great @maxjanderson to track this.
October 31, 2022
Wilson saying FED tightening close to ending. No it’s not, Mike. Curve is up on @NickTimiraos this weekend. 2s coiled at the highs.


As of this morning VIX has erased its Friday loss. Friday afternoon VVIX told us this could happen.
But ITRAXX CDX is very tame - HY CDX likely will be as well.
Going to take at least a few days of chop to burn off this momentum. Love the Election Day game plan…
But ITRAXX CDX is very tame - HY CDX likely will be as well.
Going to take at least a few days of chop to burn off this momentum. Love the Election Day game plan…


June OIS up to 493.

Big, fat negative divergence with TIPS 10s versus the June to August BMR.

VVIX not confirming the move down this morning at all. Flagged exhaustion on Friday, but clearly was temporary.
Brainard and Yellen working their magic.
Brainard and Yellen working their magic.
HY CDX is not happy today as June OIS moves FFR up to 494.


Ugly SOX and NDX relative price action, combined with resilient defensive sectors and 3/10 UST curve moving up to 110% emphatically says this latest fake news "FED Pivot" BMR is running on fumes.


Pretty ugly day in HY CDX land given benign equity moves. Change in character from last few-ish trading days.

November 1, 2022
Combination of China reopening and Timiraos/Powell all but confirming 50s starting in December is driving pre-market action.
Bob Elliott is on point here.
Bob Elliott is on point here.
https://twitter.com/BobEUnlimited/status/1587420830312632321?s=20&t=KBvlYTdPAceLZbAIk5gvig
Warren Pies is all over the oil market. No bueno for inflation if more oil demand enters the market.
https://twitter.com/WarrenPies/status/1587425414892380161?s=20&t=KBvlYTdPAceLZbAIk5gvig
Once we are past Election Day, the message of getting to at least 600 by June and the need for a recession to kill inflation will dominate the market conversation around FED.
https://twitter.com/NickTimiraos/status/1587424734463008771?s=20&t=KBvlYTdPAceLZbAIk5gvig
Using Bullard's own formula, FFR needs to get to 700 to put meaningful downward pressure on underlying inflation. Question is not a matter of if (unless the economy falls off a cliff ASAP), but how fast FED gets there.
https://twitter.com/TheCarter758/status/1584552597477765120?s=20&t=KBvlYTdPAceLZbAIk5gvig
Big move down this morning in HY CDX, erasing yesterday's move. China reopening had this impact back in the summer, so I'm not surprised. Now that I know what's driving the move in CDX I can better frame what's going on broadly.

Material move down in TIPS, despite OIS June FFR contract only down to 488 versus 494-ish yesterday.


Lots of moving parts this morning, and we'll have to see how the day unfolds. But in the pre-market BTC and VIX are not confirming the risk-on equity tape. And frankly, $QQQ barely up more than $SPY says this big move down in rates is a fake-out move lower.

Savage reversal in rates on JOLTS. $SPY $QQQ should be down -10% right now.
Brainard and Yellen are working overtime to keep things afloat for Election Day. And it appears to be working at the margin, with GOP Senate odds coming in as markets rally.
Brainard and Yellen are working overtime to keep things afloat for Election Day. And it appears to be working at the margin, with GOP Senate odds coming in as markets rally.

HY CDX, VOL, and BTC pretty much in chill mode.
Waiting for the sweet release of Election Day.
Waiting for the sweet release of Election Day.


June OIS FFR back to 500.
LFG
LFG

Breadth pretty solid day. Ideal set-up would be a huge rip into JPOW.

November 2, 2022
Not looking like a big rip JPOW day.
Brainard and Yellen limit downside into Election Day, so probably a good idea to cover shorts into a “non-Pivot” presser spike lower.
Brainard and Yellen limit downside into Election Day, so probably a good idea to cover shorts into a “non-Pivot” presser spike lower.


It is almost impossible to be “too short” at these levels right now. If one is not max short one is being super short term tactical (🙋🏻♂️).
https://twitter.com/NickTimiraos/status/1587783399871320067
Interesting to compare HY CDX to TIPS 10s today versus just prior to the July FOMC. Bulls obviously want a repeat of the July 27 to August 16 experience, but I think this looks much more like the set-up into the "shock" CPI report that led to 75s at the June FOMC.

Haha

November 3, 2022
Big move up in TIPS 10s. But VOL and BTC not confirming the little bit of pre-market equity red.


Very short term tactical thesis is we don’t get much downside before Election Day, as indicated by benign movement in VIX and VVIX on yesterday’s whoosh. Perhaps a spike lower on NFP, then a weak rally into Election Day driven by RRP/TGA liquidity bump.
Today will be fascinating. Savage move up in the TIPS curve, and CDXs are moving up as well. But VIX is barely green pre-market. Not quite as clear of a "tell" as it was pre-market on October 13 CPI day, but it could be telling us very NT downside is limited.


November 6, 2022
@verrone_chris likes to say, "keep what's most important the most important."
YTD market movements and the NTM market outlook hinge on one thing and one thing only: does Powell have the resolve to bring CPI inflation back to 2.5%?
YTD market movements and the NTM market outlook hinge on one thing and one thing only: does Powell have the resolve to bring CPI inflation back to 2.5%?
The TIPS curve depends on the market's view of forward inflation, so it needs to be taken with a grain of salt. But the YTD delta is telling: from negative and steep, to materially positive and inverted.
I'd say Powell's resolve has gotten out of the blocks pretty well...
I'd say Powell's resolve has gotten out of the blocks pretty well...

...especially considering his #2 is doing everything in her power to limit market and economic damage in a midterm election year that promises a "shellacking" for her party.
Now the question is where to from here? Is Powell going to claim victory if Fed Funds rises above YoY...
Now the question is where to from here? Is Powell going to claim victory if Fed Funds rises above YoY...
...CPI in early 2023 as the great @VincentDeluard suggested this weekend with @kevinmuir...despite underlying inflation running well above the 2.5% CPI target, as Vincent's and Bridgewater's analyses strongly suggest?
Obviously time will tell, but in my opinion, Powell's...
Obviously time will tell, but in my opinion, Powell's...
...legacy is on the line. I do not believe that he will allow himself to become the guy who oversaw the destruction of 3 decades of price stability. I think it is that simple.
Neil Dutta of @RenMacLLC suggested on Friday that FED going 50 in December is a lock. I strongly disagree. And that's not a dunk on Dutta who has done a really good job of getting himself back in line with FED policy after lagging a bit earlier in the year.
OIS has December...
OIS has December...
...at 60 bps. If 50 was a lock it wouldn't be that high.
The Cleveland Fed nowcast has Core PCE and Core CPI running over 40 and 50 bps MoM in October and November. And as Dutta pointed out, oil is starting to rock, which impacts inflation expectations, something FED will...
The Cleveland Fed nowcast has Core PCE and Core CPI running over 40 and 50 bps MoM in October and November. And as Dutta pointed out, oil is starting to rock, which impacts inflation expectations, something FED will...


...likely want to take out an insurance policy on.
Unless SPX moves to new YTD lows between now and the December meeting, FED is going 75 in December.
Unless SPX moves to new YTD lows between now and the December meeting, FED is going 75 in December.
Here's where rate hike expectations were as of September 13.
November: 65
December: 37
And 423 by June 2023.
November: 65
December: 37
And 423 by June 2023.


As discussed above, OIS now has the December meeting at 60 bps and June 2023 Fed Funds at 511.

Unless financial markets cooperate and tighten financial conditions much further than current levels, FED must keep hiking more than market participants currently expect.

To close where we began: as @verrone_chris says, "keep what's most important most important."
In the absence of lower stock prices, the current level of inflation demands a Fed Funds rate of circa 700 to put "meaningful downward pressure" on inflation.
In the absence of lower stock prices, the current level of inflation demands a Fed Funds rate of circa 700 to put "meaningful downward pressure" on inflation.
https://twitter.com/TheCarter758/status/1584552597477765120?s=20&t=ovjHowe8iPJWwEtVgHG2Wg
Sentiment not supportive just as we head into the very misunderstood seasonally unfriendly period for $SPY $QQQ.


Just getting going.
https://twitter.com/Callum_Thomas/status/1588993919844749312
This is why FFR 700 is necessary.
https://twitter.com/BobEUnlimited/status/1589395686524452864
November 7, 2022
Stocks green, BTC red, VIX big green, and USTs bear flattening. LFG


Keynote of the week: Waller 6.5 hours before CPI.

The anatomy of a desperate bull.

No, no it’s not.

Talk to me about FFR 700, Mr. Dudley. Talk to me.
https://twitter.com/economics/status/1589583198266314755
Just getting going. The bloodletting begins post-Election Day.

3/10 UST curve is key for identifying the zone for an SPX bottom. Once it reaches parity, start looking for the zone, as FED policy is about to become less of a headwind.
https://twitter.com/TheCarter758/status/1586738975095635969?s=20&t=vio_gkDRRdP0if1WL5jwOQ
Today the 3/10 curve is 111% and creeping higher.
Dudley's quote is key: "We're at the very beginning..."
Dudley's quote is key: "We're at the very beginning..."

Goldman is below consensus on October Core CPI at 44 MoM versus 50.
They go on to say Core CPI will be 30-40 over the next couple of months before falling to 20-30 next year and 3.3% YoY in December 2023.
Seems like an odd forecast in the context of where the Cleveland Fed…
They go on to say Core CPI will be 30-40 over the next couple of months before falling to 20-30 next year and 3.3% YoY in December 2023.
Seems like an odd forecast in the context of where the Cleveland Fed…
…is at right now:
54 Core and 76 headline.
Goldman has headline at 49!!
When will Team Transitory go away?
54 Core and 76 headline.
Goldman has headline at 49!!
When will Team Transitory go away?

If inflation was going to start missing consensus, rates would not be this high and sticky. OIS June FFR would not be 515.
Market Journal: November 8, 2022
Election Day. The day Brainard and Yellen stop supporting markets.
Election Day. The day Brainard and Yellen stop supporting markets.
Strange pre-market open.

ICYMI, Druckenmiller discussed Yellen's prodigiously corrupt use of the TGA in his Delivering Alpha interview.
cnbc.com/2022/09/28/cnb…
cnbc.com/2022/09/28/cnb…

The market already doesn’t appreciate the persistence of inflation and FED’s reaction function. It has no clue just how asymmetric the reaction function is because of this:
https://twitter.com/SeanBrodrick/status/1589996380067536896
Market Journal: November 9, 2022
If the GA senate race goes into run-off, that could delay the pulling of the Net Liquidity plug. Watching for a change in the early 2023 TGA target.
If the GA senate race goes into run-off, that could delay the pulling of the Net Liquidity plug. Watching for a change in the early 2023 TGA target.
I find it curious that BTC is breaking out of its range to the downside right here, right now.
In June it broke out to the downside coincident with the June 10 May CPI report.
Perhaps this breakout is a leading indicator of another uncomfortably hot report tomorrow?
In June it broke out to the downside coincident with the June 10 May CPI report.
Perhaps this breakout is a leading indicator of another uncomfortably hot report tomorrow?

I think Inflation Denialism is a really key concept going forward. Once the market wakes up to how entrenched inflation is, that’s probably the moment the downside finally opens up.
https://twitter.com/TheCarter758/status/1590265894063996930
Couple quotes from Bob’s video are really key.
Minute 9: “The vast majority of investors are totally unprepared for the type of inflationary cycle that we’re currently facing.
Minute 26: “Markets don’t get it.”
Minute 9: “The vast majority of investors are totally unprepared for the type of inflationary cycle that we’re currently facing.
Minute 26: “Markets don’t get it.”
And yet another key thread on the nitty gritty underlying data that suggests what Dudley said this week: “We are at the very beginning.”
https://twitter.com/BobEUnlimited/status/1589967694908264449
It is no accident FFR 600 is getting increasing amounts of airtime.
https://twitter.com/LiveSquawk/status/1590291333364609024
From the WSJ, CPI swaps have 1-year inflation below 3.5%, versus…

…5.4% consumer expectations, and…

…5.5% Core CPI from Bridgewater.

For the October CPI alone consensus is below the Cleveland FED nowcast.
Headline MoM: 60 vs. 76
Core MoM: 50 vs. 54
Incredible.
Headline MoM: 60 vs. 76
Core MoM: 50 vs. 54
Incredible.

David Kelly, JPM:
"The one thing that's coming out of this election is there will be no fiscal stimulus before 2025, so at some stage, this economy weakens or falls into recession. The only game in town will be the Federal Reserve cutting interest rates to stimulate the...
"The one thing that's coming out of this election is there will be no fiscal stimulus before 2025, so at some stage, this economy weakens or falls into recession. The only game in town will be the Federal Reserve cutting interest rates to stimulate the...
...economy. Gridlock means a more dovish Fed down the road."
"This is a time to be overweight equities for a long-term investor. I think bonds are back."
Wow.
"This is a time to be overweight equities for a long-term investor. I think bonds are back."
Wow.
Perhaps Healthcare inflation is about to start dragging Core CPI below expectations, leading to an incrementally dovish FED. No idea.
What I do know is that Goldman's "bold" below consensus call reads almost verbatim like its September preview.
What I do know is that Goldman's "bold" below consensus call reads almost verbatim like its September preview.


Here's how the September report actually turned out, and what Cleveland projects for tomorrow.


And so it begins.
https://twitter.com/financialjuice/status/1590374250267152385?s=20&t=SIOe0L89K844pJ2hSexwqQ
Look for recession and inflation expectations to take center stage of FED communication.
https://twitter.com/financialjuice/status/1590374532531081217?s=20&t=SIOe0L89K844pJ2hSexwqQ
Williams gave a very detailed speech on the critical components of inflation expectations this morning. Money quote:
"...the beneficial effects of anchored expectations on macroeconomic performance only occur when the inflation response to a shock is not expected to extend...
"...the beneficial effects of anchored expectations on macroeconomic performance only occur when the inflation response to a shock is not expected to extend...
...over many years. As Keynes admonishes us, in the long run we are all dead, and the notion of long-run expectations cannot be too long."
newyorkfed.org/newsevents/spe…
newyorkfed.org/newsevents/spe…
Market Journal: November 12, 2022.
Dead friggin wrong on pre-CPI analysis.
Time to get out of the tactical trees and zoom out on the strategic forest.
Dead friggin wrong on pre-CPI analysis.
Time to get out of the tactical trees and zoom out on the strategic forest.
BCA’s @BerezinPeter summed up this post-CPI market reaction well.
https://twitter.com/PeterBerezinBCA/status/1590732583545212928
I don’t believe in Goldilocks in a world of insane macro volatility.
Team Transitory Bulls can’t have it both ways. If inflation is falling as rapidly as they suggest, then growth is coming down FAST and SPX EPS will print materially south of $200 in 2023.
If bullish…
Team Transitory Bulls can’t have it both ways. If inflation is falling as rapidly as they suggest, then growth is coming down FAST and SPX EPS will print materially south of $200 in 2023.
If bullish…
…one wants to see FED perpetually behind the curve of very high nominal growth that keeps EPS elevated and real rates negative.
If inflation is going right back to 3% by the middle of next year, FED is very tight and likely to remain tight. Hugely bearish.
In fact, that’s…
If inflation is going right back to 3% by the middle of next year, FED is very tight and likely to remain tight. Hugely bearish.
In fact, that’s…
…probably a better bear case than inflation staying high and sticky and Powell trying to drive SPX lower.
Market Journal: November 13, 2022.
Hold at a terminal rate of at least 500 for a year.
Bridgewater has Core CPI at 5.5% over the NTM.
The terminal rate chase higher continues.
Bridgewater has Core CPI at 5.5% over the NTM.
The terminal rate chase higher continues.

Market Journal: November 21, 2022
FED still hasn’t done enough. Frankly, not even remotely enough.
FED still hasn’t done enough. Frankly, not even remotely enough.
Credit issuance picking up alongside the market rally. Yep, exactly how you kill inflation.
CC: @NickTimiraos
CC: @NickTimiraos

Cramer illustrating well how the market still doesn’t get it.
POWELL IS NOT GOING FOR A SOFT LANDING. THAT IS NOT HOW INFLATION GETS KILLED.
CC: @NickTimiraos @DiMartinoBooth
POWELL IS NOT GOING FOR A SOFT LANDING. THAT IS NOT HOW INFLATION GETS KILLED.
CC: @NickTimiraos @DiMartinoBooth

On November 15 Bill Dudley penned an op-ed for Bloomberg that received very little market-wide attention, which is to be expected since it doesn't fit the "soft landing" narrative currently driving markets.
FED must push the unemployment rate higher. Dudley outlined this fact in his July op-ed "what will it take for the Fed to tame inflation" and has been laser-focused on it ever since.

Dudley has been speaking on behalf of and, most importantly, ahead of Powell all year long. Why? Because Powell is politically constrained from publicly acknowledging the fact FED needs a hard landing to kill inflation once and for all.

It would be an historical anomaly for the unemployment rate to just neatly rise by 50-200 bps and stop. Once it goes, it goes.

And the money passage. Inflation is deep, it's broad, it's entrenched, and it's made its way into wages.
None of this is a surprise for those who follow Bridewater. But obviously if the broad market "got it" then it wouldn't need to be repeated ad naseum.
None of this is a surprise for those who follow Bridewater. But obviously if the broad market "got it" then it wouldn't need to be repeated ad naseum.

My “cover at SPX 3000, buy at 2500, lever up at 2000” framework might be too bullish.
https://twitter.com/xtrends/status/1594814786948268035
Market Journal: November 22, 2022
The liquidity generals are bleeding out despite Janet Yellen’s TGA QE program going full blast.
The liquidity generals are bleeding out despite Janet Yellen’s TGA QE program going full blast.

$COIN and “most shorted” diverging massively from this TGA liquidity rip.


Projected TGA balance at 12/31/22 and 3/31/23: $700B and $500B.
TGA is currently circa $500, so for the next 4 months, net-net it’s neutral to risk assets.
home.treasury.gov/news/press-rel…
TGA is currently circa $500, so for the next 4 months, net-net it’s neutral to risk assets.
home.treasury.gov/news/press-rel…
The liquidity wildcard is RRP. The current rate of 380 is now below the 1-month T-Bill rate of 387, incentive for money markets to yank $$$ from the RRP.
Essentially a stealth Bills-funded-Treasury buyback program, right @FedGuy12?
Essentially a stealth Bills-funded-Treasury buyback program, right @FedGuy12?


This survey was a great tell ahead of the move to new lows in September/October.
Once market participants finally “get it”, the real downside whoosh can occur.
Marko finally turning bearish doesn’t hurt. The sheep need a shepherd.
Once market participants finally “get it”, the real downside whoosh can occur.
Marko finally turning bearish doesn’t hurt. The sheep need a shepherd.

No panic. Can't wait for the 5-10% daily swings.

Ready to rip.


Market Journal: November 24, 2022
Countdown to November 30.
Countdown to November 30.


Market Journal: November 27, 2022
3 days.
3 days.
This is also illustrated by sticky VVIX since the November CPI day.
https://twitter.com/SuburbanDrone/status/1596625407737856000
Market Journal: November 28, 2022
2 days.
2 days.
Money passage.
“We had one good October CPI report. I would need to see several more of those and more moderation and perhaps even a reduction in core services prices. And we also have to see better balance in the labour market.”
“We had one good October CPI report. I would need to see several more of those and more moderation and perhaps even a reduction in core services prices. And we also have to see better balance in the labour market.”

Team Transitory and Team Pivot will inappropriately read this as dovish. It’s not.
By that time FED will be operating “normal monetary policy” (in the words of Bullard).
Historically, the 10-year averages 2% real over YoY CPI. If CPI settles at 3%, 10s will be 5%.
By that time FED will be operating “normal monetary policy” (in the words of Bullard).
Historically, the 10-year averages 2% real over YoY CPI. If CPI settles at 3%, 10s will be 5%.


Money quote:
“The data show that those who can least afford the rise in costs for food, housing, and transportation suffer the most.3 The priority for monetary policy is clear. The Federal Reserve is strongly committed to bringing inflation back down to its 2% longer-run goal.”
“The data show that those who can least afford the rise in costs for food, housing, and transportation suffer the most.3 The priority for monetary policy is clear. The Federal Reserve is strongly committed to bringing inflation back down to its 2% longer-run goal.”

Not dovish.

Literally forecasting a hard landing.

OIS June FFR steady at around 500, but HY CDX not happy.


Williams confirmed this EXACTLY in the Q&A follow-up to his speech.
https://twitter.com/TheCarter758/status/1597258101417443328
No cuts in 2023 and projected to maintain positive real rates once the normalization process begins in 2024.


What a day.
And it continues.
https://twitter.com/NickTimiraos/status/1597320420755378177
Jackson Hole 2.0.
https://twitter.com/NickTimiraos/status/1597333561996382208
Market Journal: November 30, 2022
August 26 redux.
The day Powell shifts the market’s primary focus from inflation to labor.
August 26 redux.
The day Powell shifts the market’s primary focus from inflation to labor.
The Street still doesn’t get it. JPM thinks there’s nothing really new for Powell to say, and it appears Goldman thinks the improvement in data could soften Powell signaling hikes well into 2023 (?).


A dovish member of the “troika” just two days ago gave a speech that literally projected a hard landing.
Incredible.
Incredible.
Got the focus on labor with an additional goodie of needing to see substantially more progress on inflation, but was offset by dovish cooing about a soft or soft-ish landing.
https://twitter.com/TheCarter758/status/1598022324208668672?s=20&t=sWa0Z9mER9phr4eVBMt0Gw
🎅
Market Journal: December 2, 2022.
The anatomy of a mistake.
The anatomy of a mistake.
Timiraos has kept building this article throughout the day. SPX stabilized this morning on the initial version saying 50 in December is confirmed, but he has since added commentary about the Fed getting to at least 500 bps in 1H23, and the…
wsj.com/articles/jobs-…
wsj.com/articles/jobs-…
… “potential” need for a recession to bring wage growth back to target.


My mistake of covering shorts on November 30 was not in misreading Powell’s dovishness - that was confirmed by the plunge in TIPS 10s - but I’m not having the patience to wait it out. There are a number of key breadth thrust signals in place that were in the back of my mind…
…when I read the market action post-Powell, and in the event of a major year end rally I didn’t want to sit through that in a max short position. So I covered in order to step back and reassess.
Today’s labor report and, most importantly, the Timiraos/Powell reaction…
Today’s labor report and, most importantly, the Timiraos/Powell reaction…
…to it, confirmed my Fed thesis heading into November 30, that being: Powell was going to shift the market’s focus away from inflation toward labor. Jason Furman and Paul Krugman’s reaction to today’s data confirms how critical it was.
Powell & Co. can try to spin the yarn that the unemployment rate rising to 4.5-5% is a soft landing all they want. It’s just not true. And even to a person, Team Transitory and Team Pivot say that if the unemployment rate goes that high a soft landing is off the table.
As I said on the Trading Journal thread, Powell broke down the Core Inflation Onion not to look through high and lagging housing services inflation but rather to look through rapidly decelerating Core Goods inflation. He is laser focused on Core Services ex. Housing, which…
…today’s labor report confirms is a big problem for Team Soft Landing.
In conclusion: I am willing to HODL to a max short position with SPX around the 200dma and the 3y/10y UST curve massively inverted. The odds of a sustained breakout from here are VERY low.
In conclusion: I am willing to HODL to a max short position with SPX around the 200dma and the 3y/10y UST curve massively inverted. The odds of a sustained breakout from here are VERY low.
What’s the catalyst for Santa’s sleigh to get shot out of the air? CPI. It is very unlikely we get another print like October.


BAML now focused on AHE rather than CPI confirms the shift in focus from inflation to labor.

Fabulous thread.
https://twitter.com/jasonfurman/status/1598819078881398785
More 600 bps FFR talk. Bond market ain’t buyin it, as evidenced by level and shape of UST curve.
https://twitter.com/LHSummers/status/1599043238106894336
The more I absorb the events of 11/30 to 12/2, the more wrong I think I was in my Jerome Burns assessment.
If he was Burns, the yield curve should have had a much more substantial steepening move.
@dampedspring - I know you had the Burns assessment, too. Curious if you’ve…
If he was Burns, the yield curve should have had a much more substantial steepening move.
@dampedspring - I know you had the Burns assessment, too. Curious if you’ve…
…had second thoughts (?).
He peeled the Williams Onion back to focus the market’s attention on the labor market into a deeply inverted curve with leading indicators going off the cliff…
He peeled the Williams Onion back to focus the market’s attention on the labor market into a deeply inverted curve with leading indicators going off the cliff…
https://twitter.com/3F_Research/status/1599058384942080000
Market Journal: December 5, 2022.
Mission far from accomplished.
Mission far from accomplished.
The Fed is obviously not happy with the “mission accomplished” sentiment. Timiraos out earlier than normal with a blackout period FOMC preview.
wsj.com/articles/fed-c…
wsj.com/articles/fed-c…
The Q&A walk-back.

50s in December and February and 25s until “clear signs the labor market has cooled.”

This shift in focus from inflation to labor is what I was looking for here.
https://twitter.com/TheCarter758/status/1595442921028915207
Timiraos closes with a gut punch to Team Pivot.

The debate about 50 in February frames the entire MonPol debate very well and underscores the importance of the Williams Onion.
Team Pivot doesn’t really care about the core, only housing and supply chain affected goods.
Team Pivot doesn’t really care about the core, only housing and supply chain affected goods.

I strongly suspect the CPI report next week will lay to rest the debate about the durability of the inflation deceleration and in turn whether the Fed goes 50 in February.

Market Journal: December 6, 2022.
Topping.
Topping.
The One Chart.
Few understand how right @leadlagreport could be on the right side of the equal sign.
Few understand how right @leadlagreport could be on the right side of the equal sign.

DSI confirms with a lower high and rolling over in tandem with SPX failing at the 200dma with 3y/10y making a fresh high.

The One Chart - Version 2 (with TIPS 10s).
Few understand how right @leadlagreport could be on the right side of the equal sign.
Few understand how right @leadlagreport could be on the right side of the equal sign.

HY CDX confirming the risk-off move.

Market Journal: December 7, 2022.
The set-up is clear.
The set-up is clear.
3y10y inversion at a fresh high of 116% this morning, while TIPS 10s are well within the range that drove SPX to circa 3650 this year (64 bps in June, 170 bps in September).

Sentiment and breadth have more work to do on the downside to reach the oversold levels that have marked key tactical SPX bottoms this year.


Perhaps the line of the 2023 outlook season is from @biancoresearch (paraphrasing from memory): "Calling for a recession is the new 'bull case' on the Street, because it means the Fed will pivot."
https://twitter.com/TheHKRGroup/status/1600150701555916801?s=20&t=maWKyLzew3AJJEVFa85_QQ
As tempting as this path looks, sentiment, breadth and CDX do not support this right now.
https://twitter.com/DanielTNiles/status/1600528828719591424
Let's erase the November 10 CPI move ahead of Powell on "higher than expected" CPI data, and see if we don't get a bit of a reflexive bounce into YE.


There have been 4 major downside Core CPI surprises since inflation broke out in early 2021: August 2021, and March, July and October of this year. The "Street" has underestimated the following MoM Core CPI reading every single time, by -4, -17, and -27 bps, respectively.

The Cleveland Nowcast overestimated in September 2021 by 9 bps, then underestimated by -5 and -9 bps in April and August.
We'll see what happens, but the Street is currently 21 bps under the Cleveland Fed nowcast for November Core CPI...
What say you, @biancoresearch?
We'll see what happens, but the Street is currently 21 bps under the Cleveland Fed nowcast for November Core CPI...
What say you, @biancoresearch?
Market Journal: December 12, 2022.
Quick feet. Quick feet.
Quick feet. Quick feet.
Looking out over the next 4-12 weeks, the fundamental outlook is clear for the SPX: LOWER. 3y10y curve is decisively bearish, SPX rejected at the 200dma, and TIPS 10s stabilizing materially north of levels at prior SPX lows.

Key sentiment gauges and the VOL complex have turned decisively lower, suggestive of the move to new lows in the next 4-12 weeks is underway.


But ahead of CPI and JPOW, HY CDX is telling us the SPX needs to clear out a bit of bearish sentiment before resumption of its move to new lows.

Not sure we get to @agnostoxxx's 4200 pain trade threshold, but a quick kiss of the 4035 200dma before a downward dog into year-end seems like a reasonable path.
Quick feet. Quick feet.
Quick feet. Quick feet.
https://twitter.com/agnostoxxx/status/1602255217910861828?s=20&t=MEuMhnRlaPjTyLLuLtJf6w
Last paragraph of the Timiraos piece was key. Whatever it takes still firmly in play.
Team Transitory has yet to be extricated from the FOMC.

The hawks understand a recession is required.


Whatever it takes.

Whatever it takes.
https://twitter.com/NickTimiraos/status/1602350325234556928
Market Journal: December 16, 2022.
Thesis affirmed.
Thesis affirmed.
The One Chart.
The 3y10y UST curve continues to be the tie breaker in what has been a morass of macro economic dead heats. It never confirmed the pivot thesis, and now the Fed has officially validated the bearish outlook emanating from the extreme inversion. Buckle up.
The 3y10y UST curve continues to be the tie breaker in what has been a morass of macro economic dead heats. It never confirmed the pivot thesis, and now the Fed has officially validated the bearish outlook emanating from the extreme inversion. Buckle up.

CDXs confirm the move to new bear market lows is underway.


The next dovish adjustment in Fed rhetoric probably doesn't come until the GS FCI hits new highs, perhaps around the red line. Dangerous to assume that dovish adjustment comes, however, with the Election cycle out of the way and the Fed unimpressed with constant pivot talk.

The conditions to consider a tactical covering of shorts would be key sentiment gauges moving down to lows seen around tactical bottoms this year, and the % of stocks > 50dma below 10%.


From a longer term sentiment perspective, the VIX curve has got to get into a position of extreme inversion to at least start the bottoming process. Once the curve gets down to the green line, day trading around 5-10% daily volatility can commence.

Valuation, the business cycle, and Fed policy will ultimately set the bottom for this recessionary bear market. The 3y10y curve reaching parity will be a key tell to go on alert that the market might have entered a zone of a durable bottom.
Market Journal: December 20, 2022.
Remembering December 2015.
Remembering December 2015.
HY CDX has a completely different feel to it right now than it did from the October 13 SPX low to the local December high. It keeps jumping higher on every tick of SPX weakness.
Perhaps it’s December 2018, as some have posited. But it feels more like December 2015, IMO.
Perhaps it’s December 2018, as some have posited. But it feels more like December 2015, IMO.
In December 2015 the market got emaciated beneath the surface while the index itself hung in there and chopped around. But most critically, HY CDX moved relentlessly higher despite the index not moving much. Then the bottom fell out in early 2016.
I think that’s what going on right now. Too much liquidity and options positioning for whatever reason are keeping the SPX from a limit down day. It should’ve been limit down on the BOJ news last night and it wasn’t. Yet, HY CDX keeps marching higher.
In early 2016 the scene of the crime was Energy, and the market bottomed around the time of the WMB/ETE implosion, down -40% in a day.
I fully anticipate waking up to $ARKK down -40% in a day at some point next year.
I fully anticipate waking up to $ARKK down -40% in a day at some point next year.
Market Journal: December 23, 2022.
TIPS 10s moving above 150 bps this morning. "The One Chart" continues to play out beautifully. A new SPX bear market low is in train for 1Q23.

The Goldman FCI has to break to new highs before there is any possibility of a softening in Fed rhetoric. The problem is the Fed now knows that it shoots itself in the foot whenever it engages the "soft put".
My thesis is the Fed needs to get the FCI overshoot to provide...
My thesis is the Fed needs to get the FCI overshoot to provide...

...greater room to do anything that could be perceived as dovish, such as a pause in hikes.
I don't know the exact math on this, but my hunch is somewhere between SPX 3000 and 3300 would drive the FCI into "sufficiently restrictive" territory.
I don't know the exact math on this, but my hunch is somewhere between SPX 3000 and 3300 would drive the FCI into "sufficiently restrictive" territory.
It'll be tricky to manage short exposure on the way down, because breadth and sentiment data are likely to reach "oversold" territory prior to the Goldman FCI reaching "sufficiently restrictive" territory.
It's tempting to use the exact playbook of the last 12 months, where...
It's tempting to use the exact playbook of the last 12 months, where...
...it paid to start looking up once oversold conditions were achieved. But now two things have changed:
1. 2023 is a "kitchen sink" year for the Fed. It's the year before a new election cycle, and they know they need to hammer the economy NOW to get inflation under control...
1. 2023 is a "kitchen sink" year for the Fed. It's the year before a new election cycle, and they know they need to hammer the economy NOW to get inflation under control...
...enough to allow the economy and markets to support Democrats in 2024.
2. Big money is now bearish, as represented by David Tepper. The importance of his interview yesterday cannot be dismissed. A) The fact he believes the "Fed Put" is between SPX 2300 and 2800 means...
2. Big money is now bearish, as represented by David Tepper. The importance of his interview yesterday cannot be dismissed. A) The fact he believes the "Fed Put" is between SPX 2300 and 2800 means...
...other big money players believe the same and will not be material buyers until the SPX is substantially lower. B) Lazy money will follow Tepper, and there is still a ton of lazy money sitting on big Tech gains "looking long term".
So, PATIENCE GRASS HOPPER (speaking to myself). PATIENCE on the short side. Be greedy until all the sentiment and breadth indicators line up for a BMR back to the 200dma.
% of NYSE stocks above the 50dma currently 46%. This needs to get to 0-5%. Good spot to start reducing short exposure, while keeping in mind that local lows are often made with this indicator making a higher low.

10-day advancing volume can be a tricky signal because oversold levels can often precede big declines, but the 25% mark would be pretty good confirmation of other oversold signals that a local bottom is forming.

Positioning starting to spike lower, but not there yet.

And key sentiment composites are firmly in a downtrend. At minimum these need to get down to levels that marked key lows throughout 2022.


Market Journal: December 27, 2022
Quicksand.
Quicksand.
The effects of policy tightening in 2022 will diminish rapidly through 1H23. Therefore…

…The Fed must drive the GS FCI to new highs and keep it there.

TIPS 10s are the key lever for tightening the noose. On watch for the Kashkari 200 bps target as outlined back in mid-June.

TIPS 10s tighten the noose on equities, and lower equity prices will drive the GS FCI to new highs.
$SPY and $QQQ are far away from oversold territory as measured by the % of stocks over their 50dma.
With TIPS 10s reaccelerating higher, defensive sectors strong, and Tech a crashy mess, the indices are stepping into quicksand as we enter 2023.
With TIPS 10s reaccelerating higher, defensive sectors strong, and Tech a crashy mess, the indices are stepping into quicksand as we enter 2023.


Market Journal: December 28, 2022
Tick-tock. Tick-tock.
Tick-tock. Tick-tock.
One of the oddest lower highs in the 3M VIX curve so far YTD. Typically it occurs alongside a mini-BMR, but this time with SPX flat. Now the curve is rolling...

HY CDX on the highs with SPX off the lows…


Now we know why HY CDX is unhappy today.
China reopening a classic “surprise” downside catalyst in the middle of a recessionary bear market.
Worst of all worlds for Team Perma Bull, as China reopening exports inflation via higher commodity demand and now disrupted travel…
China reopening a classic “surprise” downside catalyst in the middle of a recessionary bear market.
Worst of all worlds for Team Perma Bull, as China reopening exports inflation via higher commodity demand and now disrupted travel…

…tangling global trade flows while slowing growth.
“Mama, there goes that man.”

Market Journal: December 29, 2022.
Friends don't let friends buy laggards into year-end in the middle of a bear market.
Friends don't let friends buy laggards into year-end in the middle of a bear market.
2008.
Bank relative strength appeared to stabilize over the course of Q4 alongside the broad market. But right from the opening bell of 2009 Bank relative strength plunged. The SPX rallied a bit, but then soon rolled over.
Bank relative strength appeared to stabilize over the course of Q4 alongside the broad market. But right from the opening bell of 2009 Bank relative strength plunged. The SPX rallied a bit, but then soon rolled over.

2015.
The SPX was choppy into year-end as Energy sold off and HY CDX rebased at higher lowers. As soon as 2016 trading opened SPX started moving lower, HY CDX moved higher, and Energy soon followed lower after a bit of dip buying in the first few days of the year.
The SPX was choppy into year-end as Energy sold off and HY CDX rebased at higher lowers. As soon as 2016 trading opened SPX started moving lower, HY CDX moved higher, and Energy soon followed lower after a bit of dip buying in the first few days of the year.

2000-2002.
No actionable year-end trading comps, but throughout the bear the only tradable relative strength lows in NDX came around tactical SPX lows.
No actionable year-end trading comps, but throughout the bear the only tradable relative strength lows in NDX came around tactical SPX lows.

Today.
SPX is still well north of a tactical new bear market low. HY CDX is rebasing higher. And "scene of the crime" sectors ($ARKK and $QQQ) are on the lows.
Not yet the time to play contrarian.
SPX is still well north of a tactical new bear market low. HY CDX is rebasing higher. And "scene of the crime" sectors ($ARKK and $QQQ) are on the lows.
Not yet the time to play contrarian.

This rip today is beyond excellent. Every long-only "compounder" HODLer bro will not only be breathing a sigh of a relief that they'll get some performance back into year-end, but the bottom is now "obviously" in after "obvious" tax-driven selling into yesterday's lows.
I vividly remember in the final trading days of 2015 when all the Energy crap ripped after tax loss selling, an excellent former mentor of mine presciently said: "Everything outperforming today will be the worst performers in 1Q16."
As he would say: LFG.
As he would say: LFG.
Today was beautiful. Big, fat higher low in HY CDX with sentiment not even oversold, and…


…the % of $SPX and $NDX stocks above their 50dma far too high.


Most importantly, the yield curve flattened. $SPX and $NDX quite literally hang themselves when they rally into Fed and ECB tightening.

Market Journal: January 3, 2023
And so it begins.
And so it begins.

Solid move down in European CDX.

Let’s see what Jerome Lagarde has to say about Wen Pivot.
Banks know what’s up.
Banks know what’s up.

Better version of chart above.

Bizarre day of trading. Defensives and cyclicals leading. Tech ugly. Feels like first few days of 2022.
Defensive sector comeback throughout the day tells the truth, IMO.
Defensive sector comeback throughout the day tells the truth, IMO.
CTAs locked and loaded to sell. Just need that catalyst….
Tick tock, tick tock.
Tick tock, tick tock.


Market Journal: January 6, 2023
Red close.
Red close.
Defensives ripping and Powell cometh.
LFG.
LFG.
Market Journal: January 9, 2023
The CDX canary?
The CDX canary?
ITRX CDX has broken down hard, and the US HY CDX is not far behind.
This type of action (breaking below the 200dma) typically comes early in a bull market.
Need confirmation from the yield curve and breadth data, but something to monitor.
This type of action (breaking below the 200dma) typically comes early in a bull market.
Need confirmation from the yield curve and breadth data, but something to monitor.


If this is a fakeout breakdown in CDX (as the yield curve would suggest), excellent opportunity to start layering on credit hedges.
All sorts of bullishness lining up for a big rip.
Does the Fed endorse another round of easing?
Does the Fed endorse another round of easing?


Fed did not endorse another round of easing. Its principal form of pushback was Bostic’s “hold at the terminal well into 2024” on back to back days.
For the cuts priced into the 2H23 OIS market to materialize, either financial conditions have to tighten well beyond the…
For the cuts priced into the 2H23 OIS market to materialize, either financial conditions have to tighten well beyond the…
…Fed’s comfort zone, or unemployment has to shoot up above the 4.5-5% target, in which case SPX is highly unlikely to bottom above 3000.
Unemployment is unlikely to rise that quickly, so base case thesis is SPX and credit force the Fed to hit the pause button by June 30.
Unemployment is unlikely to rise that quickly, so base case thesis is SPX and credit force the Fed to hit the pause button by June 30.
Today’s action in cyclicals vs. defensives ex. Utilities was not bullish, IMO. I think Pharma and Staples are pointing the way lower and will resume leadership once the rest of the market catches up.
This goes a long way toward explaining the breakdown in European CDXs. Putin risk getting sucked out of the market.
Big deal from a sector perspective - helps explain the move in Industrials, etc - not sure on macro implications yet beyond the obvious.
Big deal from a sector perspective - helps explain the move in Industrials, etc - not sure on macro implications yet beyond the obvious.
https://twitter.com/LiveSquawk/status/1612676551878787073
Market Journal: January 12, 2023
You’ll know it when you see it.
You’ll know it when you see it.
YTD $ARKK is up 11.3% vs. 3.4% SPX.
That’s not “off THE bottom” type action.
When everything bottoms, Cathy will be up 5-10% a day for a week. Massive, get-me-in-NOW action.
That’s not “off THE bottom” type action.
When everything bottoms, Cathy will be up 5-10% a day for a week. Massive, get-me-in-NOW action.
It certainly *feels* like the soft landing is coming together and it’s up and away from here, especially with CDXs breaking down hard.
But you can’t get behind that with the yield curve inverted. Not how it works in bear markets.
3y/10y UST curve currently 111%…
But you can’t get behind that with the yield curve inverted. Not how it works in bear markets.
3y/10y UST curve currently 111%…

…and needs to get to 100% before we entertain a durable bottom is in the cards.
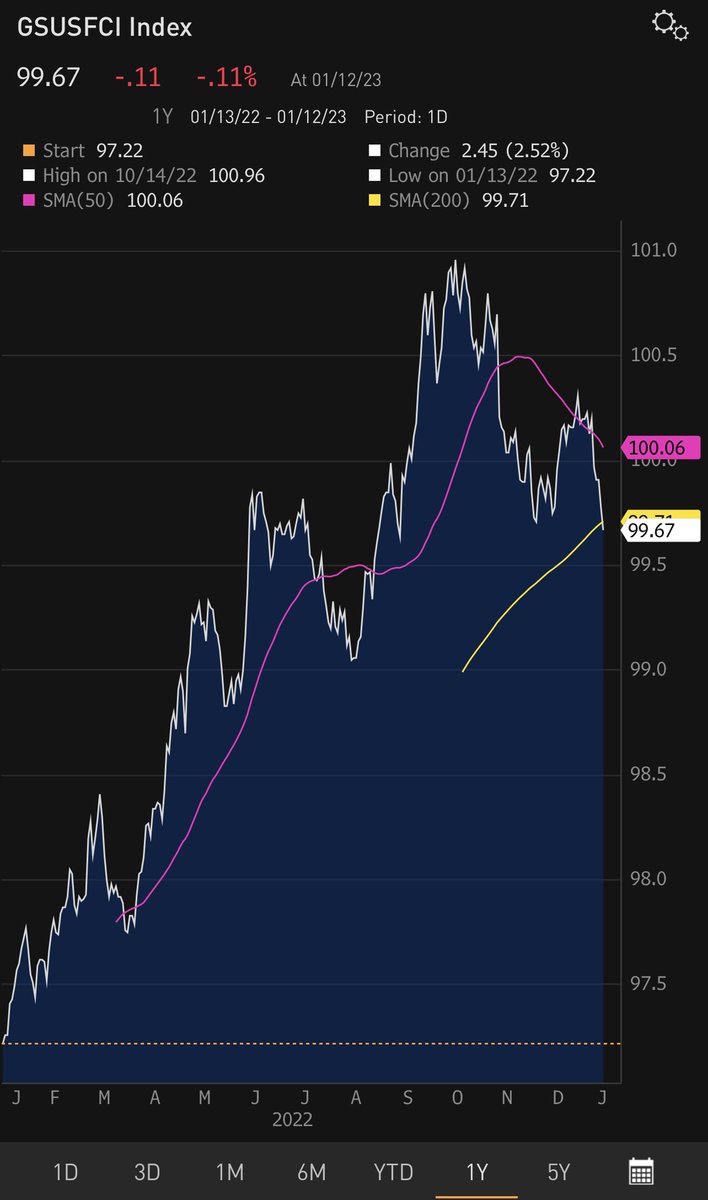
This is the problem - GS FCI is essentially flat with where it was in May 2022. Does that reflect “the tightening that’s been put into place”?

They’re going to rip 50s until new highs in the Goldman FCI are attained and maintained. Whether that results in 700-800 bps is entirely up to the equity and credit markets.
https://twitter.com/JackFarley96/status/1613268664664616962
I’ll leave the short term trading up to @agnostoxxx and @jam_croissant. All I know is that the longer the market challenges the Fed, the more violently we ultimately move to this bear market’s downside destination.
I misspoke - GS FCI is down close to June 2022 levels, not May.
Here’s last print through yesterday’s close.
Here’s last print through yesterday’s close.

Goldman data on the impact of easing financial conditions.
Note the lack of focus on the unemployment rate.
Note the lack of focus on the unemployment rate.


Then Dudley.


Market Journal: January 13, 2023
The dreaded “premature easing” of financial conditions.
The dreaded “premature easing” of financial conditions.
GS FCI now below where the re-tightening blitz began at the December FOMC meeting.
Thrust signals abound.
https://twitter.com/TheCarter758/status/1613759315902349313

Pivot calls abound.
https://twitter.com/crossbordercap/status/1613974016078774278
YoY Core Services ex. Housing not even in the pivot ballpark, let alone at home plate.
https://twitter.com/M_McDonough/status/1613532098731692033
3y/10y UST curve not even remotely confirming a pivot.


2H23 rate cuts 100% untenable with the “anti-Burns” reaction function.
It’s more likely, IMO, that the Fed doesn’t hike on February 1 and just holds for the rest of 2023.
It’s more likely, IMO, that the Fed doesn’t hike on February 1 and just holds for the rest of 2023.

This market structure suggests a big tightening of financial conditions between now and February 1, enough to force the Fed to pause.

Market Journal: January 30, 2023
Dreaming of an ECI dream short shake & bake.
Dreaming of an ECI dream short shake & bake.
Vince called time on the rally on Friday, and we got follow through today.
https://twitter.com/TheCarter758/status/1619023930605584385
But the set-up is there for a rip to a lower high on a deceleration in ECI tomorrow ahead of Powell. Dream short.
Market Journal: January 31, 2023
ThereWillBeBlood#
ThereWillBeBlood#
ECI deceleration rip in process.
https://twitter.com/TheCarter758/status/1620391226821455872
Rip not confirmed by VVIX, but is by HY CDX.
More to run, IMO.
More to run, IMO.


If you study Bridgewater, listen to Mary Daly’s talk with Timiraos, and read below from @jasonfurman today, you will know why Powell will do two things tomorrow…
https://twitter.com/jasonfurman/status/1620437287636176896
1. Powell will step back, zoom out, and discuss the broader project that is the Fed’s mission to bring inflation back to 2%.
The market expects once wage inflation returns to 3.5% that the Fed’s job is done and they can cut rates. Not even close.
As with inflation…
The market expects once wage inflation returns to 3.5% that the Fed’s job is done and they can cut rates. Not even close.
As with inflation…
…they will need to see 6 months of wage gains in the 3.5% range before they reduce the restraint in place.
ANTI-BURNS REACTION FUNCTION.
2. Powell will confirm the enhanced QT program that’s been discussed all month by Dudley and the FOMC.
ANTI-BURNS REACTION FUNCTION.
2. Powell will confirm the enhanced QT program that’s been discussed all month by Dudley and the FOMC.
Hence, this ECI decel rally is just a beautiful short term trading set-up.
LFG
LFG
Market Journal: February 2, 2023
The day after.
The day after.
With the Fed Call gone, the analysis can turn to more traditional indicators.
1. Of course, with the curve relentlessly and deeply inverted, the bond market projecting cuts, and Conference Board YoY Leading index in the toilet, recession blah blah blah.
1. Of course, with the curve relentlessly and deeply inverted, the bond market projecting cuts, and Conference Board YoY Leading index in the toilet, recession blah blah blah.
2. Thrust data, cyclicals > defensives, and CDXs through the floor all confirm the reacceleration in macro underwritten by FCI easing since October.

3. Yes, sentiment is “stretched”, but not overly so given the “new bull market” that’s now in place.
https://twitter.com/MacroCharts/status/1621116232895287297
4. Fresh Croissant outlined the near-term path circa 1:27. Vanna and Charm underpin more squeeze until Feb 15 OPEX. Then we look to re-short on tremendous FOMO sentiment.
podcasts.apple.com/us/podcast/unu…
podcasts.apple.com/us/podcast/unu…
5. CDXs through the floor.


Market Journal: February 3, 2023
Goldilocks.
Goldilocks.
Powell didn’t go full Burns this week. He went full Burns in October by deputizing Brainard to put a stop to tightening FCI.
October was “The Pause”. Not this week.
October was “The Pause”. Not this week.

If you study Bridgewater, you know the Fed is taking the Burns “stop and go” route because they’re worried about growth. BW’s Bob Prince warned of this. Whereas Jensen thought the Fed had done enough.
The Kitty, The Croissant, and The Shrub have been way ahead of me on this. I’ve been too focused on the Fed Call and not enough on The Brainard.
The Brainard doesn’t react until the data hits it in the face.
The Brainard doesn’t react until the data hits it in the face.
The bottom line is I have to reorient my thinking. More nimble, more contrarian, more basic.
My thought since late last year was Powell would want to take care of the inflation problem before 2024 POTUS politics got in the way.
Nope. Too basic. Have to…
My thought since late last year was Powell would want to take care of the inflation problem before 2024 POTUS politics got in the way.
Nope. Too basic. Have to…
…get in the mind of The Brainard and out of the economic machine thinking of Bridgewater.
Let’s go for the soft landing.
🙄🙄🙄🙄🙄
Let’s go for the soft landing.
🙄🙄🙄🙄🙄
Going for the soft landing means rates go even higher and the SPX ultimately goes even lower.
Why?
Because inflation is not transitory and by mathematical definition requires an economic contraction to bring it back to 2%. And since the current amount of Fed tightening is…
Why?
Because inflation is not transitory and by mathematical definition requires an economic contraction to bring it back to 2%. And since the current amount of Fed tightening is…
…clearly not enough to contract the economy, rates are headed even higher.
theweightoftheevidence.substack.com/p/the-fed-back…
theweightoftheevidence.substack.com/p/the-fed-back…
The Fed is literally day trading economic reports. This is insanity.
https://twitter.com/NickTimiraos/status/1621582523347177472
“Job gains reported Friday could unsettle officials…”
The Fed was doing a disinflationary soft landing victory lap the last two weeks, led by Larry Summers, and now just one report changes the landscape?
WITAF????
The Fed was doing a disinflationary soft landing victory lap the last two weeks, led by Larry Summers, and now just one report changes the landscape?
WITAF????

How “long and variable” can the lags be if The October Pause led to this big of a reacceleration?
Same thing happened in the fall, when data firmed on the back of July/August FCI easing.
Same thing happened in the fall, when data firmed on the back of July/August FCI easing.

The bottom line is this: If the Fed still cares about its 2% target, given the incredible damage done to Powell’s FCI management credibility this week, only the market gods know what it will take to re-tighten FCI.
Summers confirms the day trading of economic reports thesis discussed above and validated by Timiraos.
These people.
These people.
Market Journal: February 5, 2023
The walk back.
The walk back.
What a bizarre turn of events in Fed policy land. Summers is already backing away from his “hope can triumph” optimism for a soft landing.
https://twitter.com/LHSummers/status/1622370691847790595
The initial Fed reaction is likely guiding to a higher terminal rate as outlined by Conor Sen. But…
https://twitter.com/conorsen/status/1622376464040574976
…After Jerome Brainard Burns’ torching of the Fed’s FCI management credibility last week, Powell probably needs to put 50s back on the table to wrestle back control.
Perhaps this Tuesday he says something along the lines of “we’re by no means locked into 25s.”
Perhaps this Tuesday he says something along the lines of “we’re by no means locked into 25s.”
Phenomenal addition to the post-Powell commentary in this thread.
https://twitter.com/INArteCarloDoss/status/1622581220981854209
10s moving above 500 in relatively short order seems like a no brainer, especially if the Fed slow walks with 25s.
Relatively weak $SPY $QQQ move lower today, IMO, given the move in rates.
Everyone expecting Powell to “correct” his presser comments. I don’t think that’s right…
Everyone expecting Powell to “correct” his presser comments. I don’t think that’s right…

His press conference was a carbon copy of Waller’s interview. It was not an accident, therefore it doesn’t need to be corrected.
He’s probably happy with the rate movement in the wake of NFP, a proper interpretation of the Fed “reaction function”.
I think he’ll subtly…
He’s probably happy with the rate movement in the wake of NFP, a proper interpretation of the Fed “reaction function”.
I think he’ll subtly…
…shift his stance as Larry Summers did. Something along the lines of “we’re not locked into 25s”.
So, probably get some rippy equity action around Powell not aggressively pushing back. But the top is likely near.
The market will #bigflip on its own, as rates are…
So, probably get some rippy equity action around Powell not aggressively pushing back. But the top is likely near.
The market will #bigflip on its own, as rates are…
…at the moment (as is the USD).
50dma breadth has yet to confirm a new bull market. Critical info.
50dma breadth has yet to confirm a new bull market. Critical info.

And lastly, The Croissant outlined the path ahead circa 1:27 last week.
“Goldilocks is the worst case scenario.”
podcasts.apple.com/us/podcast/unu…
“Goldilocks is the worst case scenario.”
podcasts.apple.com/us/podcast/unu…
Market Journal: February 7, 2023
“Living in the gap.”
“Living in the gap.”
Interesting set-up into Powell with $QQQ and VVIX green.

Even more interesting….
3y/10y curve 113% 🔥

Got a good mini-sell off as indicated by the VVIX divergence ahead of Powell, but a powerful close despite a pretty hawkish message from Powell.
I think Powell largely went along with the thoughts in the Market Journal update yesterday:
I think Powell largely went along with the thoughts in the Market Journal update yesterday:
https://twitter.com/TheCarter758/status/1622395973120020481
The big takeaway from Powell’s interview today was him prepping the market for a slog. “Higherer for longerer” as it were.
The shift from a focus on overall FCI to just rates is interesting. Still mulling what it means.
The shift from a focus on overall FCI to just rates is interesting. Still mulling what it means.
The fact the Fed and the bond market reacted so quickly to NFP is a preview of what is to come as growth and inflation reaccelerate as a result of the Fed allowing overall FCI to ease.
The data are going to steamroll the Fed if the trends in January continue.
The data are going to steamroll the Fed if the trends in January continue.
The equity market is obviously overbought on a variety of sentiment measures, just as the data are starting to turn and rates are moving up. You can see the recipe for The Croissant Sell-Off in the March-April timeframe.
It’s the nature of the sell-off that will be…
It’s the nature of the sell-off that will be…
…critical to measure.
If everything goes down including defensives, The Shrub is likely right that the bear market lows are in on the next sell-off.
But if there is a resumption of the trends that have been in place since early 2022, then bear market still in place.
If everything goes down including defensives, The Shrub is likely right that the bear market lows are in on the next sell-off.
But if there is a resumption of the trends that have been in place since early 2022, then bear market still in place.
Market Journal: February 8, 2023
VVIX.
VVIX.
Gargantuan move in VVIX today relative to VIX and the overall move down in equities. Excellent start if it's the latter...
https://twitter.com/TheCarter758/status/1623302388244250624?s=20&t=MFpi4sUADfiggxfT7gC2LQ
If this is a new bull market, the scale of "this time is different" would be epic. Inverted curve, Fed hiking, no 50dma breadth thrust.
Insider selling is the cherry on top.
Insider selling is the cherry on top.
https://twitter.com/GameofTrades_/status/1623030596791595008?s=20&t=MFpi4sUADfiggxfT7gC2LQ
This level of hawkishness is not what I expected after Powell's Feb 1 presser when he officially "let go" of FCI. This is the anti-Burns reaction function implied by a deeply and persistently inverted 3y/10y UST curve.
https://twitter.com/TheCarter758/status/1623356697782763520?s=20&t=MFpi4sUADfiggxfT7gC2LQ
Market Journal: February 9, 2023
Tells.
Tells.
1. I think BTC is a “tell” on the durability of $QQQ $ARKK $SOXX strength today
2. I think the muted decline in HY CDX is a “tell” on the durability of equity strength today
3. I think the on-going $XLU smash is a “tell” on rates
2. I think the muted decline in HY CDX is a “tell” on the durability of equity strength today
3. I think the on-going $XLU smash is a “tell” on rates
“Tells” played out. Rippy $SPY $QQQ into 1500?
Dippy no rippy.
Bulls look great here. Keep buying.
Bulls look great here. Keep buying.
Bad auction must be coming at 1300. HY CDX not happy.
https://twitter.com/Fullcarry/status/1623732201190998016
Probably it for now. Time to watch for divergences on a bounce.
The Brainard/Yellen Liquidity Machine can’t let’s things drop too far, too fast.
Market Journal: February 10, 2023
A material change in character.
A material change in character.
This is a different market. VVIX and HY CDX are now much quicker to bounce from red to green.
From a very short-term tactical perspective I'm focused on the Waller Rally zone from January 20. BTC is already back in that zone, as discussed yesterday.
From a very short-term tactical perspective I'm focused on the Waller Rally zone from January 20. BTC is already back in that zone, as discussed yesterday.
https://twitter.com/TheCarter758/status/1623768388215443466?s=20&t=Dk2bCojbLI-pBEiQWDdL6g
Now HY CDX is knocking on the door of the zone.
With December CPI getting revised up and Larry Summers out day trading economic reports again with a hawkish flip of message, there is a window for $SPY $SPX weakness into Monday ahead of CPI.
With December CPI getting revised up and Larry Summers out day trading economic reports again with a hawkish flip of message, there is a window for $SPY $SPX weakness into Monday ahead of CPI.
https://twitter.com/TheCarter758/status/1624094720510111759?s=20&t=Dk2bCojbLI-pBEiQWDdL6g
SPX saved by Harker's "soft landing" message. You go, bulls.
Market Journal: February 20, 2023
Catalysts.
Catalysts.
Tues: US PMIs (#bigflip confirmed or @DanielSLoeb1 fakeout?)
Wed: FOMC minutes (No More Brainard effect?)
Fri: Core PCE + UMICH + Waller at 1:30 (GS has Core PCE 55 MoM vs. 40 Street, and Waller is speaking on “Why did we miscast inflation?” Perfect storm?)
Wed: FOMC minutes (No More Brainard effect?)
Fri: Core PCE + UMICH + Waller at 1:30 (GS has Core PCE 55 MoM vs. 40 Street, and Waller is speaking on “Why did we miscast inflation?” Perfect storm?)
If $SPY and $QQQ don’t jump out the window of weakness in response to hawkish data, FOMC minutes, and Fedspeak, HY CDX shows signs of breaking down, and defensive sectors don’t continue the stabilization process, then the stage is set for The Croissant Ripper into March 31.
Market Journal: February 22, 2023
Hanging out the window.
Hanging out the window.
PMIs were a big deal, not because $SPY $QQQ went down but because the bond market responded hawkishly. OIS now has FFR peaking above 535 in July, materially north of the FOMC’s December “dot”.
The dot’s going higher.
The dot’s going higher.
Services prices paid was the key datapoint, as it went directly in the face of the “disinflation” narrative that’s permeated the market conversation.
Once the market wakes up to what Bridgewater’s analysis has been saying for 18 months - that being…
Once the market wakes up to what Bridgewater’s analysis has been saying for 18 months - that being…
https://twitter.com/TheCarter758/status/1628044292949172225
…inflation is not only not transitory, but far from transitory - that’s when the SPX de-rates to the 10-15x P/E range.
Once SPX gets into that range, we can finally start talking about all of this macro badness being “priced in”. At 4000, SPX is 20x peak EPS. No bueno.
Once SPX gets into that range, we can finally start talking about all of this macro badness being “priced in”. At 4000, SPX is 20x peak EPS. No bueno.
In response to PMIs the equity market fell, but more importantly HY CDX shot up and defensive sectors outperformed, confirming the durability of the decline.
Bulls have a fair amount of work to do if they want The Croissant Ripper into March 31.
Bulls have a fair amount of work to do if they want The Croissant Ripper into March 31.
The market reaction to the FOMC minutes today was a good start if bullish: vol got hit, HY CDX came in, and defensives were mixed. And that makes sense because…
Tactically, the minutes were nothing. There was no commentary about going back to 50s or ramping QT.
However…
Tactically, the minutes were nothing. There was no commentary about going back to 50s or ramping QT.
However…
Strategically, there were two important points surrounding the minutes.
1. The FOMC added a specific paragraph about market stability, citing elevated residential and commercial real estate and equity valuations as “notable”.
1. The FOMC added a specific paragraph about market stability, citing elevated residential and commercial real estate and equity valuations as “notable”.

2. Nick Timiraos’s WSJ column on the minutes all but confirmed the March “dot” is headed higher, and explicitly endorsed the recent tightening of financial conditions.
wsj.com/articles/fed-m…
wsj.com/articles/fed-m…
Right now $SPY and $QQQ are hanging by their feet out the window of weakness: PMIs gave the push, but the indices caught their feet on better-than-feared minutes.
Friday’s PCE data and 1:30pm Waller speech should determine whether the market can hang on.
Friday’s PCE data and 1:30pm Waller speech should determine whether the market can hang on.
This rip on the $NVDA report ahead of Friday is not helpful if one is bullish on a “better than feared” PCE report.
IMO, PCE will continue the trend of hotter-than-desired data. The wildcard is Waller. If the market is weak into Waller then he may soft-pedal.
IMO, PCE will continue the trend of hotter-than-desired data. The wildcard is Waller. If the market is weak into Waller then he may soft-pedal.
But the runway is clear for weakness into the critical March 10 jobs report: sentiment composites remain elevated, CTAs are tapped out, and TIPS 10s say SPX should be in the 3600-3800 range.
To get The Croissant Ripper into March 31, at minimum sentiment needs to get oversold.
To get The Croissant Ripper into March 31, at minimum sentiment needs to get oversold.
Zooming out from a strategic perspective:
1. There is no durability to a move above the Feb 2 high of SPX 4195 with growth and inflation sticky and the Fed’s anti-Burns reaction function in place.
1. There is no durability to a move above the Feb 2 high of SPX 4195 with growth and inflation sticky and the Fed’s anti-Burns reaction function in place.
2. As evidenced by Timiraos’s highlighting of the FRB Cleveland “higher for longer” paper…
https://twitter.com/NickTimiraos/status/1628062934604603392
…and Loretta Mester’s speech discussing the risk that inflation is more entrenched than previously thought, the Fed is beginning to prepare the Country broadly and financial markets specifically what it’s going to take to get inflation back to target.
https://twitter.com/TheCarter758/status/1626240256063447040
3. With a hard landing as a fait accompli, the ultimate destination for the S&P 500 is 12.5 times $198 peak EPS, or circa 2475. Give or take 2.5 turns. Something along the following lines makes sense:
• Cover shorts at 3000
• Go long at 2500
• Lever up at 2000
• Cover shorts at 3000
• Go long at 2500
• Lever up at 2000
4. As far as navigating the path to the ultimate low, for a variety of reasons it’s probably best to view February 2, 2023 as the start of the bear market, circa SPX 4195.
Roughly speaking, sturdy BMRs should be expected starting at the -20% mark, then -30%, etc.
Roughly speaking, sturdy BMRs should be expected starting at the -20% mark, then -30%, etc.
5. #4 is a clean map, but the indicators will be the guide. Once the % of stocks above their 50dma falls below 10%, it’s time to start looking up for a time.
-20% down from 4195 is 3356, which actually may line up reasonably well with getting the 50dma oversold signal to fire.
-20% down from 4195 is 3356, which actually may line up reasonably well with getting the 50dma oversold signal to fire.
Market Journal: February 23, 2023
ST trap?
ST trap?
HY CDX and the vol complex are both red today, and defensive sectors aren't really doing much. Yes, a seemingly bearish sell the rip on the $NVDA nonsense this morning, but I would expect more from those three, so today might be a bear trap into PCE and Waller tomorrow.
A great set-up would be a big rip on a PCE "beat", then a slow-drip sell-off into Waller before he spikes the football into the close.
But those are super micro tactical thoughts.
But those are super micro tactical thoughts.
From the standpoint of The Croissant Ripper, DSI has got to come in more. And for it to be more than just a few % bump (as highlighted below), DSI needs to get down and stay down through the March 10 jobs report to set the market up for a big rip into March 31.

Gimme that PCE rip ahead of Waller.
Market Journal: February 24, 2023
Bad read.
Bad read.
Weird market action yesterday ahead of this PCE dump, especially in HY CDX.
We’ll see how things trade into Waller.
We’ll see how things trade into Waller.
Yowza today is not what I expected after yesterday’s action. Just bizarre. Could be off again on reading the ST indicators but it sure looks like Waller is going to hammer. This move in rates is fugly.
https://twitter.com/TheCarter758/status/1629149251769884673
Market Journal: February 25, 2023
Can you feel it?
Can you feel it?
Fundamentally, the market is set up to move lower.
https://twitter.com/thecarter758/status/1629232092021198850?s=46&t=dey1TsHQ-rahD_bzVlglJQ

Technically, the stage is set for an “event” as a result of 0DTE and CTA activity.


As discussed here, OIS out-hawking the Fed sets the market up for a “surprise” that leads the Fed to ramp up the March SEP. IMO that datapoint is the March 10 NFP report.
https://twitter.com/thecarter758/status/1629493188078469122
Market Journal: March 1, 2023
‘Twas the night before Waller…
‘Twas the night before Waller…
…when all through the market, not a stock was stirring, not even an $ARKK.
Rates were hung around stocks’ neck with care, in hopes that St. Burns soon would be there.
The bulls were were nestled all snug in their beds, while visions of SPX 4800 danced in their heads.
Rates were hung around stocks’ neck with care, in hopes that St. Burns soon would be there.
The bulls were were nestled all snug in their beds, while visions of SPX 4800 danced in their heads.
Waller opens the door to 50 ahead of Friday’s ISM services prices paid report. Then Bowman closes the week at 3pm Friday.


Market Journal: March 6, 2023
"It's like deja vu all over again."
"It's like deja vu all over again."
My biggest tactical mistake coming into this year was not adhering to the cardinal rule of Fed watching: When the market is not in line with Fedspeak, watch out for an oncoming change in the data.
Coming into the year the OIS market was below the 500 terminal FFR...
Coming into the year the OIS market was below the 500 terminal FFR...
...the Fed was talking up, and like clockwork a deceleration in wage data surprised the market, ultimately leading to a softening in Fedspeak that culminated with Powell's seemingly dovish Feb 1 presser (it actually wasn't that dovish outside of his FCI comments).
Today's it's the largely the opposite. OIS has the cycle terminating at 545 while the Fed is trying to keep the door open to maintaining the December "dot" if the February data come in softer than expected. Now, they have been guiding the market to raising the terminal rate...

...in the event the data comes in hotter than expected, which the equity market has taken hook, line and sinker. But the OIS market really hasn't budged off that 545 level, which tells me the February data is going to come in hot.
A Goldman report out last night detailing the fact alternative data says services and goods spending remained strong through February reinforces how little impact the Fed's tightening program has had on the economy...


...and how far behind the curve they are yet again, as evidenced by inflation expectations moving higher alongside the OIS upward repricing of the FFR path.

The 3y/10y UST curve is massively inverted relative to history, and is now near tightening cycle-to-date highs as of this morning.
This inversion confirms, yet again, "Fed Cometh."
This inversion confirms, yet again, "Fed Cometh."


Look for the need for a 75 bps hike in March to enter the conversation following jobs (March 10) and inflation (March 15) reports.
https://twitter.com/TheCarter758/status/1632407046992658432?s=20
• • •
Missing some Tweet in this thread? You can try to
force a refresh


