

Welcome Tanya Trujillo, @interior Assistant Secretary for Water and Science!
"The USGS collects vast amounts of water data, which contributes to many professions and perspectives, and many rely on that information daily. The Water Cycle Diagram helps us communicate the impacts of our actions on water and shapes water management around the planet."
The current Water Cycle Diagram is part of the USGS Water Science School, an educational resource, with over 8 million users a year! 

The current Water Cycle Diagram is part of the USGS Water Science School, an educational resource, with over 8 million users a year!
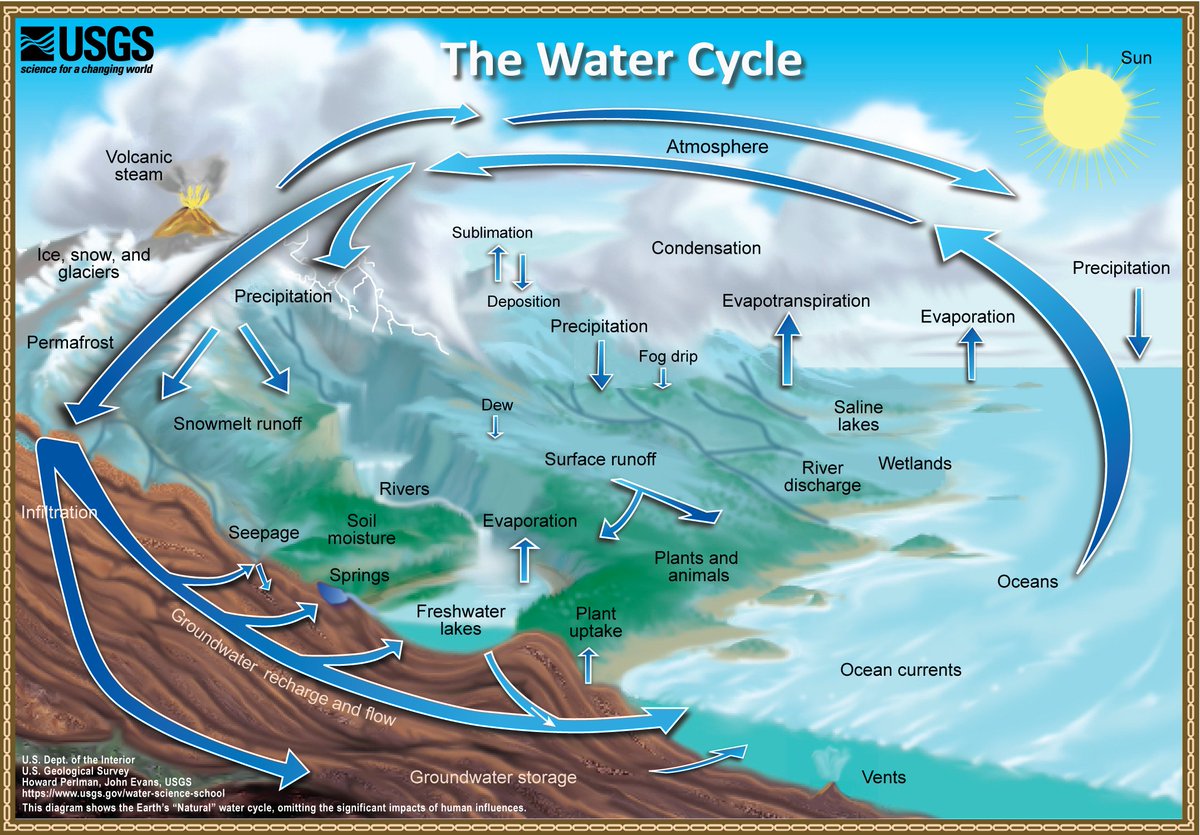
The current diagram was published in 2000 and has been translated into 60+ languages.

So why do we need a new diagram? Our understanding of the water cycle has evolved, and we need to acknowledge how humans are affecting it!
Abbot et al. (2019) conducted a meta-analysis of 400 water cycle diagrams... par.nsf.gov/servlets/purl/…
85% showed no human influence. 95% focused on a single watershed. 50% underrepresented or omitted 5 of the 10 largest global water pools (non-renewable groundwater, permafrost, saline lakes, wetlands, soil moisture). 92% omitted the largest global water flux: ocean circulation.

Meet Drippy, the Water Science School’s water-drop mascot! They’re taking us on a journey through the new Water Cycle.

⚡ Talk 1: Snow to flow. #DYK that 3 feet of fresh, fluffy snow equals 4-5 inches of snow-water equivalent (SWE, or the water depth if that snow was melted) while 3 feet of compacted, wet snow can contain 12 inches of SWE? #WaterCycleStories

The USGS studies snowpack using low-fi solutions (like a tube or digging a snow pit) and high-tech methods (ground-penetrating radar sleds and drone-based lidar).
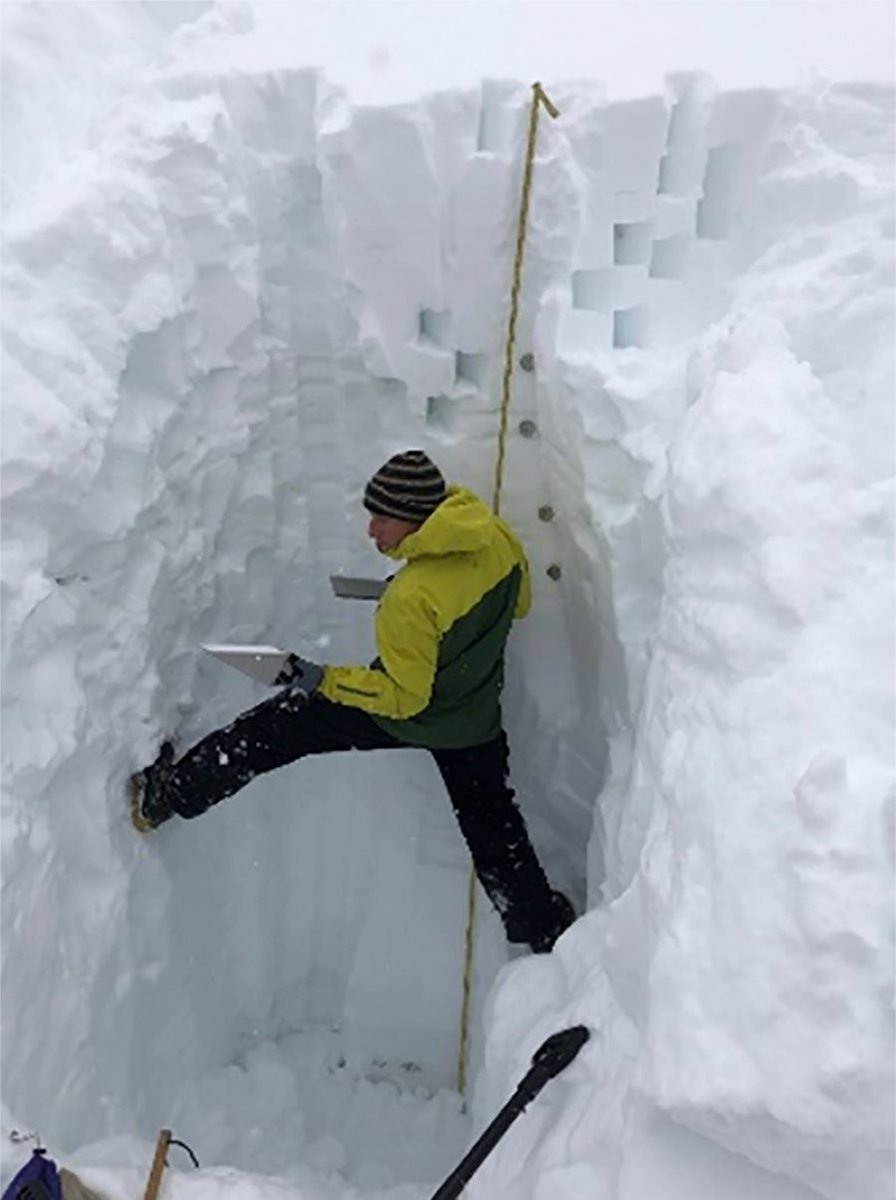
Snowpack is changing due to climate change, impacting year-round water availability in headwaters and downstream areas… sometimes many states away. 2 billion people could eventually be affected by seasonal snowpack decline.

⚡ Talk 2: Headwaters & reservoirs. Headwater streams form from water flowing off the surface into stream channels or from shallow groundwater sources like seeps and springs.

Ever felt an unusually cold spot in a stream? It might have been a groundwater discharge - they help keep streams cool, providing habitat for cold-water fish like brook trout & for organisms that indicate stream health, like macroinvertebrates.

The USGS studies how headwater streams and groundwater are connected, to better understand water availability in places like the Neversink Reservoir, an important water supply for New York City.
⚡ Talk 3: Suburban & Urban. Traditionally, the goal of urban stormwater management is to remove the water from the area as quickly as possible through storm sewers and drainage channels. #WaterCycleStories

But climate change and more impervious urban surfaces (like roads and roofs) is causing more intense rainfall, which can’t drain quick enough, causing flooding.

Quickly moving water also can’t percolate down into the soil to hydrate vegetation or recharge groundwater, so urban watersheds lose twice – too much water during the storm, but it leaves too quickly to benefit the local ecosystem.
The USGS is testing newer stormwater management practices, like bioretention ponds and swales, which can reduce runoff, keep rainwater onsite for slow infiltration, and filter out contaminants.

⚡ Talk 4: Agriculture. About 60% of all the world’s freshwater withdrawals go towards agricultural uses like irrigation from streams or groundwater. #WaterCycleStories

The USGS studies agricultural water use and availability using satellite imagery – look for the tell-tale circles around a center-pivot irrigation system!

Water from irrigation and rainfall can also bind to fertilizers and chemicals, which seep into groundwater (especially through soils with coarse-grained deposits) or drain off into nearby streams and rivers.

After hearing all about Drippy’s journeys… it’s finally time to introduce the NEW #WaterCycleDiagram! 🎉🥳
The poster version is 38” x 26”. Also available in Spanish.

The 18-month redesign focused on 1) scientific accuracy, 2) design aesthetics, and 3) usability in educational settings.
Improved scientific accuracy: the new diagram accurately shows the major pools (where water is located) and fluxes (how water moves between pools), reflecting the best available hydrologic science.

It incorporates human impacts on water quantity, including how we use water (like irrigation withdrawals) and the timing of how water moves (like holding back water in a reservoir).

It also shows how humans affect water quality, either directly (like hot water discharges from a thermoelectric power plant) or indirectly (picking up contaminants as it runs over urban streets).

The water cycle isn’t one big cycle, but many smaller, nested water cycles that are active across the landscape. The new diagram shows multiple watershed types in a variety of environments. Each has its own pools and fluxes, connected by processes that occur at larger scales.
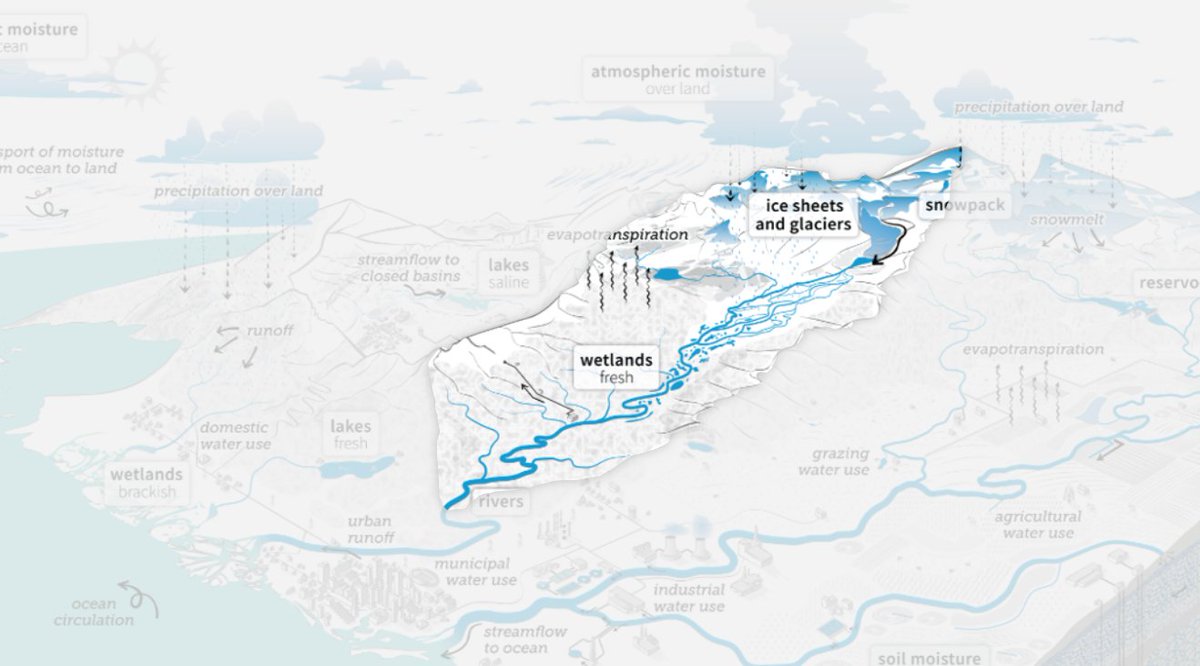
The new diagram includes pools and fluxes often left off other diagrams, including oceans, wetlands, permafrost, soil moisture, and especially groundwater (a large pool that’s hard to understand and visualize).

Groundwater is depicted by pore space and fractures, not an underground river, which is incorrect. We show that aquifers can be isolated (confined) or connected by porous rock or fractures, with or without pathways for recharge, and can be affected by human activity.

Improved design aesthetics: use of perspective, colors, labels, arrows, and visual hierarchy (how users focus their attention)
The new diagram was inspired by landscape architecture and stormwater diagrams that show water as the focal feature and show background details in grayscale.

The visual hierarchy of the new diagram is 1) water - using blue as the only color, 2) labels, 3) small, distributed arrows, and 4) the background landscape and inset cycle.

To make sure our new diagram would be usable, we talked to the people who use the USGS water cycle diagram the most – educators – throughout the design process.

You can access and download the new USGS #WaterCycleDiagram at: usgs.gov/water-cycle
We’d love to hear your thoughts about the new diagram! Connect with us by sharing your #WaterCycleStories on social media or email us at water-science-school@usgs.gov.

If you want to watch a recording of the release party, visit usgs.gov/watercyclestor… in a couple of weeks.
Thank you to our presenters this evening, and thank you for joining us to celebrate the release of the new #WaterCycleDiagram!
• • •
Missing some Tweet in this thread? You can try to
force a refresh


