
Gas- and electricity prices are dropping FAST in Europe right now and they are likely going to drop further!
What is going on? 💲🪔A thread 1/n
What is going on? 💲🪔A thread 1/n
Nat Gas prices have dropped from >300 EURs pr MWh to levels just north of 50 EURs and day ahead prices are even lower in many areas of Europe
2/n
2/n

Prices in Spain have dropped as low as 27 EURs pr MWh for Gas as there is currently a queue of ships waiting to off-load outside of Spanish LNG ports
3/n
3/n
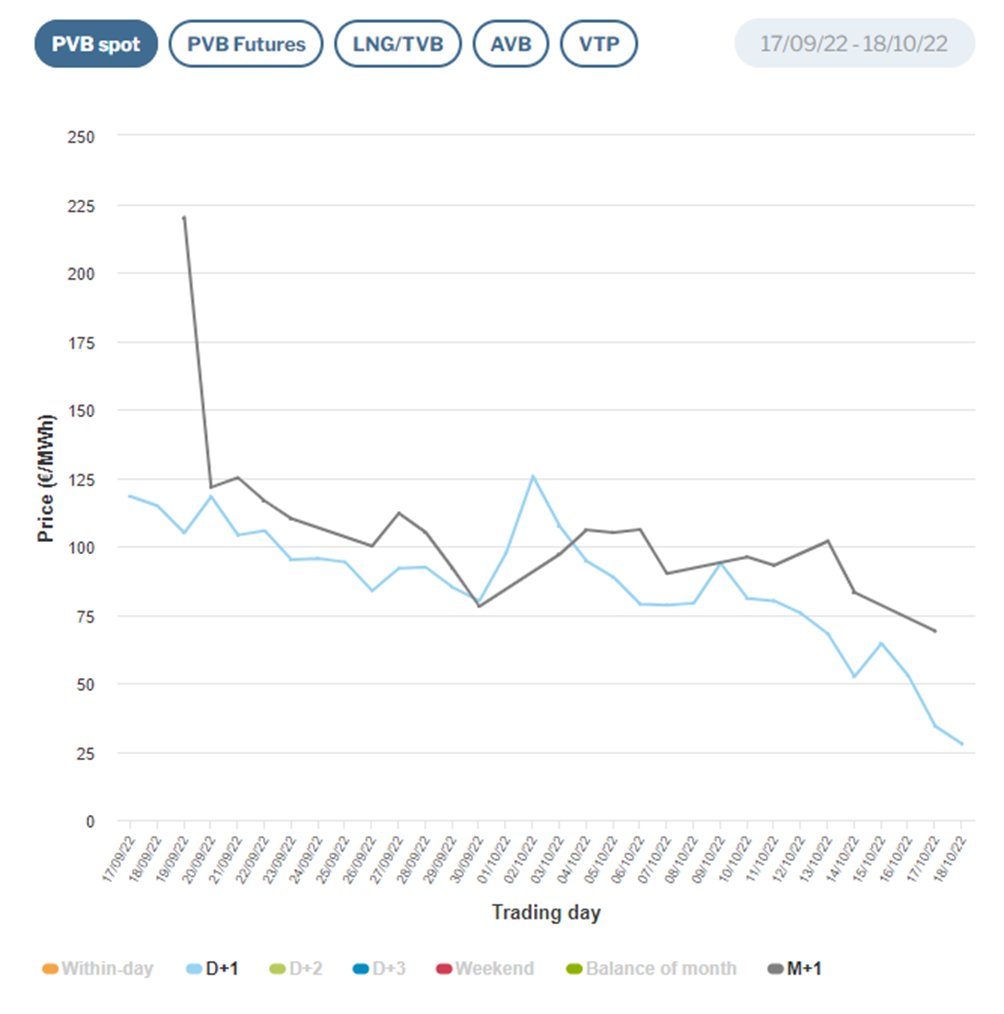
This has led LNG within day prices to trade sub 25 (below the PVB price) as LNG operators are trying to get more room for the LNG waiting off-shore
4/n
4/n

MIBGAS (Iberian market) daily spot PVB trades at 27.75 EUR pr MWh, but the curve is still fiercely sloping upwards in to November and December.
5/n
5/n
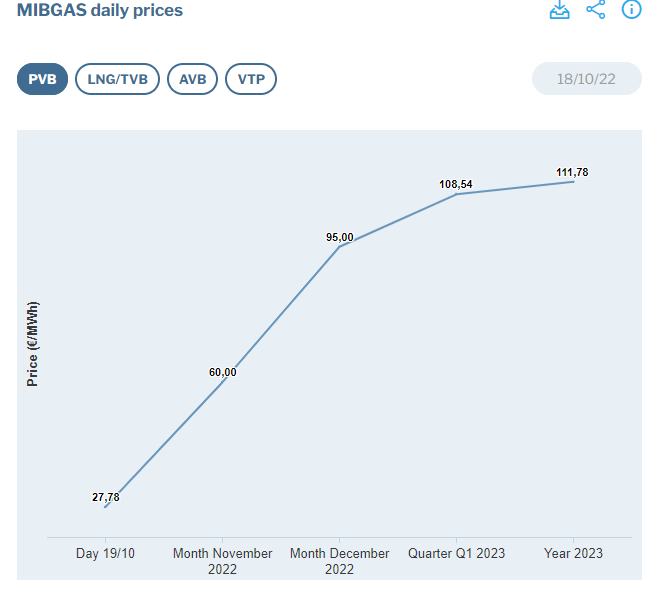
Interestingly, the curve has a positive beta to spot developments, so even if the price action is currently driven by a short-term over-supply, it brings the ENTIRE curve down with it, even if it seems irrational
The same holds for TTF benchmark gas in the Netherlands
6/n
The same holds for TTF benchmark gas in the Netherlands
6/n

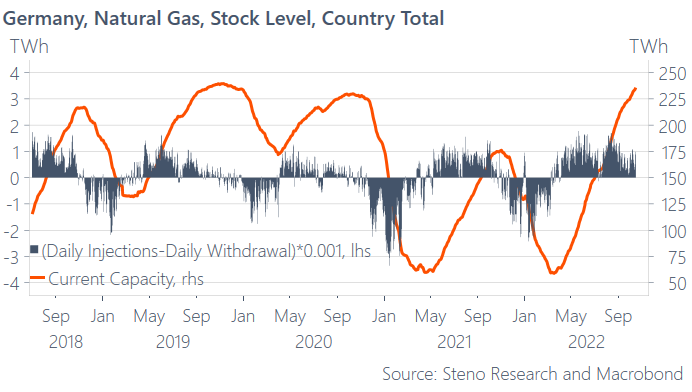
Fill levels in European gas storages are approaching 100% way ahead of the deadline 1st of November and paired with milder than usual weather, this leads to a very low net spot demand for Gas
7/n
7/n

Germany is for example still running large daily net injections into storage through mid-October as
1) The flow is decent
2) The temperatures are mild
and
3) The nat gas consumption among households and the industry is DOWN relative to 2021
8/n
1) The flow is decent
2) The temperatures are mild
and
3) The nat gas consumption among households and the industry is DOWN relative to 2021
8/n
There is hence very limited scarcity risks for October/November and the arrow points clearly DOWN for prices as a consequence. LNG ships are queing up and there is nowhere to place it..
9/n
9/n

This is likely going to bring the entire nat gas- and electricity curve DOWN in coming weeks at the very least until the heating season really kicks in through November..
The armageddon scenario is for now NOT worth talking about.. BUT...!
10/n
The armageddon scenario is for now NOT worth talking about.. BUT...!
10/n
The 2023 supply is much less certain! LNG makes up 40% of the current supply of gas in Europe, but we are still running 20-25% below usual flow levels due to the lack of Russian gas
The winter just ahead of us seems to be save, but in 23 we may be in for renewed turbulence
11/n
The winter just ahead of us seems to be save, but in 23 we may be in for renewed turbulence
11/n

If you want to follow my thoughts on European energy- and electricity markets, you can follow the free newsletter right here!
We will release a NEW update later today
12/n
andreassteno.substack.com
We will release a NEW update later today
12/n
andreassteno.substack.com
Here are my take-aways in the newsletter format - FREE right here
andreassteno.substack.com/p/steno-signal…
andreassteno.substack.com/p/steno-signal…
• • •
Missing some Tweet in this thread? You can try to
force a refresh


