Do you ❤️ hemodynamics? How about PV loops?
Here is Part I of our journey to to help YOU better understand PV loops and make them a little less daunting. Couldn't have done this without ⭐ @TJUHospital resident @jayamj94, and edits from @PSullivan000. Stay tuned for Part 2!
Here is Part I of our journey to to help YOU better understand PV loops and make them a little less daunting. Couldn't have done this without ⭐ @TJUHospital resident @jayamj94, and edits from @PSullivan000. Stay tuned for Part 2!
Part 1: The Basics
What is a pressure-volume (PV) loop?
A PV loop is a visual representation of the LV pressure (on the y-axis) and LV volume (on the x-axis) throughout a single cardiac cycle. (Great resource: cvphysiology.com/Cardiac%20Func…)
What is a pressure-volume (PV) loop?
A PV loop is a visual representation of the LV pressure (on the y-axis) and LV volume (on the x-axis) throughout a single cardiac cycle. (Great resource: cvphysiology.com/Cardiac%20Func…)
In addition to “typical” hemodynamics and volume measures, PV loops provide unique insights into ventricular function including the quantification of ventricular contractility, compliance, energetics, and dyssynchrony (slide from @BurkhoffMd's TEACH session; more on this to come)

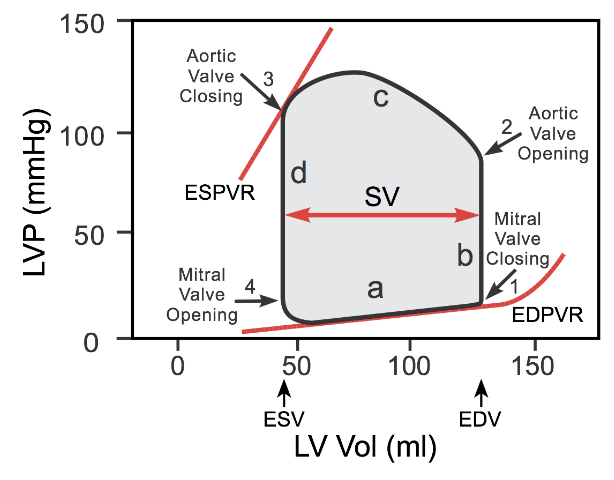
Plotting LV pressure versus LV volume throughout a cardiac cycle forms a loop that can be divided into four phases (a-d). Phases a and d encompass diastole while phases b and c encompass systole.
Diastole = relaxation + filling
Systole = contraction + ejection
Diastole = relaxation + filling
Systole = contraction + ejection

The left side of the loop is the LV end systolic volume and the right side is the LV end diastolic volume. The width of the loop (LVESV - LVEDV) is the stroke volume (SV). The area in the loop is the stroke work: the work the LV does during ejection.
Let's break down the phases:
Let's break down the phases:
Phase a:
- The mitral valve opens (bottom left) when the LV pressure is lower than the LA pressure.
- The mitral valve closes at the end.
- As the ventricle fills, the LV volume correspondingly increases along with a slight increase in LV pressure (EDPVR)
- The mitral valve opens (bottom left) when the LV pressure is lower than the LA pressure.
- The mitral valve closes at the end.
- As the ventricle fills, the LV volume correspondingly increases along with a slight increase in LV pressure (EDPVR)

The LV pressure versus volume curve during this phase is called the end-diastolic pressure-volume relationship (EDPVR). This EDPVR curve is generated by plotting multiple PV loops during a preload or afterload change and connecting their end diastolic points.
The slope of the EDPVR is an indicator of ventricular compliance. A more compliant ventricle will have lower pressures at higher volumes than a less compliant ventricle
The more complaint the ventricle the shallower the slope, whereas a stiff ventricle will have a steeper slope.
The more complaint the ventricle the shallower the slope, whereas a stiff ventricle will have a steeper slope.

Phase b:
- Starts with the closing of the mitral valve (bottom right) and ends with the opening of the aortic valve when the LV pressure exceeds the aortic diastolic pressure.
- This isovolumetric contraction initiates systole in the cardiac cycle.
- Starts with the closing of the mitral valve (bottom right) and ends with the opening of the aortic valve when the LV pressure exceeds the aortic diastolic pressure.
- This isovolumetric contraction initiates systole in the cardiac cycle.

The LV contracts during this phase, however, does not involve a change in volume (i.e iso-volumetric), there is only a change in pressure. This “squeezing” and subsequent pressure change causes the aortic valve to open and blood to be ejected in the next phase.
Phase c:
- Begins with the opening of the aortic valve (top right)
- Ends with the closing of the aortic valve (top left) when the LV pressure drops below the the aortic systolic pressure.
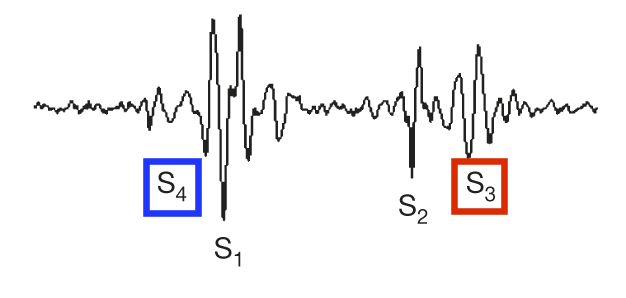
- This is when LV ejection occurs (i.e. when ejection murmurs are heard; between S1 and S2)
- Begins with the opening of the aortic valve (top right)
- Ends with the closing of the aortic valve (top left) when the LV pressure drops below the the aortic systolic pressure.
- This is when LV ejection occurs (i.e. when ejection murmurs are heard; between S1 and S2)

During LV ejection, the LV volume decreases [1] and LV pressure increases [2] until it reaches peak LV systolic pressure.

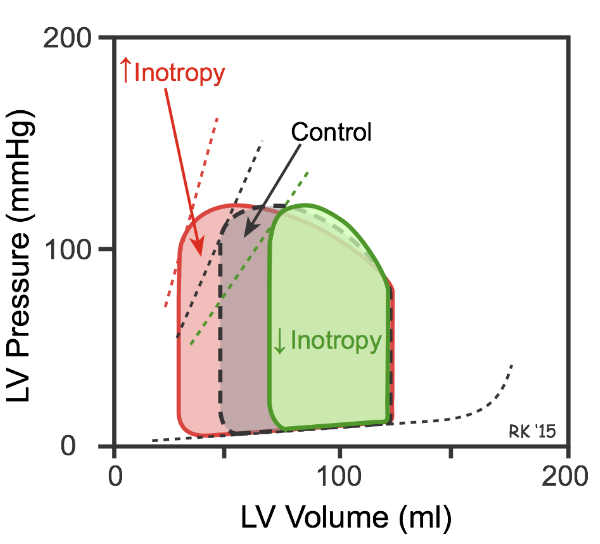
As the LV relaxes (blood is fully ejected), the aortic valve closes and pressure drops. The LV end systolic pressure that can be generated at a given inotropic state at a given LV end systolic volume is defined as the end-systolic pressure-volume relationship (ESPVR).
The ESPVR curve can be generated by occluding the IVC (gold standard) or having a patient Valsalva, thus decreasing preload. As the preload drops, the PV loop shifts down and to the left. Decrease in preload decreases end systolic pressure and SV, causing a narrowing of the loop.
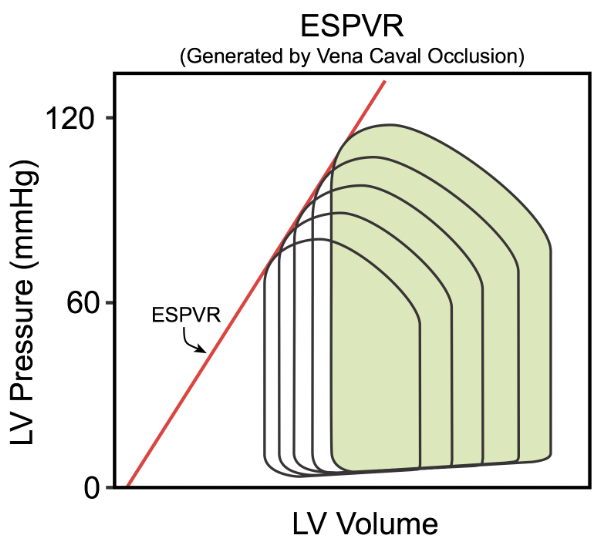
The curve created by plotting multiple PV loops during a preload or afterload change, connecting their end systolic points, is called the end-systolic pressure-volume relationship (ESPVR). The ESPVR slope is an indicator of contractility (⬆️ slope = more contractile ventricle).
Phase d:
- Begins with closing of the aortic valve (top left) and ends with opening of the mitral valve when the LA pressure exceeds the LV pressure.
- This phase represents isovolumetric relaxation (start of diastole), or relaxation of the LV without change in LV volume.
- Begins with closing of the aortic valve (top left) and ends with opening of the mitral valve when the LA pressure exceeds the LV pressure.
- This phase represents isovolumetric relaxation (start of diastole), or relaxation of the LV without change in LV volume.

We hope this intro to PV loops helps create a firm foundation for a more advanced understanding of hemodynamics and the cardiac cycle.
Stay tuned for Part II (and beyond) to learn about afterload/preload, ventricular dysfunction, valvular disorders and much more!
Stay tuned for Part II (and beyond) to learn about afterload/preload, ventricular dysfunction, valvular disorders and much more!
Tag your friends who also love hemodynamics/PV loops. We'll start with a few: @IRajapreyar @YevgeniyBr @PSullivan000 @rachkataria @vbluml @Abraham_Jacob @Babar_Basir @Brian_Houston12 @AndrewJSauer @BurkhoffMd @BrenerMickey @MarkBelkinMD @NirUrielMD and of course...@RyanTedfordMD.
PS: How many times will @RyanTedfordMD get tagged?!
• • •
Missing some Tweet in this thread? You can try to
force a refresh