A sudden MATERIAL oversupply of Gas in Europe.
Could prices go to 0? 🤯 A thread 1/n
Could prices go to 0? 🤯 A thread 1/n
Fill levels in European gas storages are above 90% and in the major re-gasificaiton hubs of France, Italy and Spain, storages are even closer to 100%
2/n
2/n

European countries "mail-ordered" massive amounts of Liquid Natural Gas after the European Comission asked countries to move ahead of the curve in June
But suddenly there is no where to place the gas arriving via the sea in France, Italy and Spain
3/n
But suddenly there is no where to place the gas arriving via the sea in France, Italy and Spain
3/n

Currently LNG trades with a discount to TTF and PVB as there is a load of LNG ships waiting to off-load..
The amount of LNG stored at ships is rising FAST (see chart) and unless the temperature drops around Europe, it will be tricky to off-load any time soon..
4/n
The amount of LNG stored at ships is rising FAST (see chart) and unless the temperature drops around Europe, it will be tricky to off-load any time soon..
4/n

The price of storing LNG at ships is also going bananas as operators hope that the net demand/supply balance will flip in 3-4 weeks from now when the heating season kicks in..
5/n
5/n

The issue is that there is an ongoing net injection in to storages still as the temperature level is above normal and with fill levels approaching 100% around Europe, the issue of LNG oversupply is likely going to intensify in the coming 2-3 weeks.
6/n
6/n

The weather forecast for 1 Nov still points to >15 degrees celsius across the European continent way above usual averages, which hints that the over-supply will continue another week or two at least
7/n
7/n

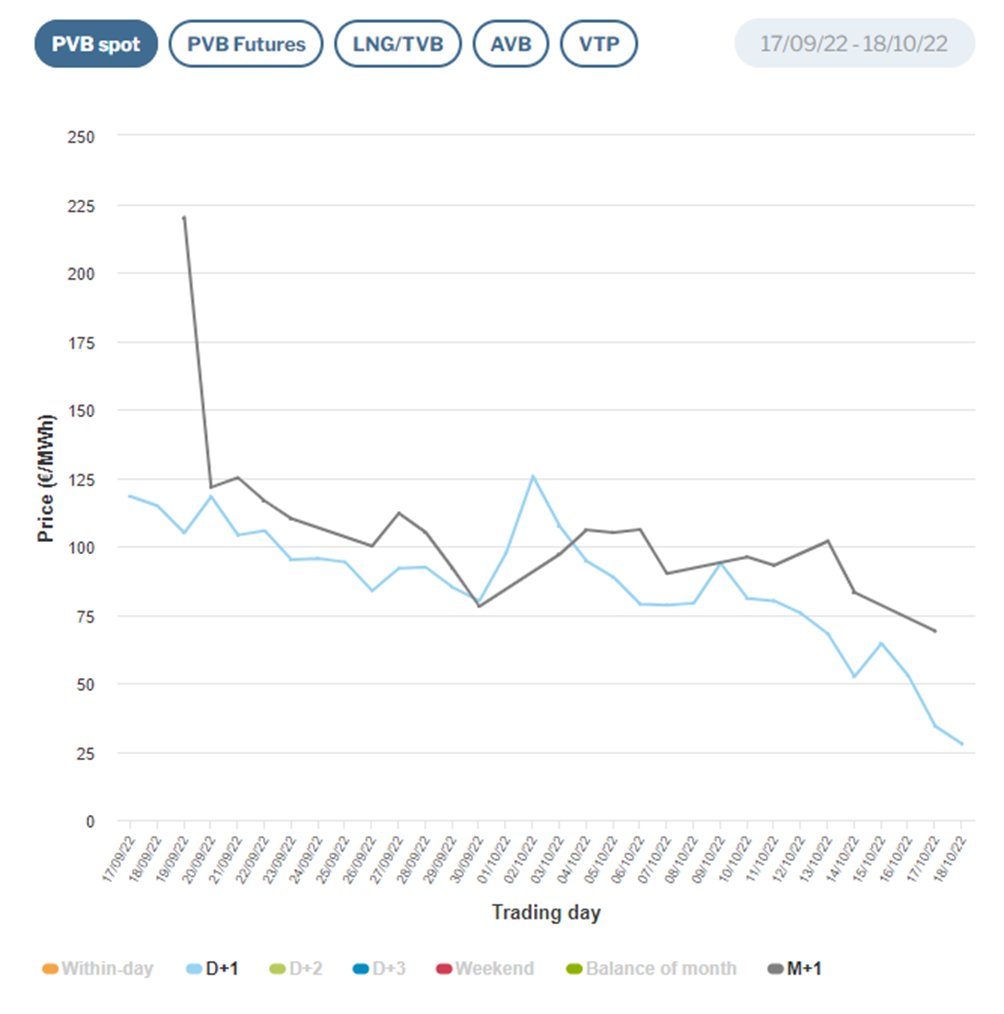
As commodity markets need to discount prices based on physical constraints, the front-end (1st position in orange) drives the price action across the curve..
An over-supply short-term is going to drag the whole curve lower!
8/n
An over-supply short-term is going to drag the whole curve lower!
8/n

Bottom-line:
1) Storages are close to being filled 100%
2) Prices to store LNG at ships is sky-rocketting
3) The weather forecast remains mild
Don't rule out prices close to 0 soon
9/n
1) Storages are close to being filled 100%
2) Prices to store LNG at ships is sky-rocketting
3) The weather forecast remains mild
Don't rule out prices close to 0 soon
9/n
You can follow my updates for FREE on a running basis right here.
Best wishes for the week from Andreas
10/n
andreassteno.substack.com
Best wishes for the week from Andreas
10/n
andreassteno.substack.com
I will interview @BurggrabenH on European Energy later today at @RealVision .. Let us know if you have any questions that you would like us to address
Alexander Stahel is one of the best at assessing the numbers behind the supply/demand balance in Europe. Stay tuned
11/n
Alexander Stahel is one of the best at assessing the numbers behind the supply/demand balance in Europe. Stay tuned
11/n
Before all the doomsters lose their temper. I am WELL aware that this is a short-term story
Or negative, oooops

• • •
Missing some Tweet in this thread? You can try to
force a refresh