Up now on the @employamerica blog:
Framework Update: Strong Enough Income Growth To Justify Hikes, But Slowing Enough For The Fed To Plan Off-Ramps
Q3 ECI and CPS suggest strong (above "floor") but decelerating gross labor income growth (jobs & wages)
employamerica.org/blog/framework…
Framework Update: Strong Enough Income Growth To Justify Hikes, But Slowing Enough For The Fed To Plan Off-Ramps
Q3 ECI and CPS suggest strong (above "floor") but decelerating gross labor income growth (jobs & wages)
employamerica.org/blog/framework…
https://twitter.com/IrvingSwisher/status/1553027961993019396


Full 🧵 forthcoming tomorrow morning.
The necessary and sufficient conditions for Fed tightening within our 2019 #FloorGLI framework remain satisfied, but the goals shouldn’t be to increase unemployment and the case for rapid 75bp rate hikes is diminishing…
The necessary and sufficient conditions for Fed tightening within our 2019 #FloorGLI framework remain satisfied, but the goals shouldn’t be to increase unemployment and the case for rapid 75bp rate hikes is diminishing…
In May 2019, we released our Fed framework. Prioritizes a robust trajectory for gross labor income (GLI) (job growth & wage growth).
If expecting GLI to fall short of "floor" growth trajectory. ease.
If expecting above floor & inflation > target, tighten
employamerica.org/researchreport…
If expecting GLI to fall short of "floor" growth trajectory. ease.
If expecting above floor & inflation > target, tighten
employamerica.org/researchreport…
In January 2020, we offered a more operational revision to the framework. National accounts measures of labor income are heavily revised; suboptimal for real-time policymaking. CPS employment and Employment Cost Index are better suited (no revision issues)
medium.com/@skanda_97974/…
medium.com/@skanda_97974/…
Threshold for revising/deviating from any pre-specified framework should be high; no strong reason to do so here.
Income growth remains strong, and inflation pressures remain. Given that, Fed is justified (within limits) to tighten financial cond'ns for sake of lower inflation
Income growth remains strong, and inflation pressures remain. Given that, Fed is justified (within limits) to tighten financial cond'ns for sake of lower inflation

Moreover, labor income levels already "caught up" to the pre-pandemic "floor" in 2022Q1 itself.
We specified in 2019 that if the Fed was constrained from conventional easing (@ Zero Lower Bound) & incomes were falling short of "floor", condition liftoff on catch-up
We specified in 2019 that if the Fed was constrained from conventional easing (@ Zero Lower Bound) & incomes were falling short of "floor", condition liftoff on catch-up


Where we most firmly depart from Fed is on their perverse 'optimal policy' projections: Engineering recessionary unemployment increases involve more persistent economic damage.
GLI growth (job growth & wage growth) can slow w/o resorting to sharply higher unemployment rates
GLI growth (job growth & wage growth) can slow w/o resorting to sharply higher unemployment rates


We noted this point in our piece "Beyond The Phillips Curve":
Declining labor utilization rates tend to predict *further declines.*
The exceptions to this rule of thumb tend to involve policy interventions to actively stabilize employment
employamerica.org/researchreport…
Declining labor utilization rates tend to predict *further declines.*
The exceptions to this rule of thumb tend to involve policy interventions to actively stabilize employment
employamerica.org/researchreport…
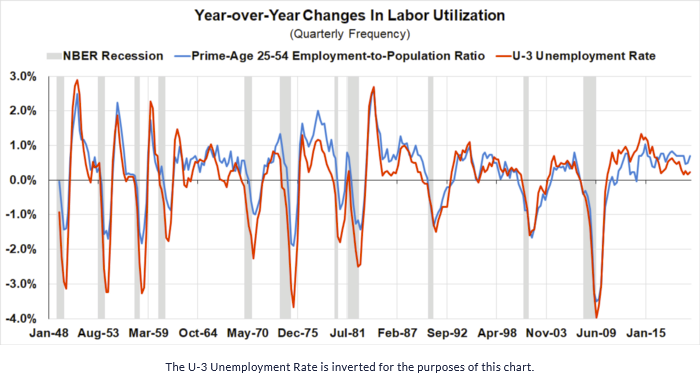

The persistence of labor utilization declines is also not the kind of easily reversible phenomenon that textbook might suggest. Prime-age male employment systematically fails to recover from recessionary declines (while surging inflation can revert w/o recessions)


At tomorrow's Fed meeting, it is all but given that the Fed will be hiking 75bps. While the direction of tightening can be justified under current macroeconomic conditions, the case for such rapid tightening is diminishing.
Rate hikes are not a neatly linear policy tool
Rate hikes are not a neatly linear policy tool


Two countervailing dynamics that raise uncertainty around "how much much more to tighten" (and elude "r-star" models):
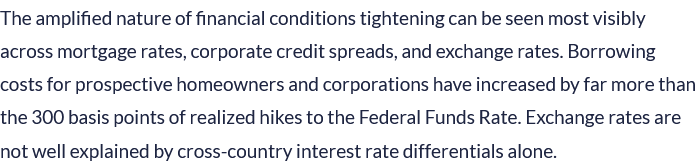
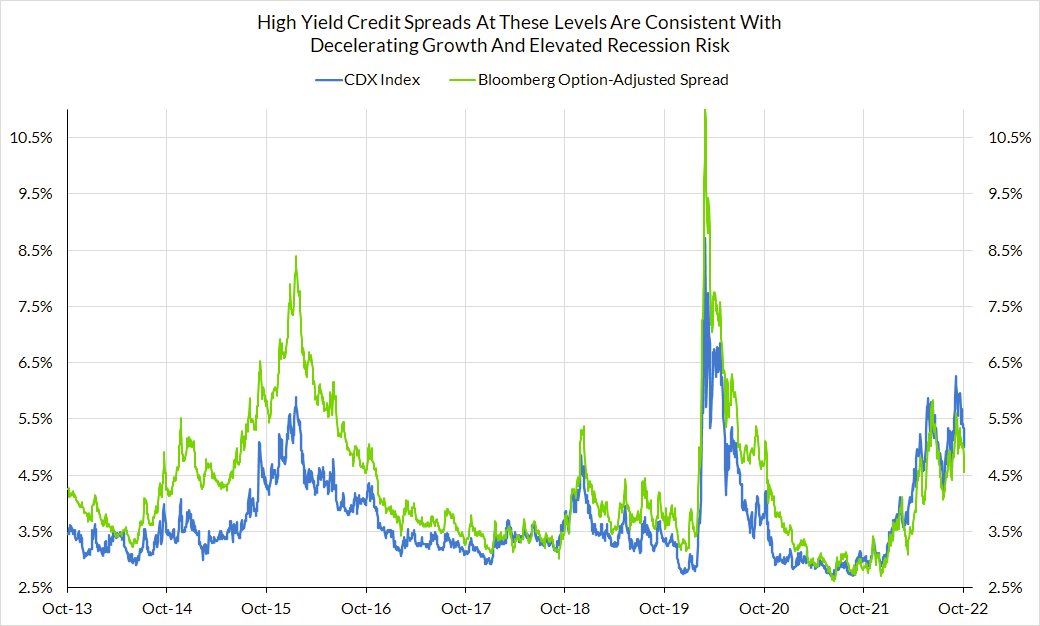
1. Financial conditions tightening >>> Fed hikes
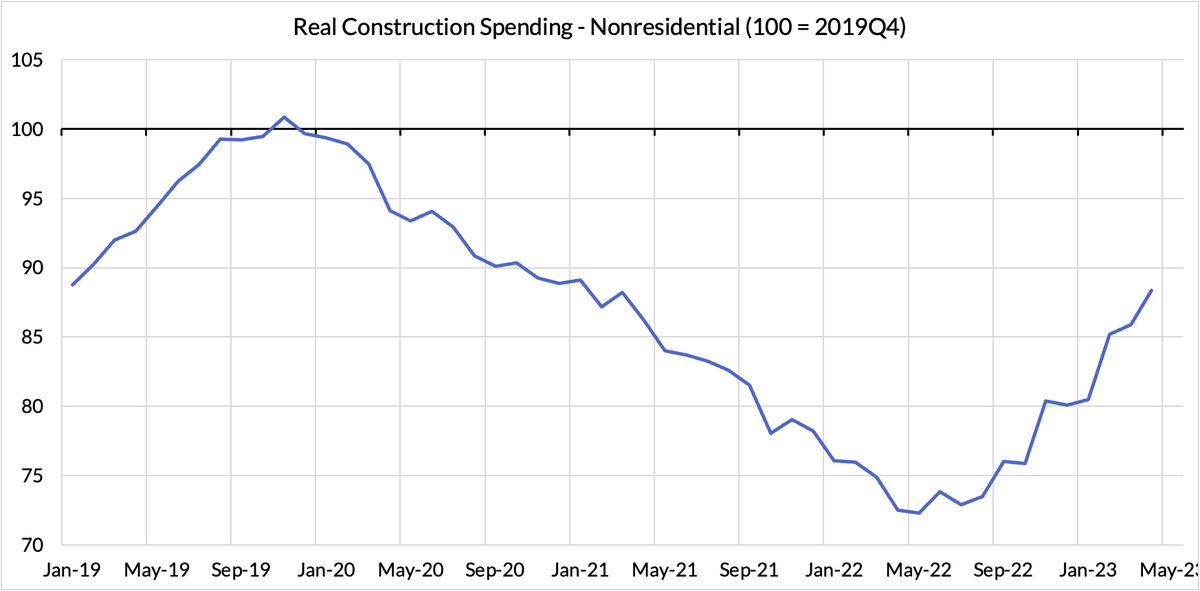
2. Real economy ex-housing is showing less sensitivity to rate hikes
#2 could just be a f'n of longer lag
1. Financial conditions tightening >>> Fed hikes
2. Real economy ex-housing is showing less sensitivity to rate hikes
#2 could just be a f'n of longer lag


Our preferred framework endorses a "change rule" approach to setting rates; celebrated r-star estimates are heavily backward-looking.
Better to take it meeting by meeting, see how macro cond'ns evolve, and support acceleration/deceleration accordingly
Better to take it meeting by meeting, see how macro cond'ns evolve, and support acceleration/deceleration accordingly
The macro conditions tell us that we're still seeing an outlook for strong income growth along with high inflation. But also, income growth is more clearly decelerating, both in terms of job growth and wage growth (likely for its own reasons, not b/c Fed)
employamerica.org/blog/the-next-…
employamerica.org/blog/the-next-…
Having won back the key jobs lost to the pandemic (e.g. see chart), the case for slowing labor income growth from elevated rates is not as costly now. But given that deceleration is underway, financial conditions tightening so much already, & l/r costs of overtightening high...


the case is strengthening for taking it slower on its tightening efforts.
This wouldn't foreclose where it might ultimately take its policy rate, but @ current pace, Fed isnt giving itself much time to evaluate economic effects from realized financial conditions tightening /END
This wouldn't foreclose where it might ultimately take its policy rate, but @ current pace, Fed isnt giving itself much time to evaluate economic effects from realized financial conditions tightening /END
• • •
Missing some Tweet in this thread? You can try to
force a refresh