
For a long time I've been thinking that using a closed loop (sync) for measuring latency is wrong 

It's affected by the coordinated omission problem: imagine that all but one do_action executions take 1ms and the bad one takes one minute. If we look at p99.(9) we won't notice a problem and assume that everything is fine while the rogue request may block the system.
The "right" way out is to break the loop (async) and to issue the requests at the fixed rate (load). With this approach the rogue requests won't block the control flow and we notice the degradation

But things are not black and white. For example, it's hard to use that to determine the throughput of the system:
- if the load is below the throughput it's below by the definition :)
- if it's above then the system chocks and the latency skyrockets
- if the load is below the throughput it's below by the definition :)
- if it's above then the system chocks and the latency skyrockets
While with the sync approach it's pretty simple to see the max throughput but first let's address the coordinated omission problem. First we chart the reported data
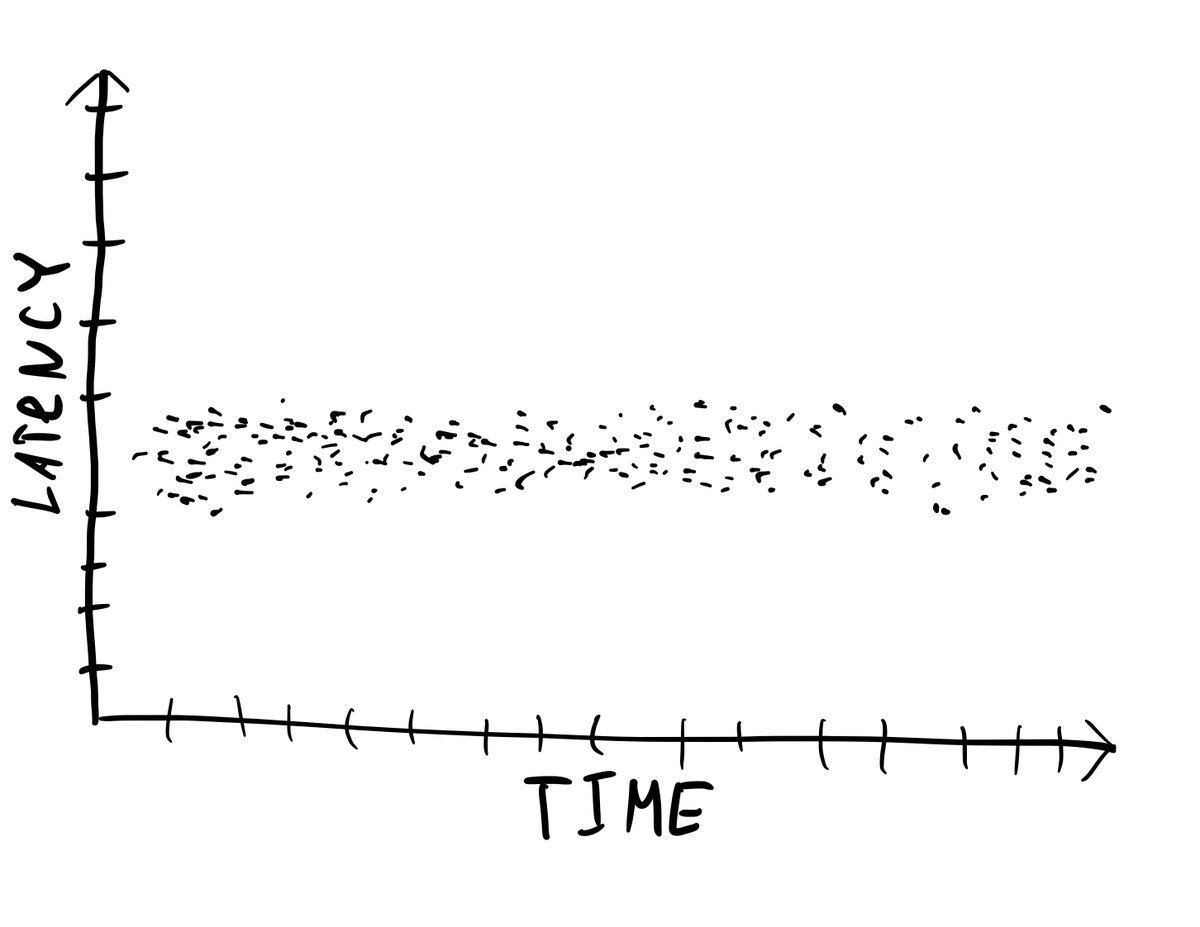
Then we break the time into buckets and measure the number of operations per ms per bucket


When a rogue request takes a lot of time it will be visible as the throughput drop. Not only per bucket but as full (when we sum all ops and divide by the duration of the experiment) throughput too if the pause is big enough

Ok, but still how to measure the true throughput of a system? We repeat the experiments multiple times and each time we increase the number of parallel sync clients.
Then when we plot full throughput and latency (p50, p99, it doesn't matter) from the number of then clients and we get the following chart

What's cool about the chart is that it always has that shape. When the system reaches the saturation point the throughput converges to the max throughput and the latency starts to grow linearly.
The magic of the sync client is the natural feedback loop so instead of choking the system like the async way does, the sync load adjusts to the system capacity and we get a clear picture.
For example this is an actual chart of the Redpanda's transactional performance. We see that the max tps throughput (for the cluster I used) is 10k distributed transactions per sec

• • •
Missing some Tweet in this thread? You can try to
force a refresh


