How much will it cost for the world to transition coal? That’s the trillion dollar question. At the @IEA, we did a detailed assessment of every coal plant in the world, and all the coal used in industry, to make some estimates. Let’s ‘dig’ in...
The total investment needed in clean energy to displace coal? $380 billion per year, globally, from now until 2030. That is around 20% of all clean energy spending in our Announced Pledges Scenario, which gets the world to 1.7°C by 2100.
$380 billion to transition away from coal isn't much. It's less than the GDP of Austria. It’s 0.4% of global GDP.
Coal is very dirty, and solutions to displace it are pretty cheap: think wind and solar, mainly (at least for this decade).
But sun and wind isn't the only thing. You also need strong grids and lots of batteries, hydrogen to displace coal in heavy industry, CCUS, electrifying end uses, and you need to be super efficient. In industry - a tough nut to crack - lots of this is in the demo/prototype phase.
In power, things are easier. In fact, total system costs in the power sector are no higher with less coal on the system. Means the transition is eminently affordable after you’ve made all that upfront investment.
So what stands in the way? A few things: there are inflexible long-term power purchase agreements, which means coal plant owners get their pay day even if it’s cheaper to generate with renewables.
There is also a whopping $1 trillion of capital sunk into coal plants that is yet to be recovered. That kind of money is bound to keep a lot of players invested in their continued operation.
But many initiatives under way to restrict financing for new coal, and to find creative solutions to power down the existing stock. International support is key: e.g. the Just Energy Transition Partnership (JETP), an excellent example of public and private capital coming together
In our own assessment, we found that reducing plant owner’s cost of capital by 4% paves the way for a retirement of 1/3 of the global coal fleet within ten years. That would be very well aligned with climate goals.
So to recap – the coal transition is affordable, and the challenges aren’t insurmountable. And if we operate the world’s coal assets as they have been in the past, we’ll sail past the 1.5° budget. That will cost the world much more... not just in dollars.
Is natural gas demand about to peak? This year’s @IEA World Energy Outlook helps shed light on this important question. A quick thread:
Ultimately, if you believe in gas as a transition fuel, you have to accept that it’s not a volume play: you don’t need a lot of gas to back up renewables if they grow at the level implied by today’s policy settings.
A case in point is Europe. The continent is rapidly adding renewables, pushing gas into a standby role in most power systems. See below its contribution over the course of a year, today and in 2035. Still important, but less volume required.
Our new @IEA report finds that that clean energy transitions are cheaper than the path we are currently on. How could this be? Surely sticking with fossil fuels is cheaper than buying fancy new kit like EVs and heat pumps…right? Nope. Let’s get into it.
Exhibit A is that clean energy technology costs have come down massively over the past several years (even if there was a period of post-pandemic cost inflation).
In fact, on a lifetime cost basis, clean energy is already the cheapest option for millions of consumers around the world. There are of course still areas where costs are higher (like hydrogen or industrial decarb). But the main ingredients for a transition are cost effective:
Can the oil and gas industry play a constructive role in transitions? This is one of the burning questions for the climate. Today, the @IEA released a massive new report on the subject. Let’s dive in for a quick one, shall we?
If you’re an oil and gas company, how do you play a part in transitions, especially now that a peak in fossil fuels is visible before 2030? How do you plan for a scenario reaching net zero where, for every dollar invested in fossil fuels, 10 dollars gets invested in clean energy?
Essentially, you have 2 choices: the first is to disappear. This means winding down operations, not investing in new fields, returning cash to shareholders, and cutting scope 1+2 emissions on your way out. Not selling your assets to a company with low ESG standards would be ideal
Lots of reactions to the #IEA World Energy Outlook 2023 finding that fossil fuels reach a peak based on today’s policy settings (the ‘STEPS’ scenario). Worth digging in a bit as to what a peak actually means (and doesn’t). Thread.
If you want to dismiss the idea of a peak in fossil fuels, you’d point to the strong historical relationship between GDP and fossil fuels. But this relationship is already changing and, in all our scenarios, it is transformed by the emergence of a clean energy economy.
The energy system is a slow ship to turn. But we are at an inflection point. Early indicators of a peak are visible by tracking flows, not stocks. For example, sales of ICE cars peaked in 2017. The high point for gas and coal power plant capacity additions was in 2002 and 2012.
Not many people realise that 15% of energy-related GHG emissions come from the process of getting oil and gas out of the ground and transported to consumers. If those emissions were a country, they would be the second largest emitter, after China. How do we reduce them?🧵
Today, the @IEA released a report about these ‘scope 1+2’ emissions, drawing together a body of work many years in the making. The headline message: these emissions can and should drop by more than half by 2030, and it’s one of the cheapest ways of cleaning up the energy system.
We looked at every oil and gas field in the world and calculated its emissions intensity – how much CO2 and methane comes with getting each barrel or cubic metre to consumers. There is a huge range between the ‘best’ and ‘worst’ performing supply chains, mostly due to methane.
EU natural gas demand fell by 55 bcm in 2022, the largest reduction in its history (equivalent to gas use in >40 million homes). There’s been a lot of debate what the main drivers were, and so today the @IEA released a commentary exploring how all this happened. Quick thread.
There was quite a lot of variation between sectors and countries. Germany cut the most gas in absolute terms, but in percentage terms it was the Baltic and Nordic countries.
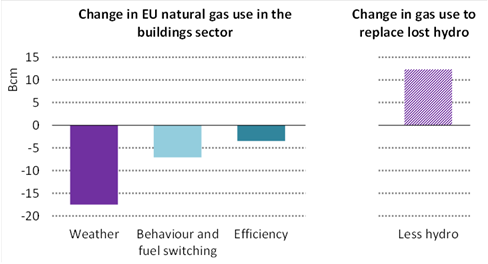
Many think the EU lucked out with weather. And yes, the EU was lucky in some respects, but not in others. A mild winter cut gas use in buildings by over 10% compared to 2021. But drought conditions lowered hydro power generation, meaning 12 bcm of gas needed to fill the gap.