Plenty of interesting moves in the bond market.
Let's have a look together.
A thread.
1/
Let's have a look together.
A thread.
1/
Bond markets can be often complicated, and therefore they tend to be oversimplified.
''Hey look, 10y Treasury yields are up!''
There are many more dimensions to fixed income markets, and they all carry a lot of informational value.
To break them down, I will use...
2/
''Hey look, 10y Treasury yields are up!''
There are many more dimensions to fixed income markets, and they all carry a lot of informational value.
To break them down, I will use...
2/
...the US Rates section of my Volatility-Adjusted Market Dashboard (VAMD).
In the picture below, I focused on the rolling 30-days move across many segments of the US fixed income market.
One of the most important feature of the VAMD is its color-coding mechanism.
3/
In the picture below, I focused on the rolling 30-days move across many segments of the US fixed income market.
One of the most important feature of the VAMD is its color-coding mechanism.
3/

The VAMD color-codes market moves based on their magnitude: the darker the color, the bigger the move in standard deviation terms and hence the more interesting market action to focus on.
The question therefore is: where are the darkest colors popping up?
3 main areas.
4/
The question therefore is: where are the darkest colors popping up?
3 main areas.
4/
1) Implied Fed Funds (Forward OIS)
2) Implied volatility
3) Curve slopes
Let's start from Implied Fed Funds.
You can find these in the ''Forward OIS Rates'' section of the VAMD.
5/
2) Implied volatility
3) Curve slopes
Let's start from Implied Fed Funds.
You can find these in the ''Forward OIS Rates'' section of the VAMD.
5/

The bond market is getting around this idea that the Fed won't massively pivot, but it will instead apply a very long pause.
Market-implied Fed Funds are now seen peaking at 4.9% in 6 months and than to stay in the 4-4.5% range between Q2-23 and Q1-24.
6/
Market-implied Fed Funds are now seen peaking at 4.9% in 6 months and than to stay in the 4-4.5% range between Q2-23 and Q1-24.
6/
Only after that, the Fed is priced to cut rates to 3-3.5% and stay there for years to come.
In 2001, the Fed cut rates from 6.5% to 1.5% in a few quarters.
That's a pivot.
What the bond market is pricing now is a long pause at tight levels.
7/
In 2001, the Fed cut rates from 6.5% to 1.5% in a few quarters.
That's a pivot.
What the bond market is pricing now is a long pause at tight levels.
7/

This ''long pause'' is also reflected in implied volatility: if the Fed isn't gonna be volatile in their decision making, 1y-ahead volatility in the short-end of the curve can be also repriced down.
Look at the vol section of the VAMD...
8/
Look at the vol section of the VAMD...
8/
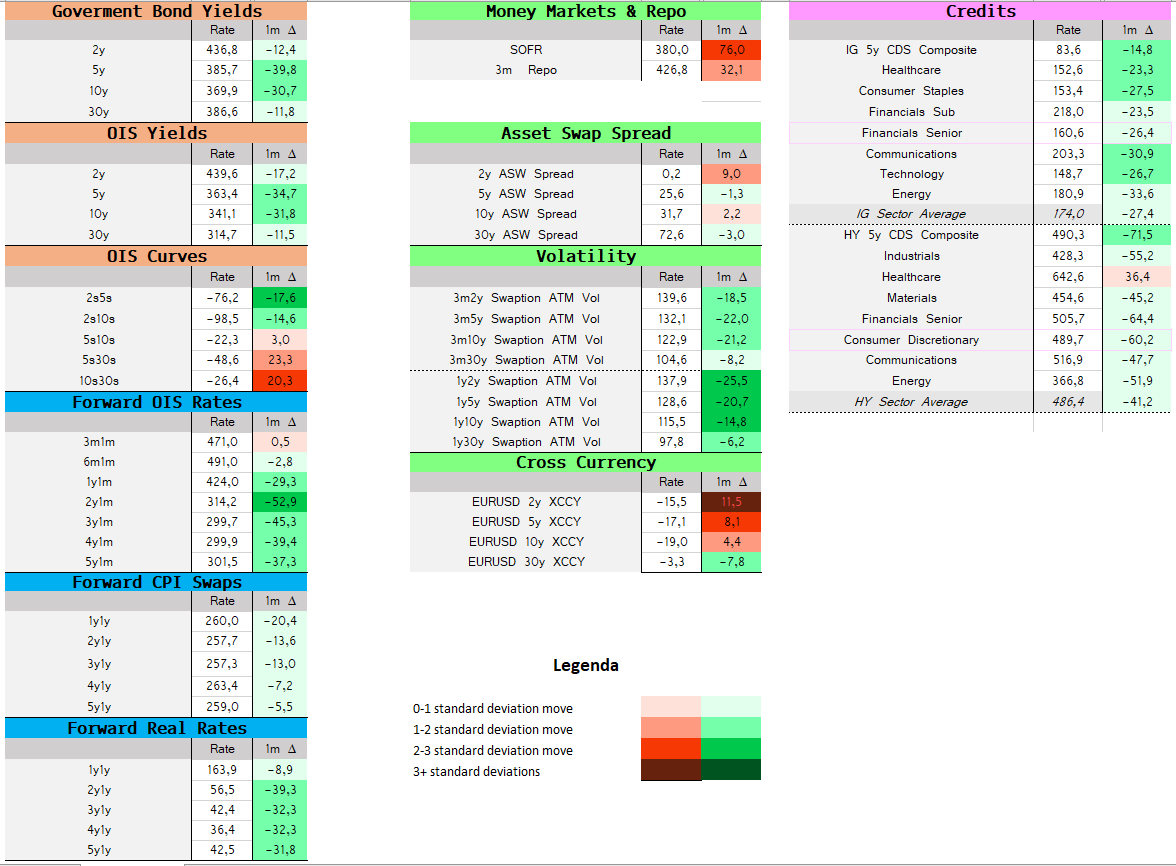
...and notice how the implied vol of a 1y expiry option on 2y rates has dropped by 25 bps in a single month.
That's a 2+ standard deviation move.
The Fed is priced to lower their volatility around monetary policy in 2023, and when that happens...
9/
That's a 2+ standard deviation move.
The Fed is priced to lower their volatility around monetary policy in 2023, and when that happens...
9/
...investors can be marginally more aggressive in taking risk exposure as the bond market behaves better and it reduces some of the explosive volatility it brought to their portfolios in 2023.
SPX in blue
Bond vol (inverted) in orange
Bond vol down = SPX up, and viceversa
10/
SPX in blue
Bond vol (inverted) in orange
Bond vol down = SPX up, and viceversa
10/

Such a move lower in bond volatility also helps explaining the recent compression in credit spreads and rally in equities.
Finally, if the Fed is seen to pause soon and pause for a while the yield curve can behave funnily.
And it did.
11/
Finally, if the Fed is seen to pause soon and pause for a while the yield curve can behave funnily.
And it did.
11/
The yield cuve:
- Aggressively flattened in the 2s5s segment
- Aggressively steepened in the 5s30 and 10s30s area
That's really interesting, and it revolves around the very strong idea bond markets have developed about a ''long Fed pause'' rather than a super sharp pivot.
12/
- Aggressively flattened in the 2s5s segment
- Aggressively steepened in the 5s30 and 10s30s area
That's really interesting, and it revolves around the very strong idea bond markets have developed about a ''long Fed pause'' rather than a super sharp pivot.
12/
If the economy is slowing down but Powell keeps insisting on setting monetary policy looking in the rearview mirror, he is going to pin 2y yields high for a while and nobody can fight that.
But 5y yields will start reflecting some weakness, hence 2s5s flattens.
13/
But 5y yields will start reflecting some weakness, hence 2s5s flattens.
13/
But at the same time if the Fed is seen to pause soon and pause for a while the yield curve can steepen a bit - under the assumption the economy won't fall of a cliff, a less aggressive Fed in 2023-2024 might coincide with slightly higher nominal growth...
14/
14/
...which gets reflected in a steeper yield curve especially in the long-end: 5s30s can steepen a bit under this assumption
Looking at the big picture though, 2s10s are more inverted than in '00 and could be heading to Volcker-era inversion levels if the Fed doesn't back off
15/
Looking at the big picture though, 2s10s are more inverted than in '00 and could be heading to Volcker-era inversion levels if the Fed doesn't back off
15/

A lot has gone on in the bond market over the last month, and often it happens under the hood.
Most of these data is only accessible to pro investors that know where to look and how to decompose complex data, but we at The Macro Compass will fix this for you.
16/
Most of these data is only accessible to pro investors that know where to look and how to decompose complex data, but we at The Macro Compass will fix this for you.
16/

The Volatility-Adjusted Market Dashboard (VAMD) will be one of the macro tools we will offer: it will cover all asset classes in the world and be very interactive to use.
Effectively, you will access an interactive environment where you can cut through the noise...
17/
Effectively, you will access an interactive environment where you can cut through the noise...
17/
...connect the cross-asset macro dots and assess investment opportunities exactly like the pros do.
The good news is that it isn't going to cost you $30,000/year like a Bloomie terminal, and our offer will also include macro reports, portfolios, trade ideas and so on.
18/
The good news is that it isn't going to cost you $30,000/year like a Bloomie terminal, and our offer will also include macro reports, portfolios, trade ideas and so on.
18/
In case you are interested, if you subscribe to one of our tiers before Nov 30 you get some pretty hefty discounts - feel free to have a look here!
👇
themacrocompass.substack.com/about
19/19
👇
themacrocompass.substack.com/about
19/19
• • •
Missing some Tweet in this thread? You can try to
force a refresh