Here's a summary of the Taibbi thread for those who don't want to wade through it:
- Both Dems and GOPs asked twitter to delete certain tweets, and twitter sometimes obliged.
- Taibbi says that the deletions weren't balanced, but offers no evidence of that claim, he just points out that a lot of people who work at Twitter donate to Dems.
- Twitter was worried about being used to distribute hacked info without info on veracity or source, so they removed this content out of an abundance of caution. This made some people angry.
That's it so far, after something like 40 tweets.
• • •
Missing some Tweet in this thread? You can try to
force a refresh
TargetEarly for the GA runoff is now live. As I said earlier this week, I won't be offering much analysis of the early vote this week due to the lack of valid reference points, but I'll share toplines of what you'll find in the data, and what caveats you should consider.
The big caveat is that the voting period for this runoff is shorter than that for the general, and we will see far fewer votes cast by mail in this election. On top of that, the early in person voting didn't start on the same day in every county, with metro ATL starting earlier.
Caveats in mind, here is what we know: over 800k votes have been cast. Those votes are far more Dem than the EV was 6 days out in the general - modeled at +21D as compared to +7D. BUT, total turnout is only at 43% of 6 day out turnout in the general.
According to @CookPolitical, the GOP lead in the national House vote is down to 3.1%. If you don't include uncontested races, the lead is 1.3%. Which is about what you would expect with GOPs likely to end up with a majority of about 9 seats.
There's been this weird narrative that emerged in the first day or two after the election that has been quite sticky. It goes something like this: Dem turnout was bad, the electorate was skewed heavily GOP (+4 or +5), but Dems over performed due to persuasion.
In reality, Dem turnout was pretty darn good, and the result (roughly 9 seat GOP House majority, draw to +1D Senate) was about what you would expect given the turnout.
We need to be careful to not get ahead of ourselves on this "Dems stayed home in this election" narrative. We are likely to find a widely varied landscape in partisan turnout and these claims are generally based on a comparison to one of the best Dem turnout midterms, ever ('18).
In the 3 party registration states where we have complete, or close to complete vote history, a different picture emerges. One where Dem turnout was actually quite good, and likely among the best performances for a midterm with a Dem in the White House.
If you look at these 3 states (CO, NV, OR) you'll see that registered Dems had a turnout share that generally looks more like '18 and '20 than '14. That's an impressive performance.
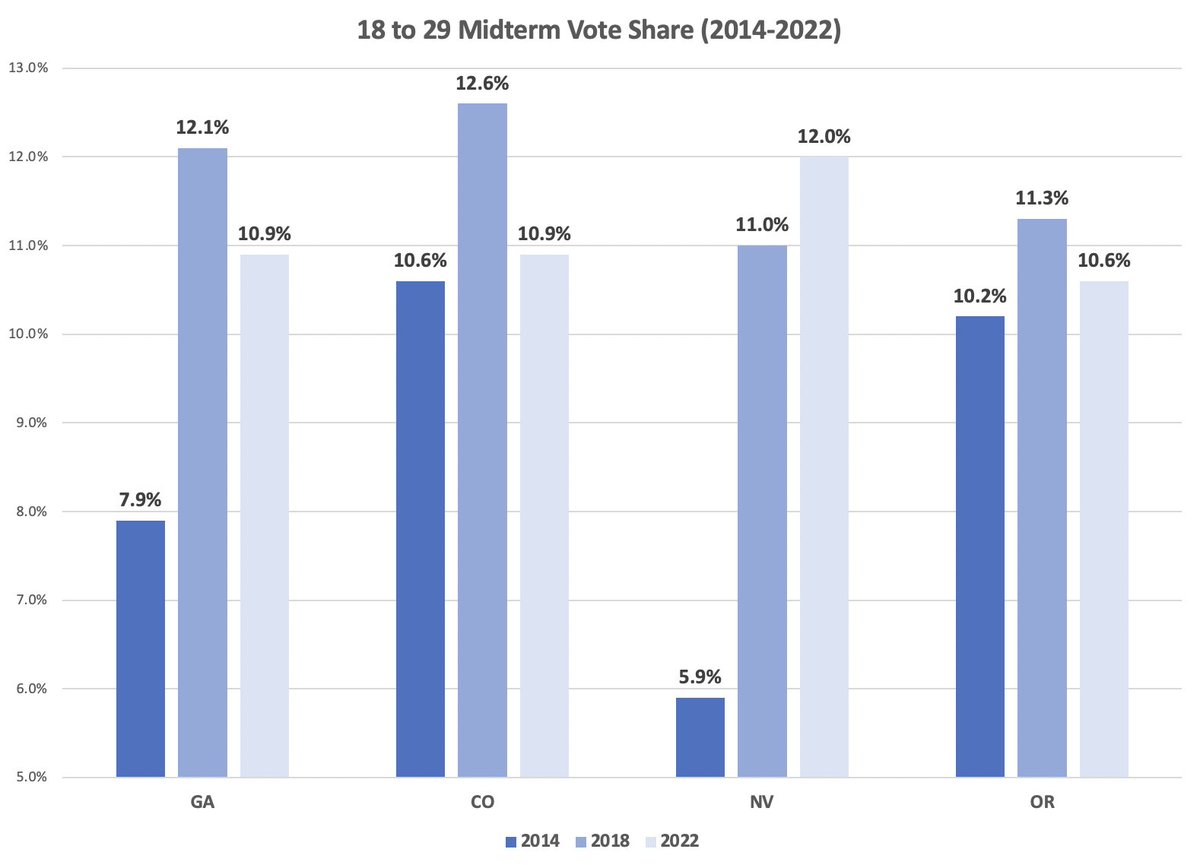
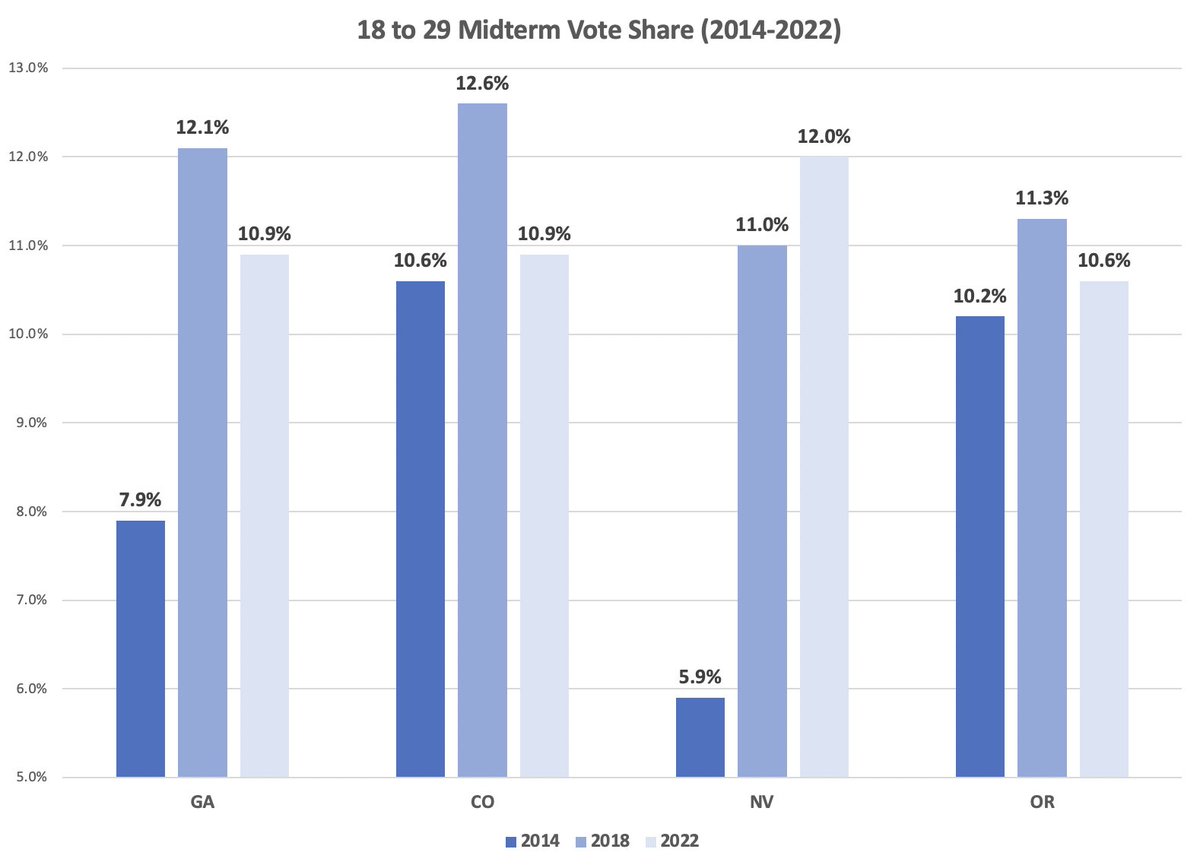
Here's a catchup on what we know about the youth vote so far. We have complete, or close to complete vote history in 4 states: CO, GA, NV, OR. This chart shows the share of ballots cast for voters under 30 by state, for the past 3 midterm elections.
When comparing to '14/'18, context is important. '14 was one of the lowest turnout elections for young voters, and '18 was incredibly high, producing a blue wave result (chart credit @dellavolpe)
Back to this chart again. You can see that the youth share exceed '14 in all 4 states. It exceeded '14 in NV. In GA it came very close to '18, and was well over '14. In CO and OR the youth vote was closer to '14 than '18.
The graph shows relative turnout by age as a percent of registered voters. Turnout in GA in '14 was 50%, and this year it was 57%. This normalization is helpful in comparing across years, but this doesn't mean that youth turnout was equal to '14, considering the 7 pt delta.
More importantly, the chart looks at turnout as a percent of registration. That's an okay baseline, but registration isn't static. In 2017 GA implemented automatic voter registration, resulting in a much higher registration rate among young people, relative to '14.
We have close to full vote history in Oregon now. A few quick thoughts...
A lot of the conversations this cycle focused on whether this would be closer to 2010 (huge red wave) or 2014 (smaller red wave). As it turns out, the options should have been 2014 or 2018.
In Oregon this year the electorate was +9.5D. In '18 it was +11.8D, in '14 it was +8D. So the electorate was slightly closer to '14 than '18, but roughly in the middle. The 2.3 pt margin dropoff in Dem turnout share from '18 lines up with the 2.8 pt margin dropoff in Gov margin.