Supply and Demand thread 🧵
We will focus on how to use simple Supply and Demand Zones to gauge market direction. These zones will drastically improve your ability to find trends and avoid chop in the market
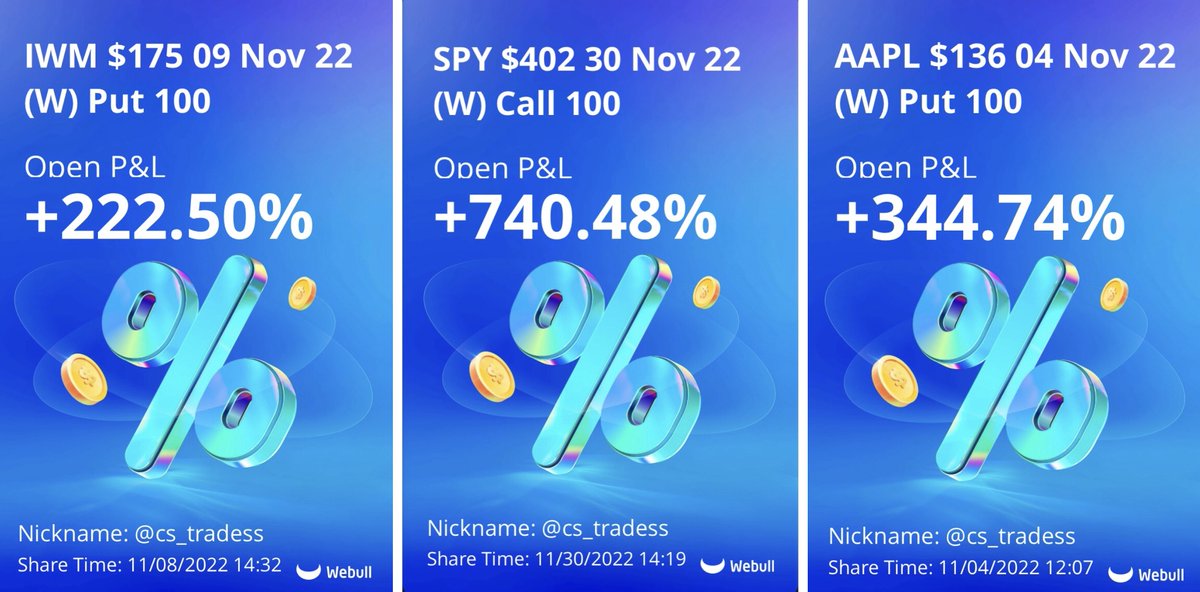
Lets look at how we used these zones on $SPY this week for huge gains!
We will focus on how to use simple Supply and Demand Zones to gauge market direction. These zones will drastically improve your ability to find trends and avoid chop in the market
Lets look at how we used these zones on $SPY this week for huge gains!
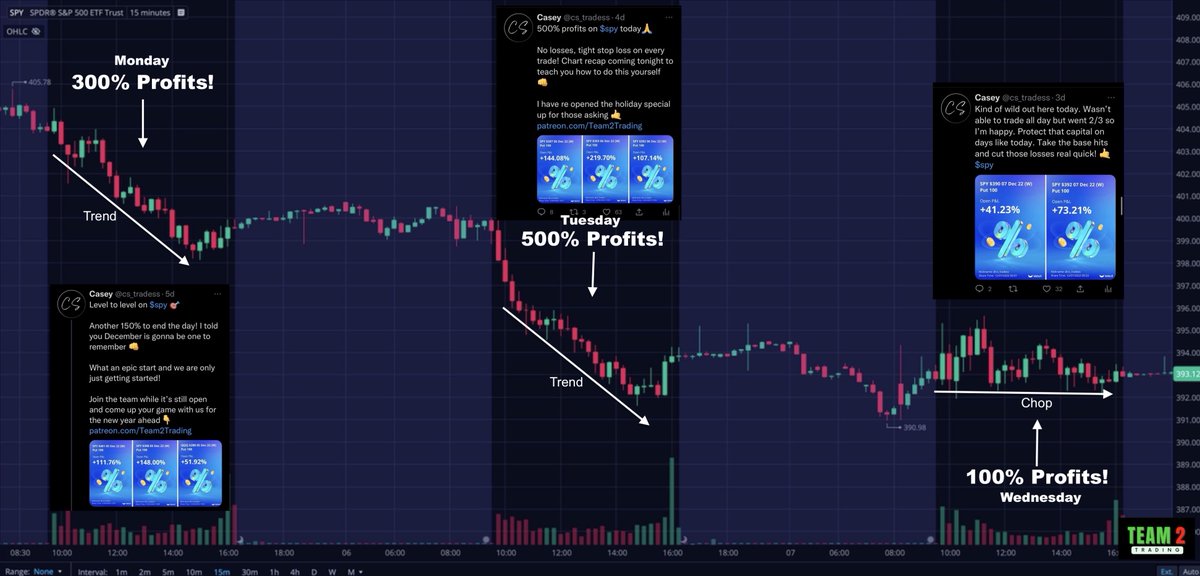
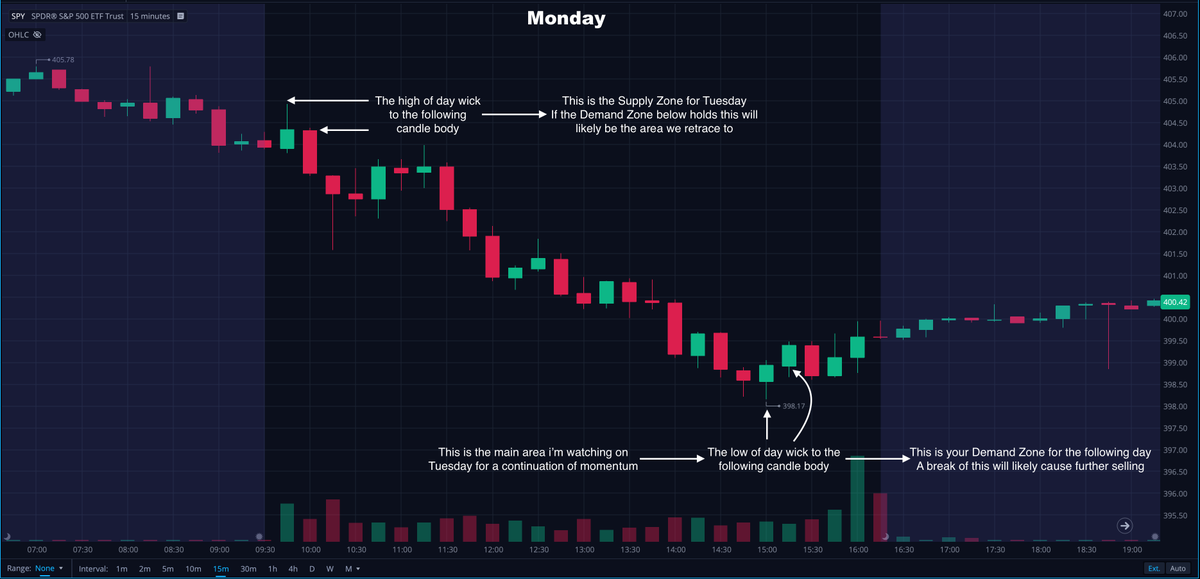
Lets start with Monday 👇
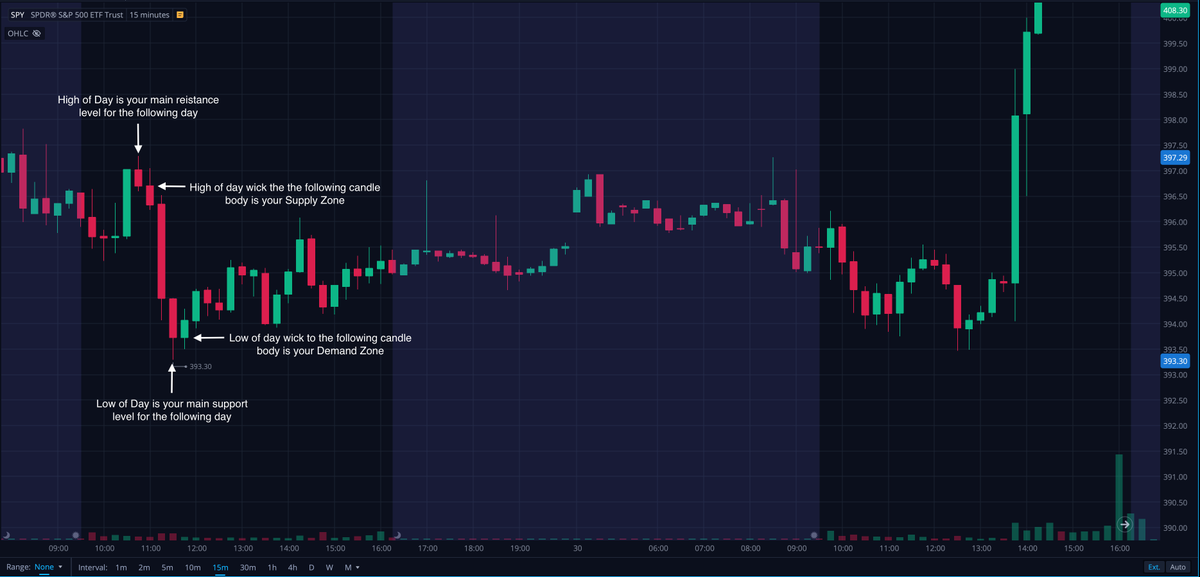
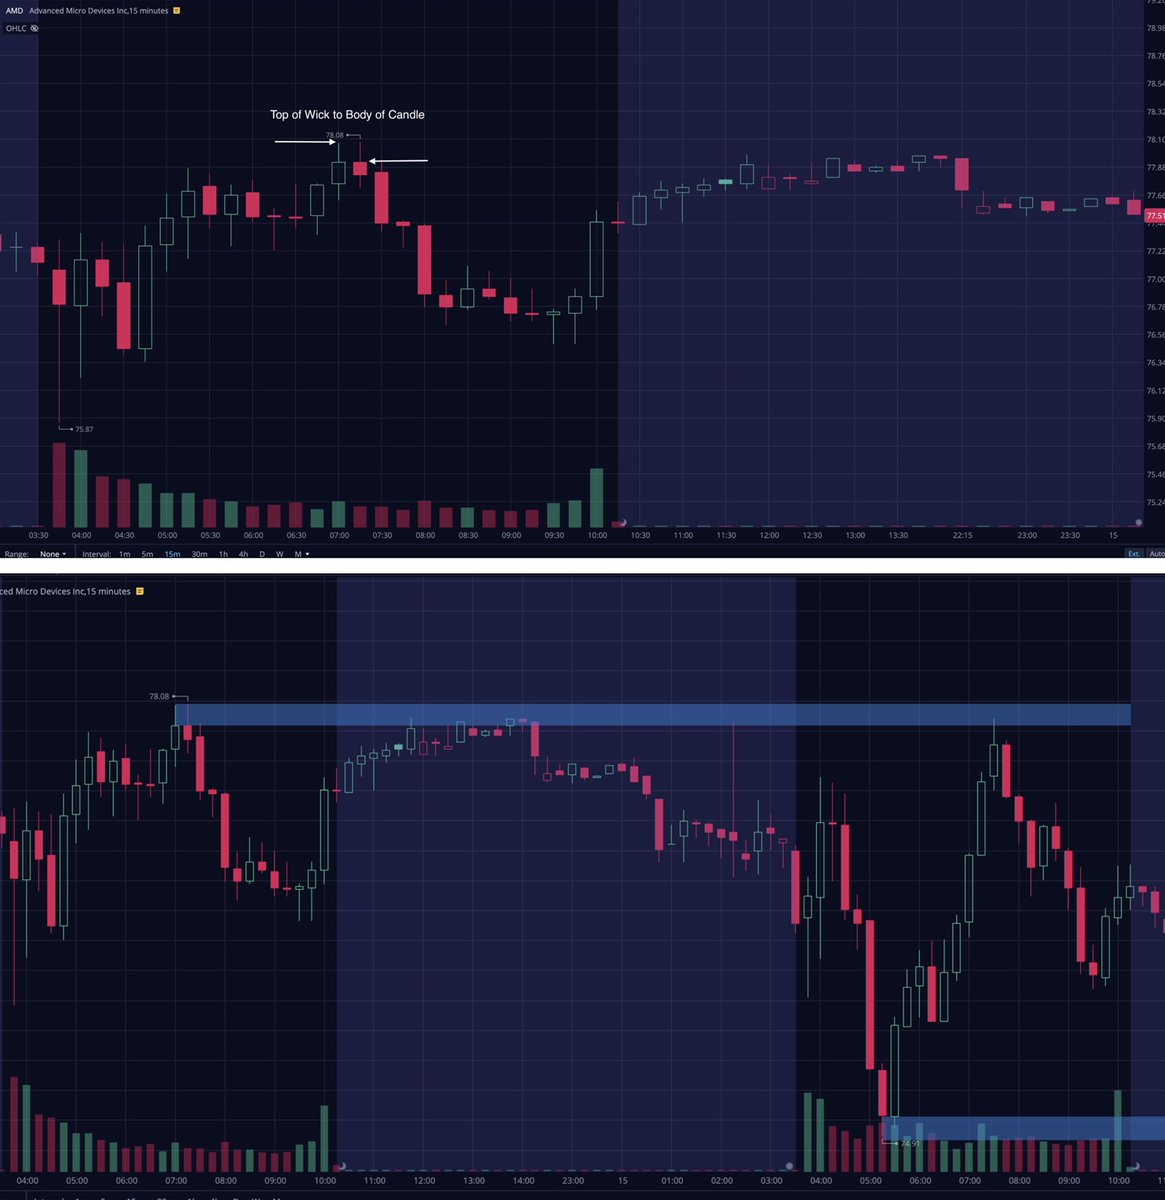
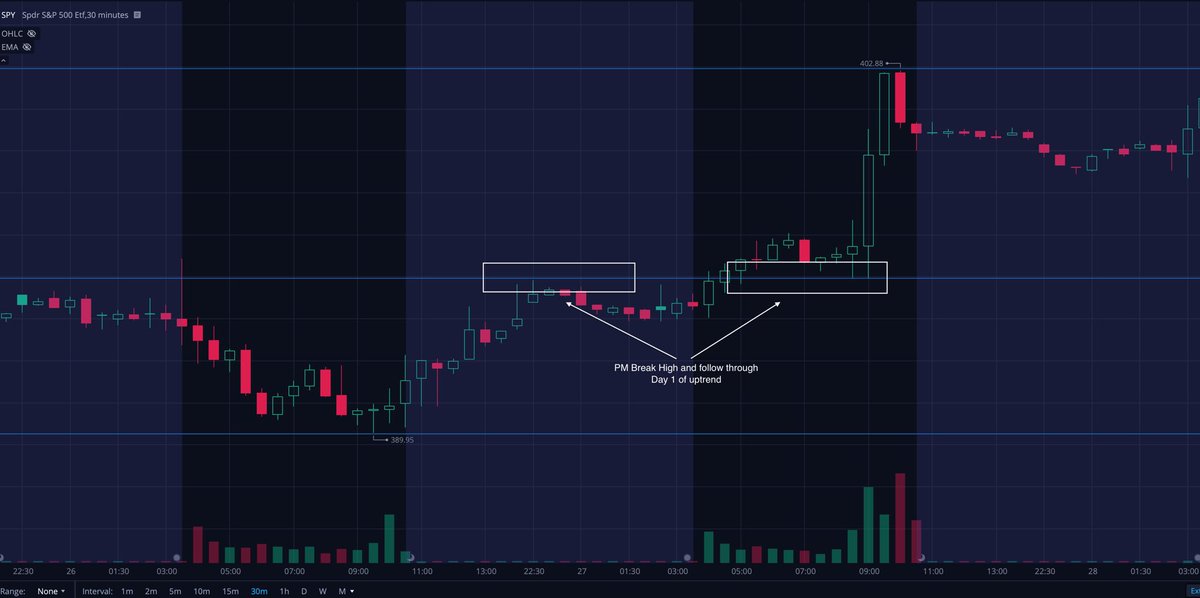
After banking all day on a big move down there is one area that has my focus, my 15 minute low of day Demand Zone
This is where price found some support, its a key area to watch the following day. If it breaks the trend likely continues.
After banking all day on a big move down there is one area that has my focus, my 15 minute low of day Demand Zone
This is where price found some support, its a key area to watch the following day. If it breaks the trend likely continues.
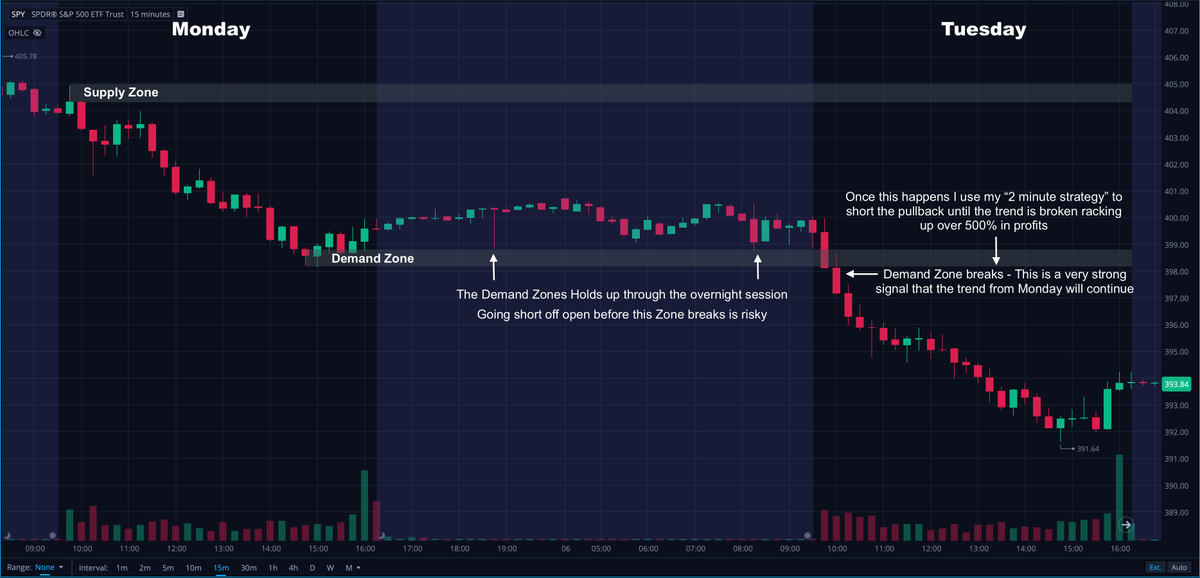
Now on to Tuesday 👇
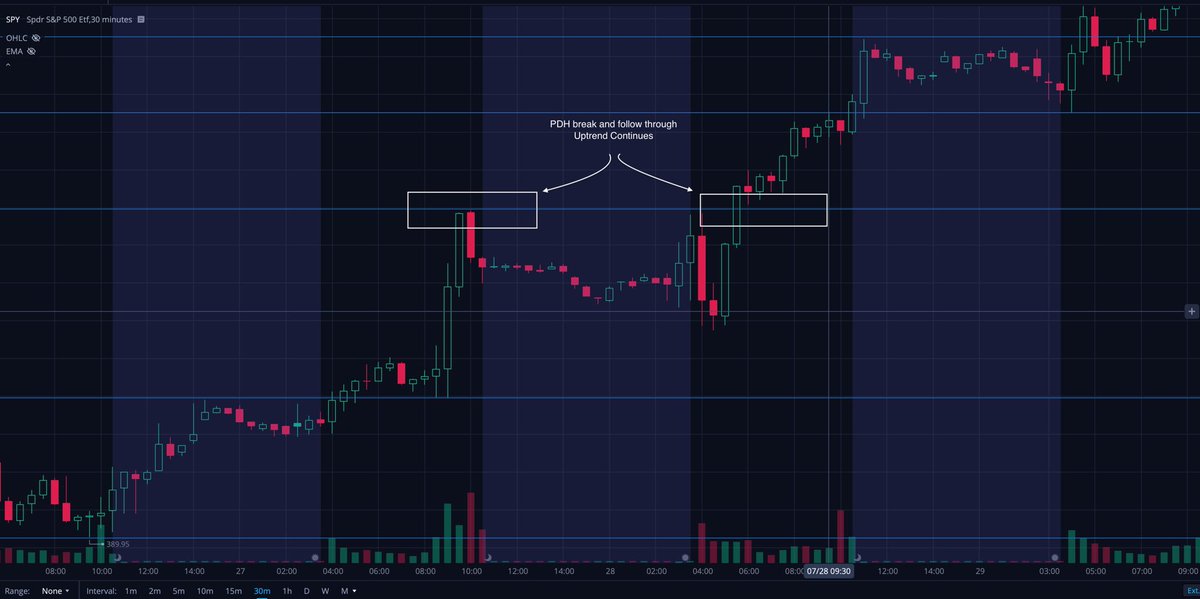
Our Demand Zone holds the overnight session well. We don't want to go short before this Zone breaks.
Once this zone breaks the momentum is down and the best R/R is to the short side. Any long positions opened under this zone are high risk.
Our Demand Zone holds the overnight session well. We don't want to go short before this Zone breaks.
Once this zone breaks the momentum is down and the best R/R is to the short side. Any long positions opened under this zone are high risk.
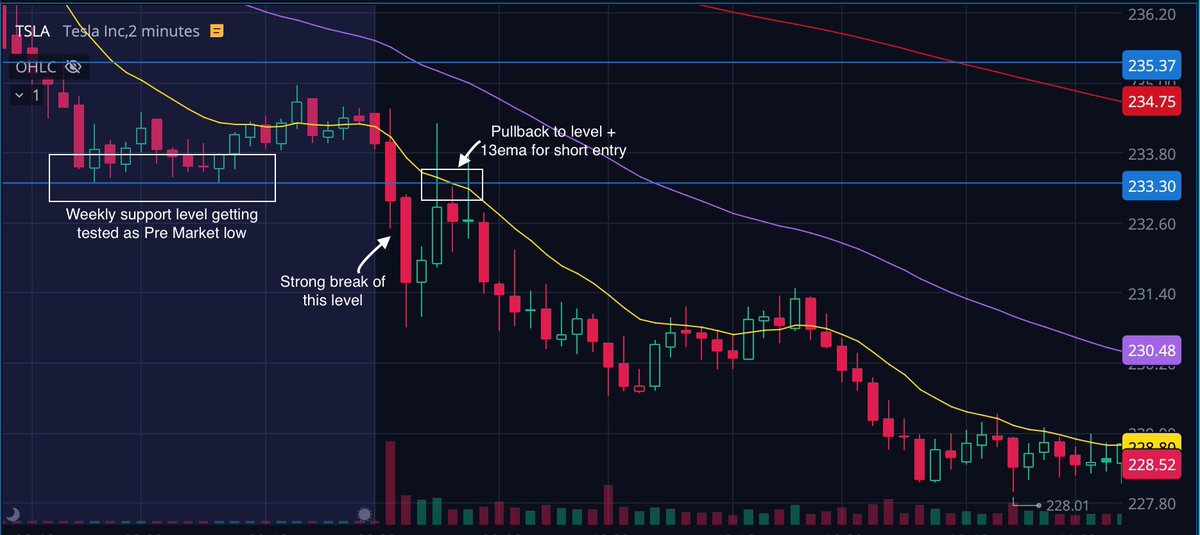
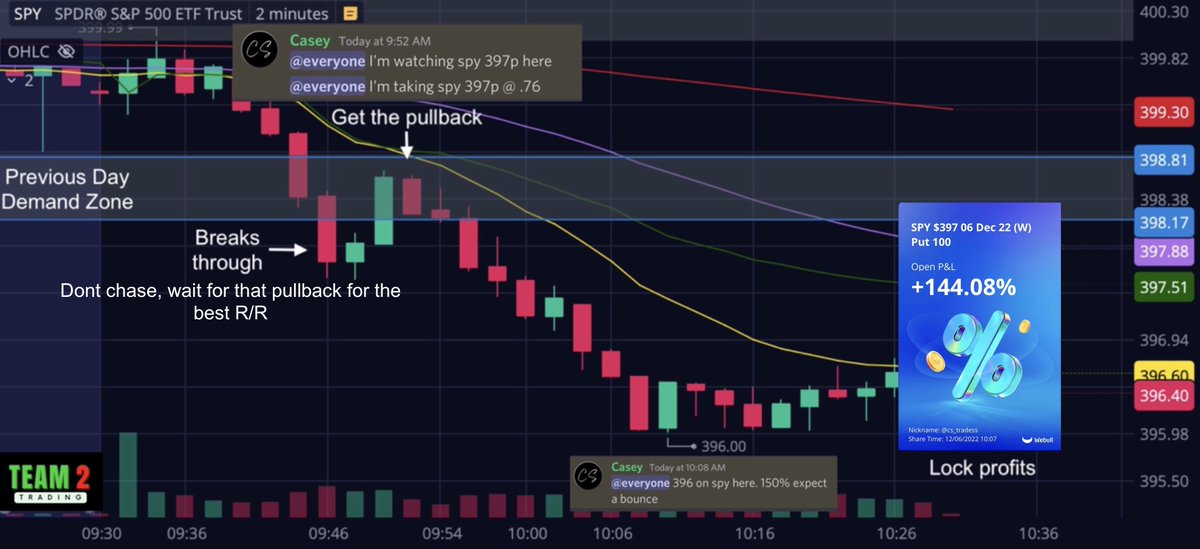
Here is a look at how I played this move on Tuesday using my "2 minute strategy".
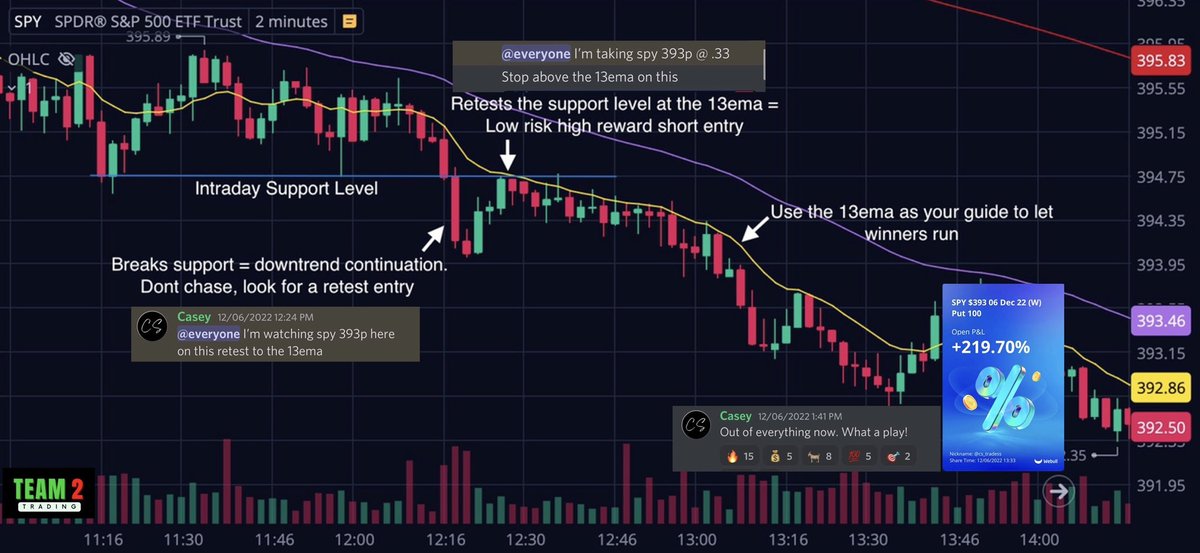
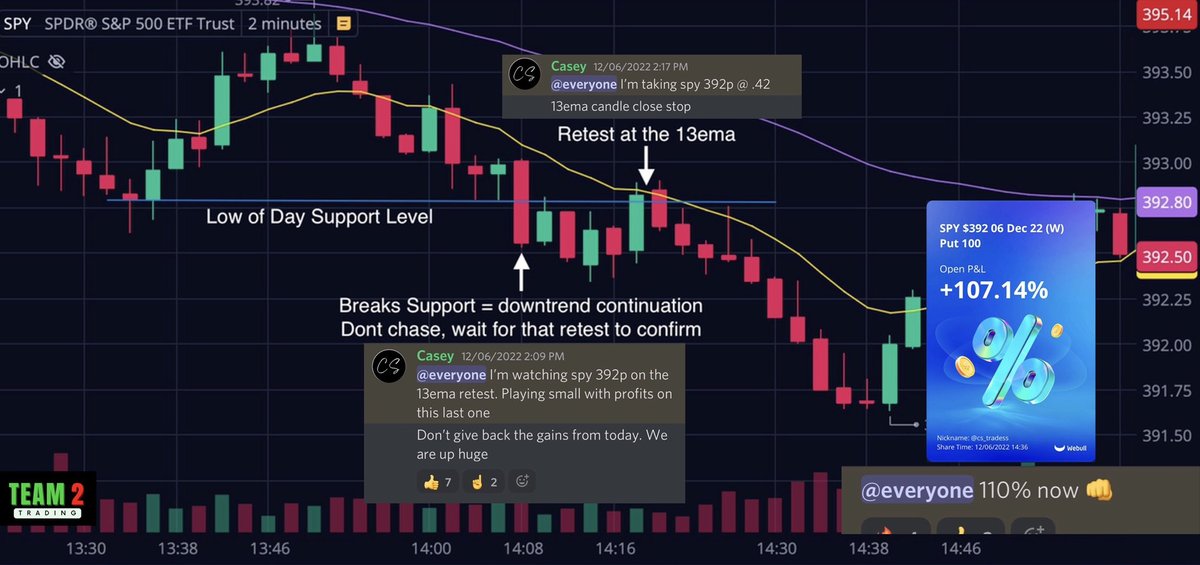
After our Demand Zone break showed us the way I am only looking at going short because that is were the momentum is.
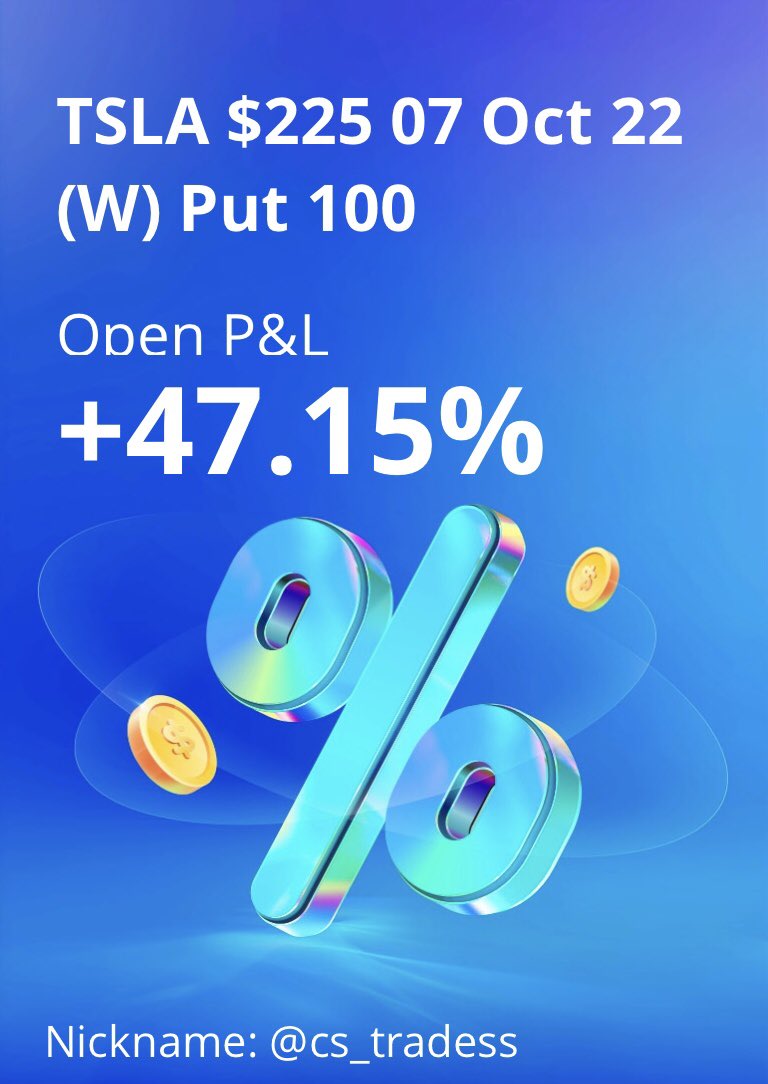
I rinse and repeat the pullbacks to the emas for over 500% profits in 1 day!
After our Demand Zone break showed us the way I am only looking at going short because that is were the momentum is.
I rinse and repeat the pullbacks to the emas for over 500% profits in 1 day!
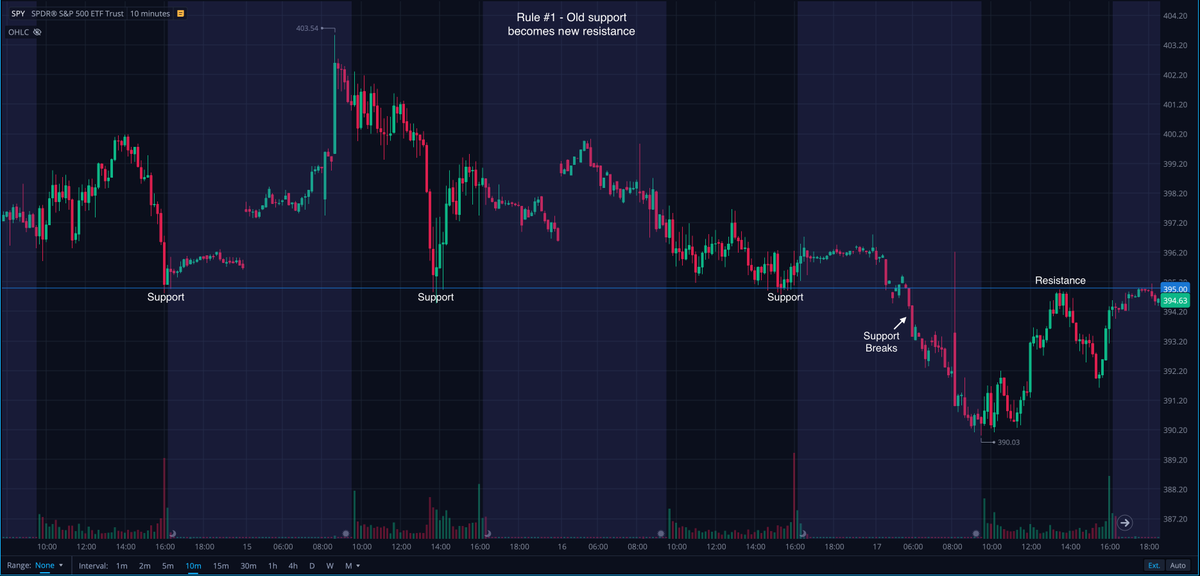
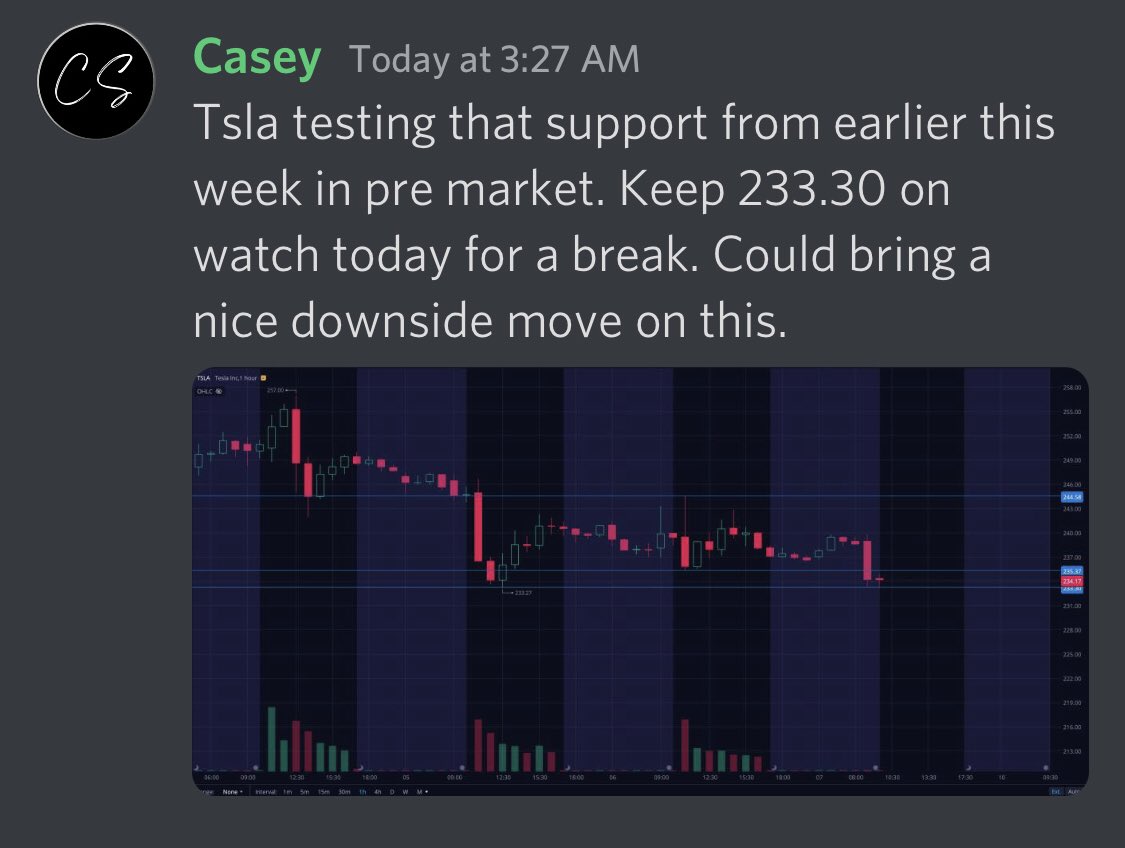
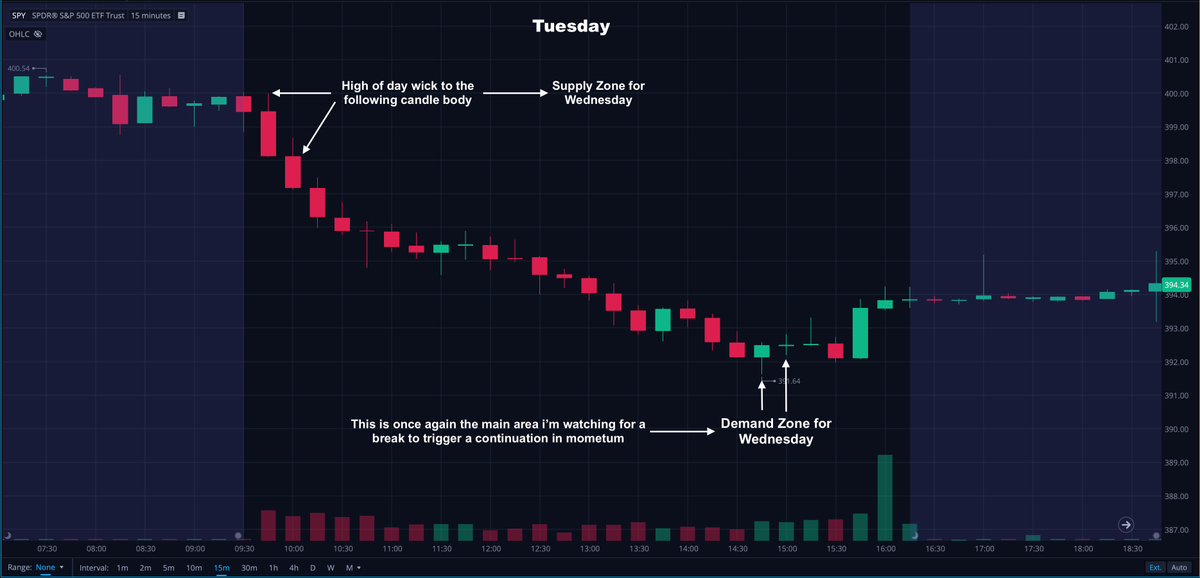
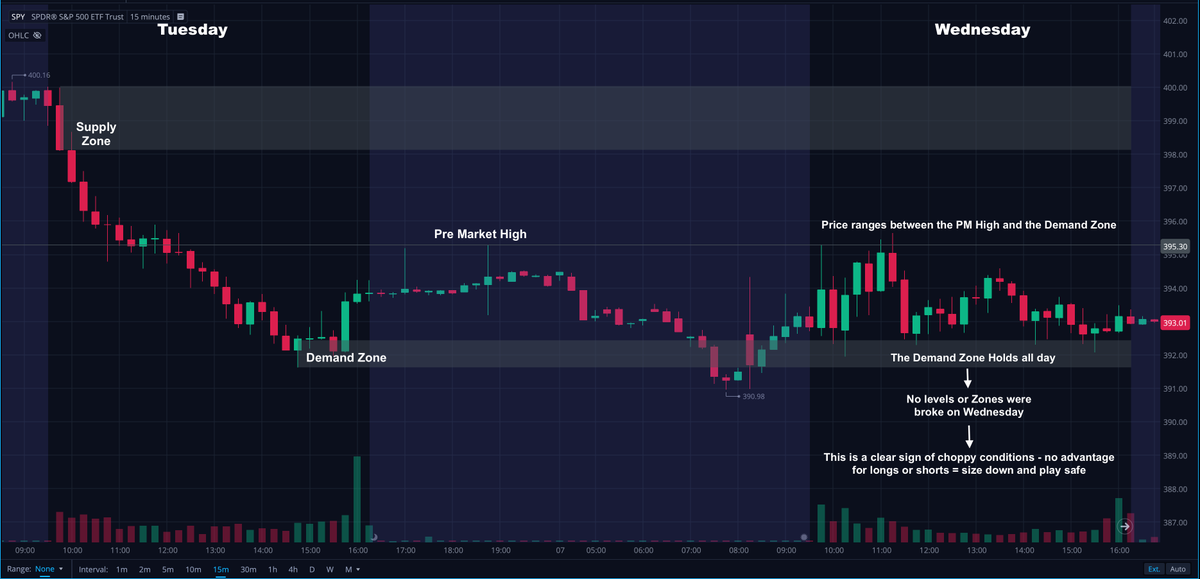
Now coming into Wednesday I'm watching the same 15 minute low of day Demand Zone.
Holding this new Demand Zone will likely lead to some consolidation or a reversal. A break of this Zone likely leads to more selling pressure.
Holding this new Demand Zone will likely lead to some consolidation or a reversal. A break of this Zone likely leads to more selling pressure.
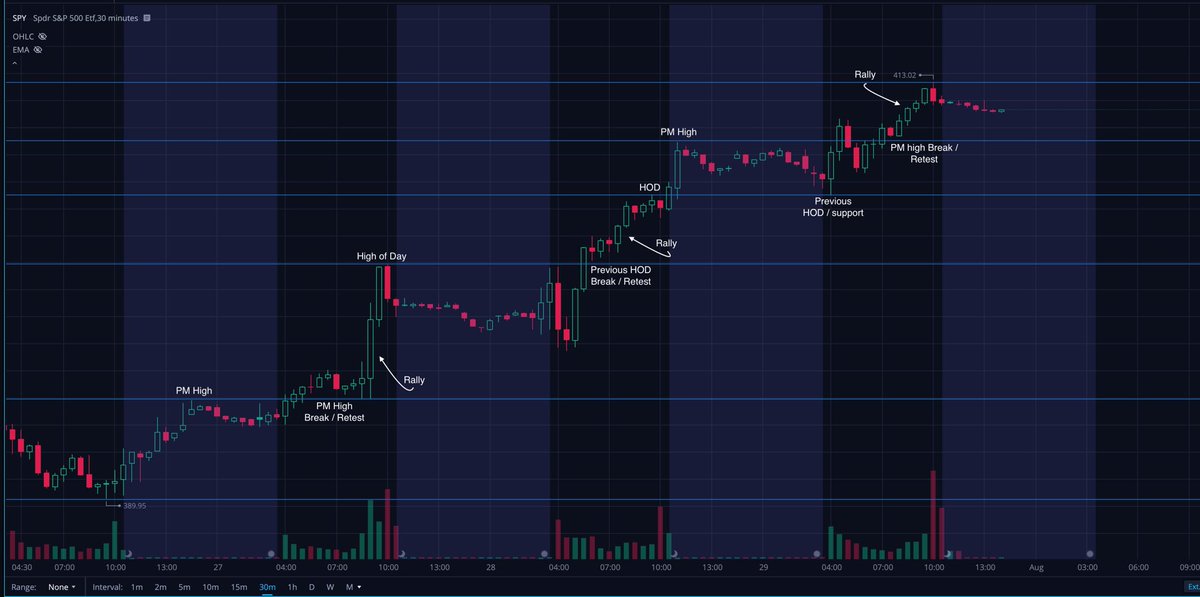
As you can see, Wednesday $spy held the PDL Demand Zone and channels between that zone and the pre market high all day.
Because there is no significant level or zone breaks there is no advantage for longs or shorts. This leads to choppy price action as we consolidate 👇
Because there is no significant level or zone breaks there is no advantage for longs or shorts. This leads to choppy price action as we consolidate 👇
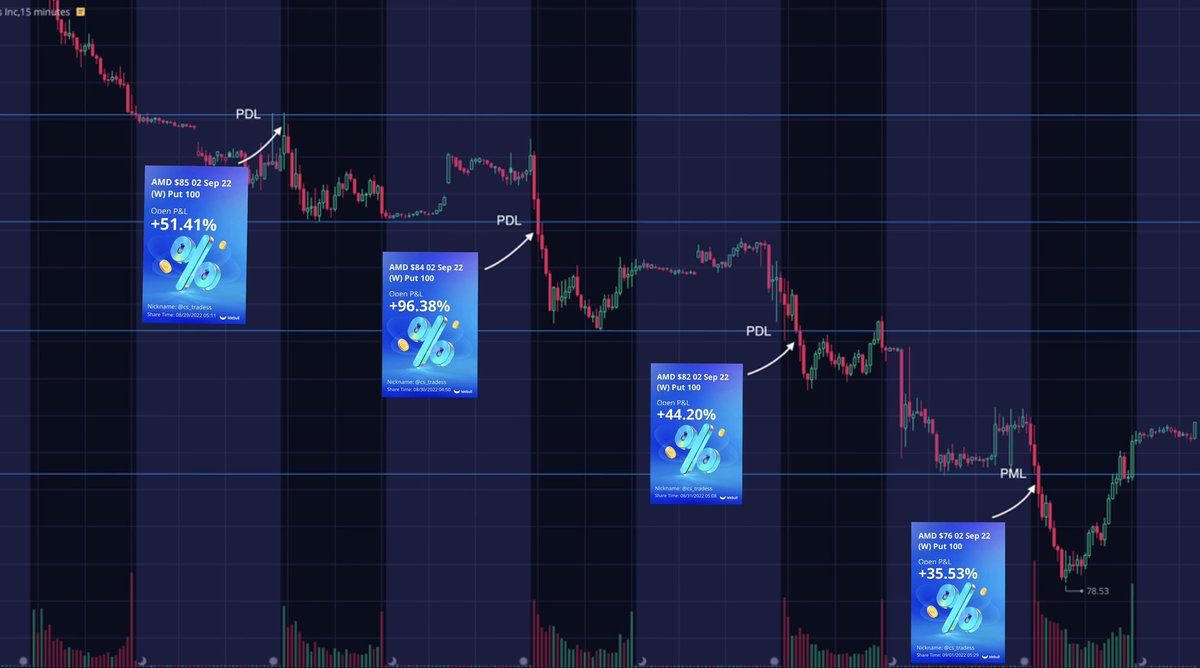
Continue the process of drawing your high and low of day S&D zones every day after market closes to give you an idea of where the best risk to reward is, as well as when to be patient and avoid any periods of consolidation or chop.
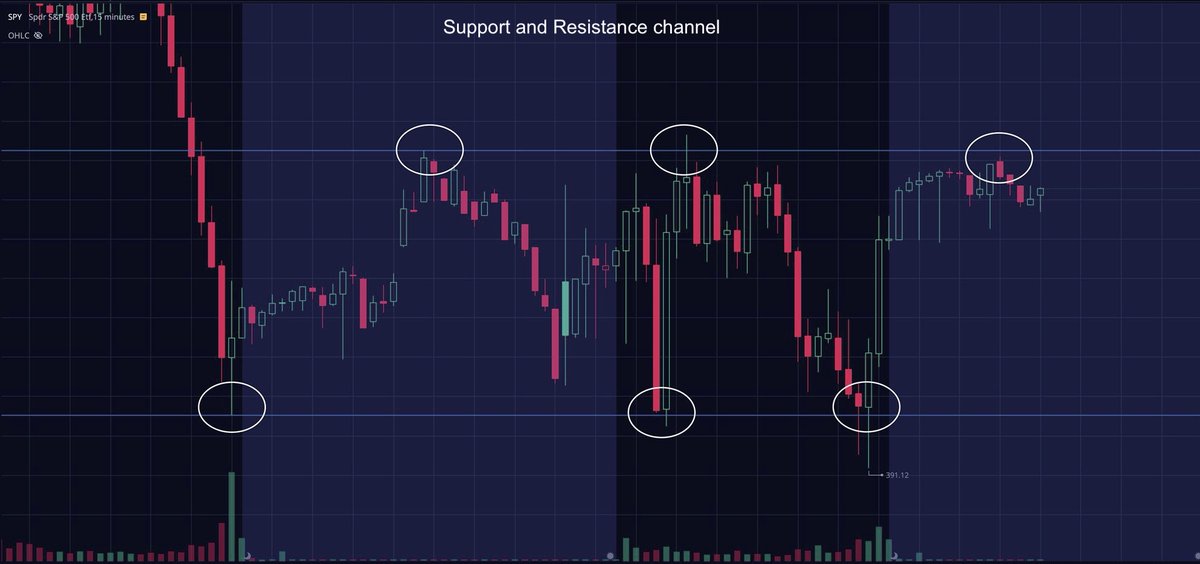
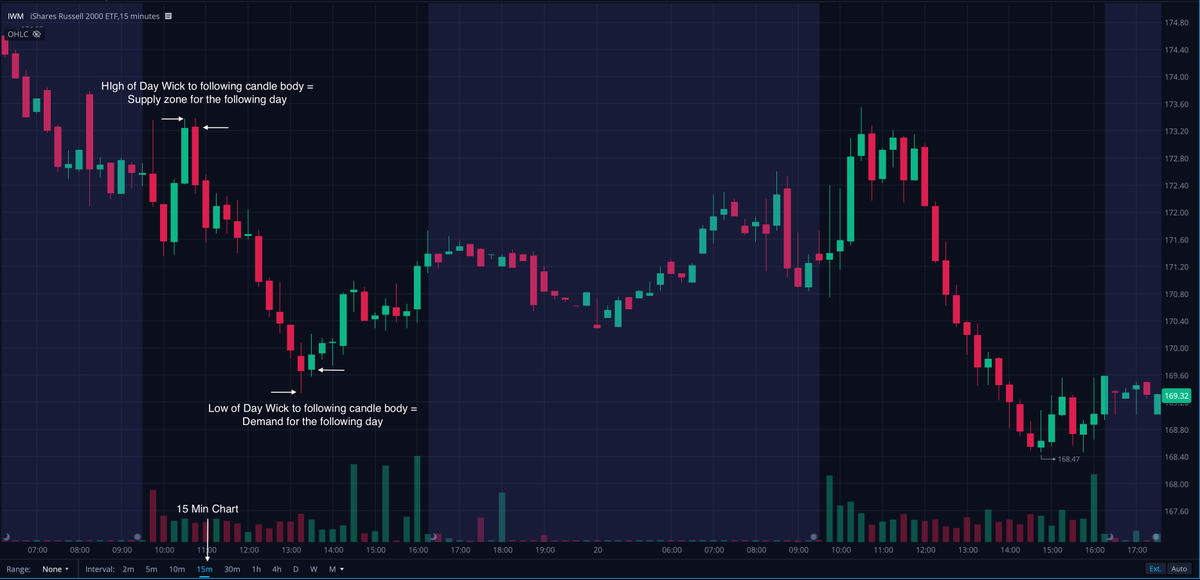
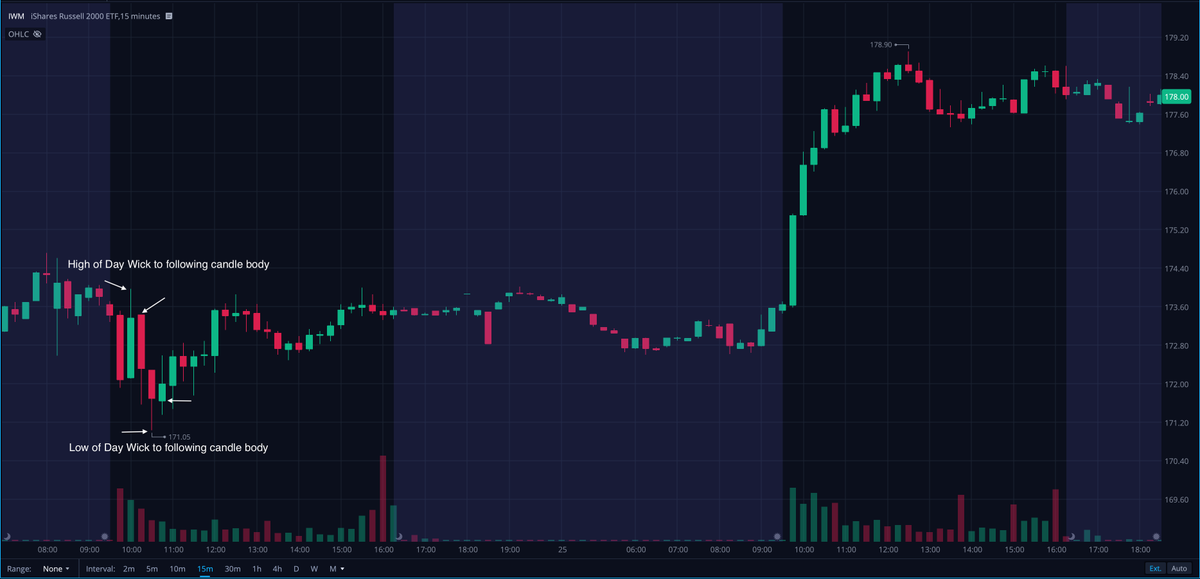
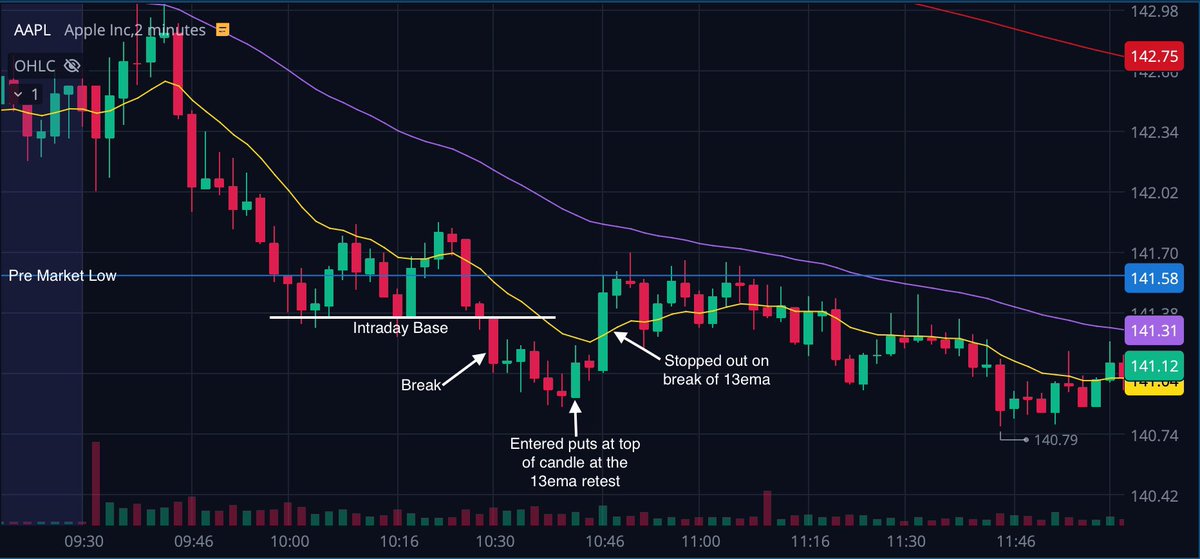
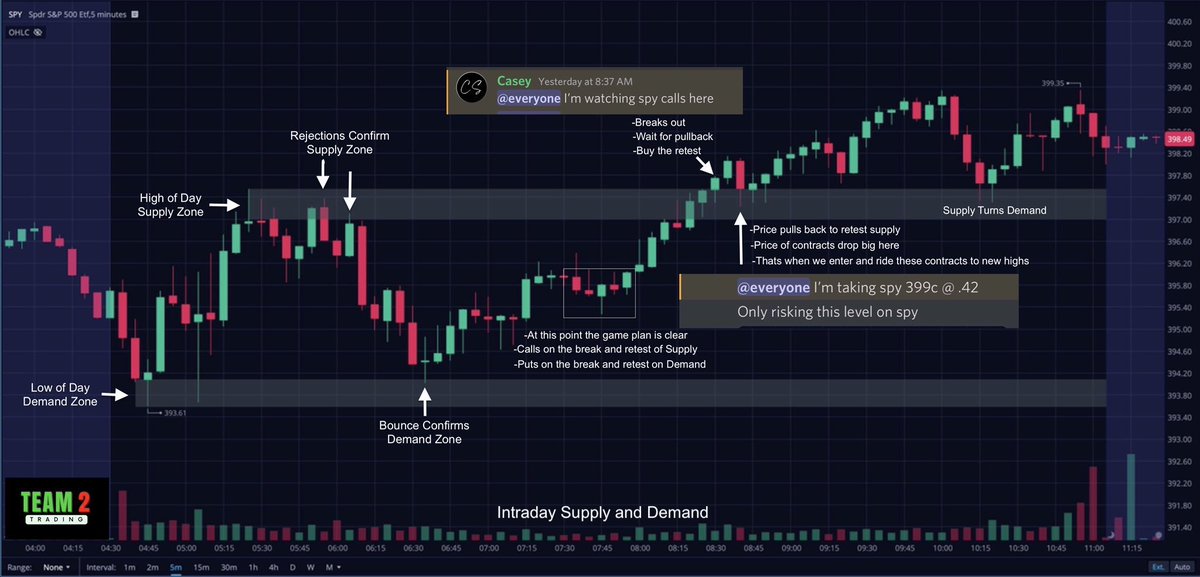
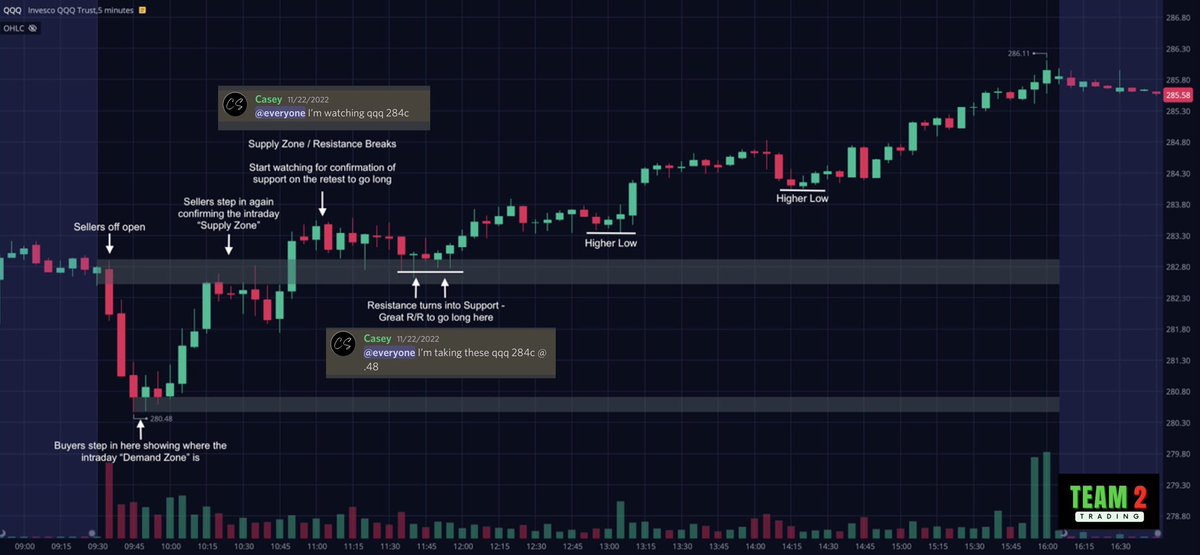
During times of consolidation in between these previous day zones you can use intraday Supply and Demand zones to scalp the market and set the odds in your favor. Here are some examples of that below 👇
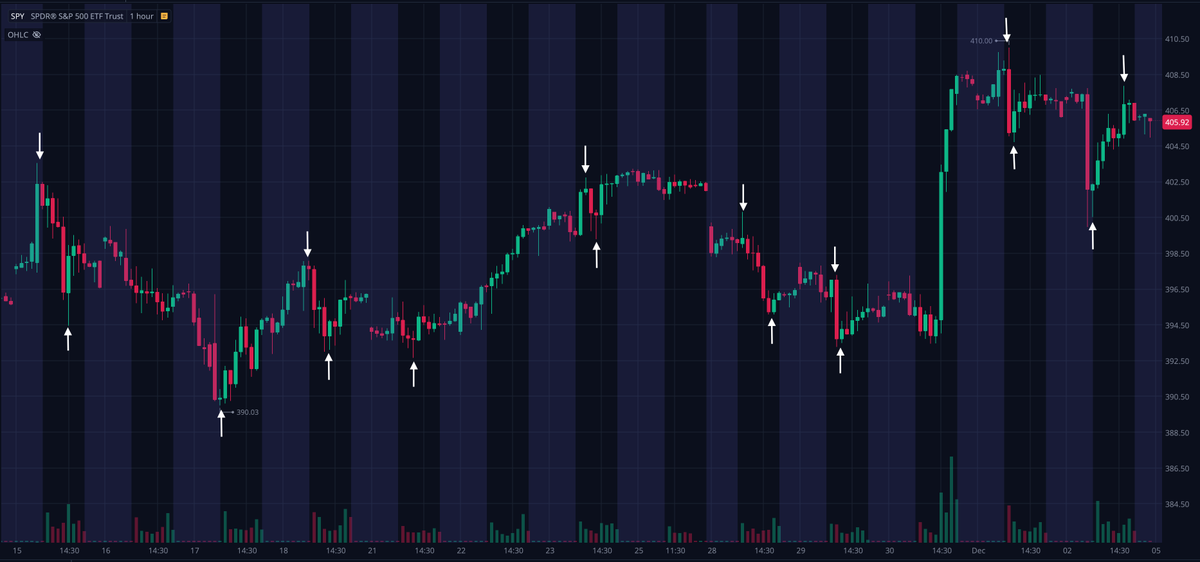
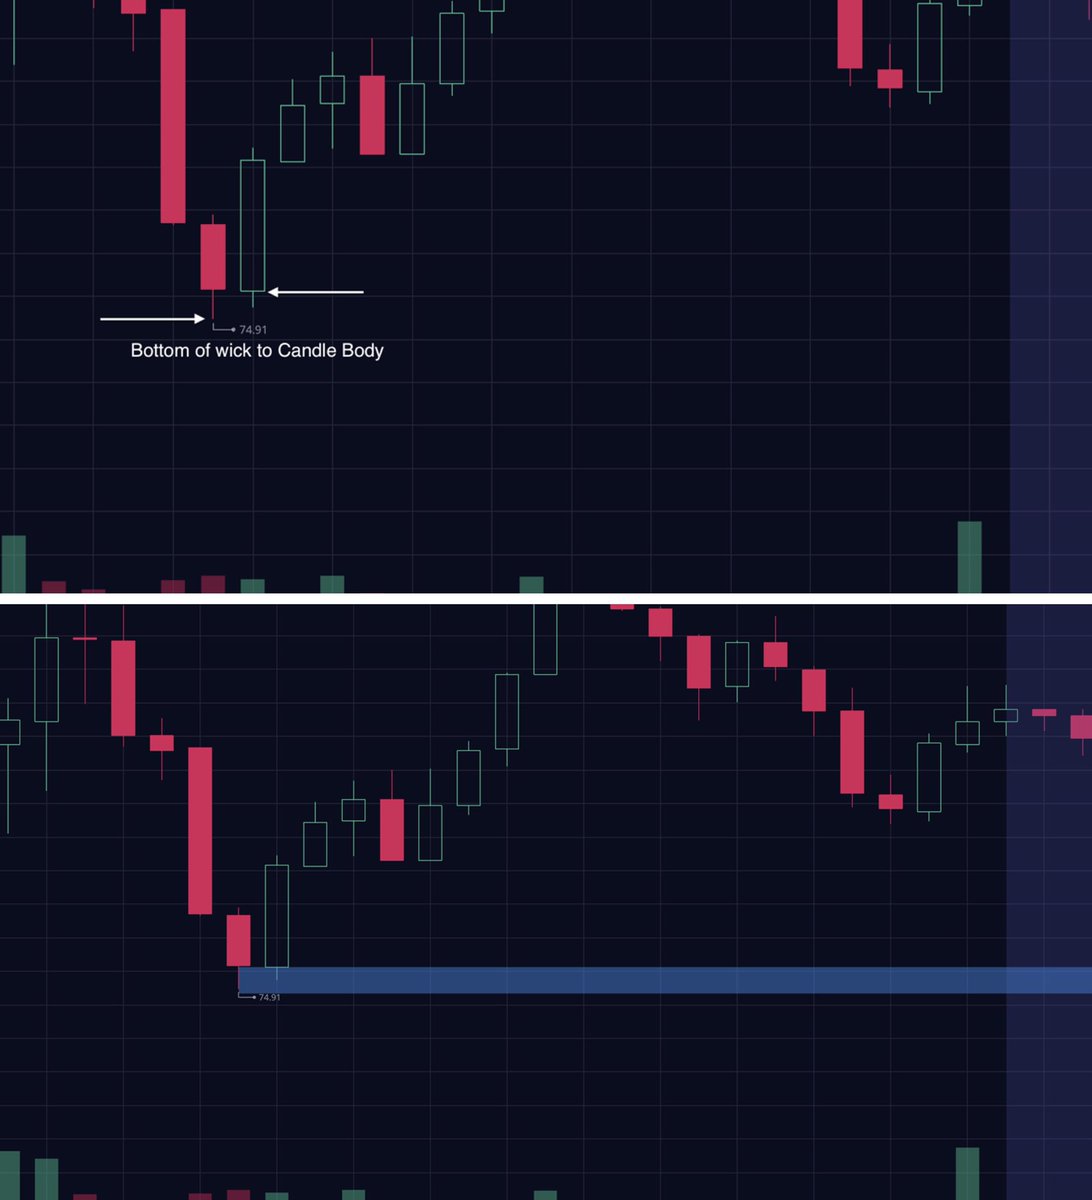
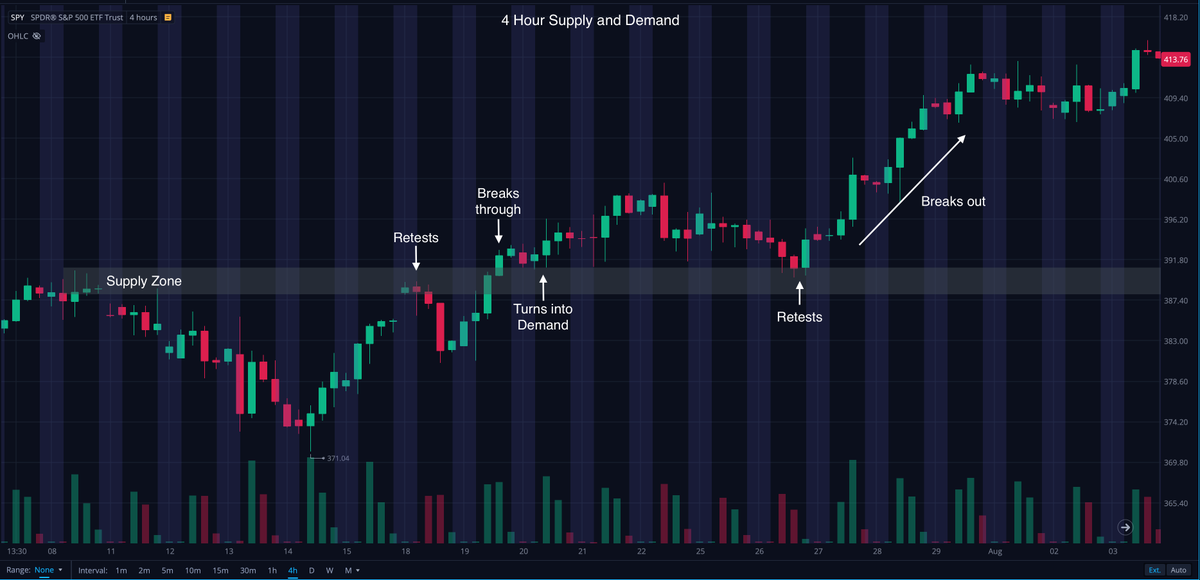
The same rules apply for larger timeframe Supply and Demand Zones. They are a great tool for a wider outlook on the market. Here is a good example of how price respects these Zones on a 4 hour timeframe. Great for swing traders.
There are many ways to draw and view Supply and Demand Zones.
This is simply the way I do it and one of the best ways I've found for day trading and gauging momentum.
Thanks for reading 🤙 If you found it helpful please give it a ❤️ and ♻️ Now lets bank! #Team2Trading
This is simply the way I do it and one of the best ways I've found for day trading and gauging momentum.
Thanks for reading 🤙 If you found it helpful please give it a ❤️ and ♻️ Now lets bank! #Team2Trading
• • •
Missing some Tweet in this thread? You can try to
force a refresh