Following the paper noted this week to have just added capital “T”s to a graph to depict standard errors 😱🤯, a short note on the importance of accurate data visualisation in any research report … 1/8
#MethodologyMonday
#MethodologyMonday
This was the tweet & thread which highlighted T-gate. There are lots of other issues with that paper, but data visualisation is a core element 2/8

https://twitter.com/serifeliciano/status/1597355324008108034?s=46&t=EiTej4apumJRKGTpiq4URw

The paper had attempted to use a #DynamitePlot (sometimes known as a Plunger Plot) to display the data. Even without adding T’s there are major issues with dynamite plots and frankly most statisticians would like them consigned to history! 3/8
A great explainer piece on why #DynamitePlots are problematic is in this paper by
@T_Weissgerber. The dynamite plots hides a plethora of different data possibilities & hides the spread of the data 4/8
journals.plos.org/plosbiology/ar…
@T_Weissgerber. The dynamite plots hides a plethora of different data possibilities & hides the spread of the data 4/8
journals.plos.org/plosbiology/ar…

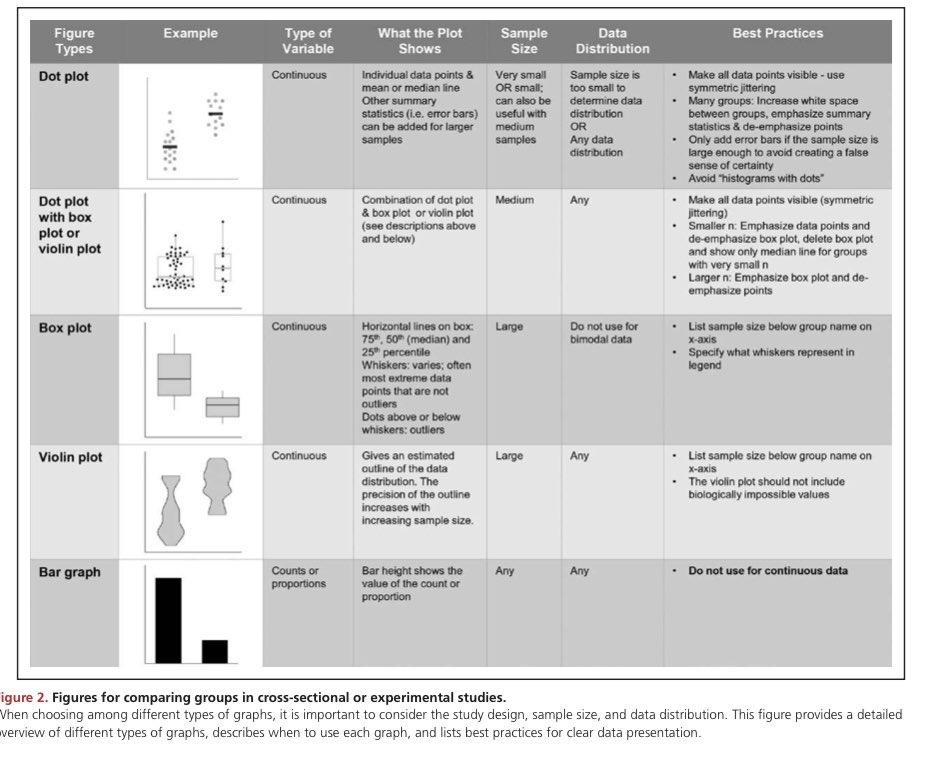
A super paper that shows lots of different visualisation types is here. As the paper says, the aim of data visualisation is to reveal the data, not conceal it! 5/8
ahajournals.org/doi/pdf/10.116…
ahajournals.org/doi/pdf/10.116…

Options for good visualisation include violin plots, dot plots, box plots etc depending on the type of data and what the overall message is to be 6/8 

For longitudinal data & presenting individuals data over time, there are also different options, including the interestingly titled lasagne & spaghetti plots. 7/8
ncbi.nlm.nih.gov/pmc/articles/P…
ncbi.nlm.nih.gov/pmc/articles/P…
The bottom line is that one should always ensure the plot you choose matches the data type and displays the data fully. It should aid not hinder understanding … and preferably should not be a dynamite plot! 8/8
• • •
Missing some Tweet in this thread? You can try to
force a refresh


