Organised another workshop on #DataViz in R using #ggplot2 within our Forest Entomology group at @WSL_research. Managed to cover most of the basics, looking forward to the "Advanced DataViz with ggplot2" workshop next week! A few issues / special cases we discussed today: 1/n 


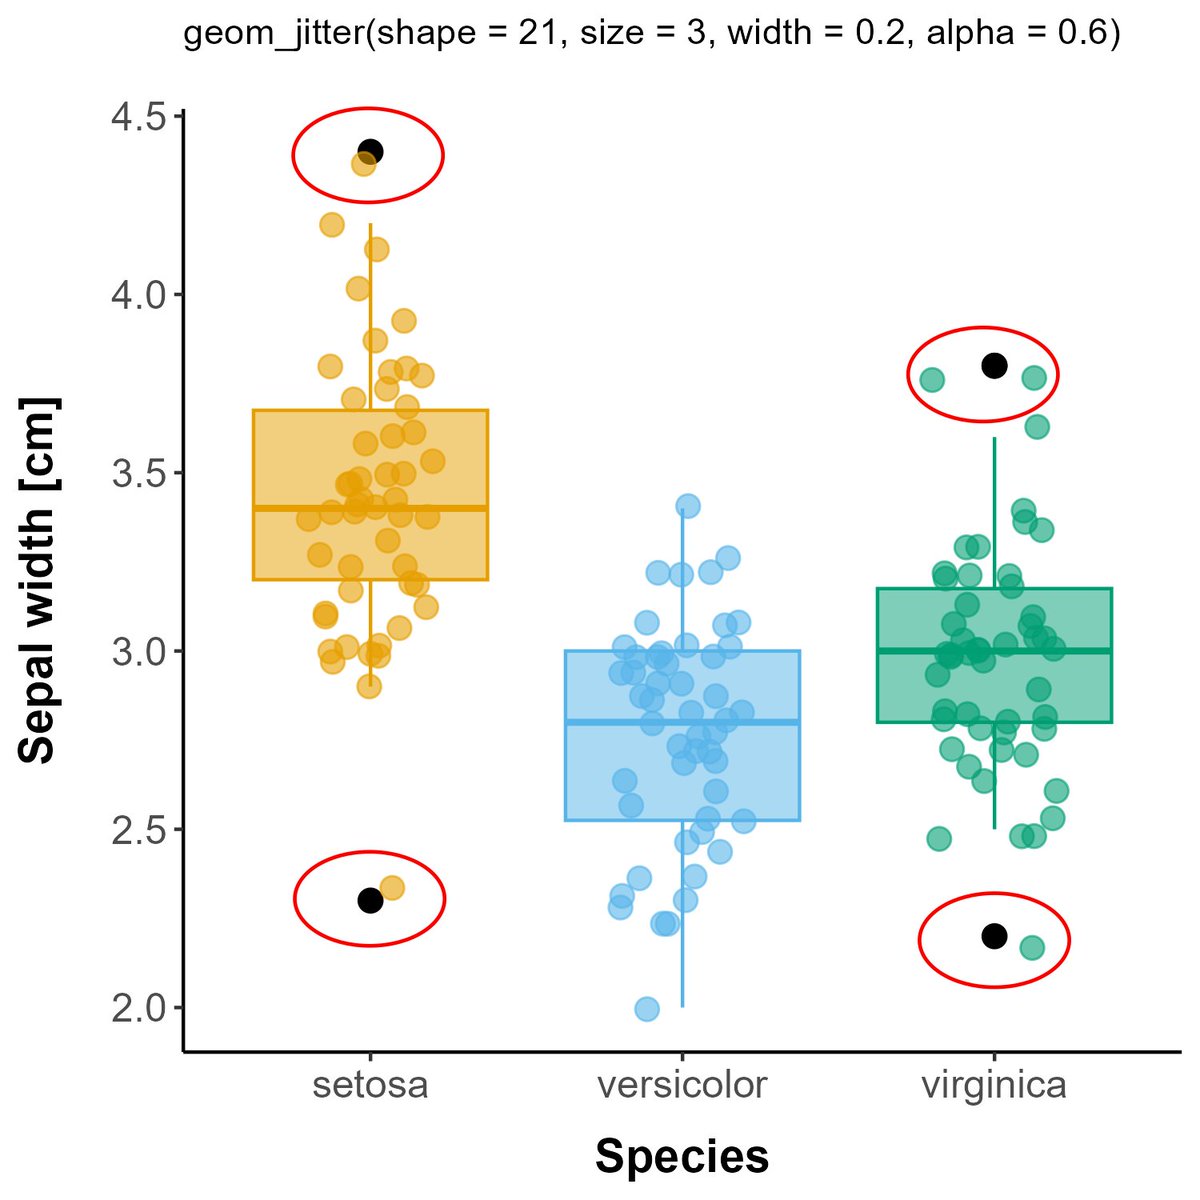
When plotting raw data on top of e.g. boxplots, to increase visibility, use geom_jitter() to "jitter" the datapoints around the center of the boxplot, along the x-axis. However, make sure you include the argument height = 0, otherwise, the datapoints will be jittered 2/n 


along the y-axis, which will change their actual value! Easy to spot when the min / max don't align with the "outliers" (given in black). Left: height = 0, right: height not set to 0, the datapoints are therefore jittered along the y-axis. 3/n 


Violin plots: appear to be fancy and popular, but there are still a few rules to follow / ggplot2 behaviours to be aware of: when using geom_dotplot(), the datapoints are binned (grouped into bins), which might not necessarily present the data in an accurate way. Also, avoid 4/n 


using trim = F within geom_violin(). This will add the "pointy ends" to your violin plots, thereby extending the violin plots beyond the actual range of the data (see dashed lines which represent the min and max value per species). This is in particular tricky (and wrong) 5/n
when your data ranges from 0 to +Inf (e.g. counts or measured variables such as length, width etc.) which cannot be < 0. If in such cases trim = F is used, the "pointy ends" will extend below 0. Fortunatelly, the default setting is trim = T. 6/n
When adding boxplots on top of violin plots, either adjust the width of the boxplots, so that they fit inside the violin plots, or set their transparency to 100% (alpha = 1). This way, the shape of the violin plots will not be hidden / invisible below the boxplots. 7/n 


Ever encountered something like this? When considered separatelly for each species, sepal length and sepal width show a strong, significant relationship, and this relationship is positive for all species. When the entire data is considered without being grouped by species, 8/n 

this trend either disappears or reverses (e.g. in this case becomes negative, although not significant). This is a phenomenon known as Simpson's Paradox. 9/n
Back to the plot: very useful package to add linear regression coefficients and stats: ggpmisc
Specifically the function stat_poly_eq()
Happy to share the script here if needed! 10/n
Specifically the function stat_poly_eq()
Happy to share the script here if needed! 10/n

And lastly, a great and very fast way for data exploration: ggpairs() from the package GGally. Different options available, relatively easy code, still allows for some "freedom". Might get messy for many groups, but works well with n.groups <= 5. 11/n 

Almost forgot: the colors used here are from the palette developed for color vision deficiency friendly DataViz by Okabe and Ito, 2008.
See also easystats.github.io/see/reference/…
12/n
See also easystats.github.io/see/reference/…
12/n

I hope this was useful for some of you! Happy to share my code and hear your thoughts. Always open for the possibility of organising an (online) workshop or seminar on #DataViz, so feel free to contact me! 13/13
• • •
Missing some Tweet in this thread? You can try to
force a refresh


