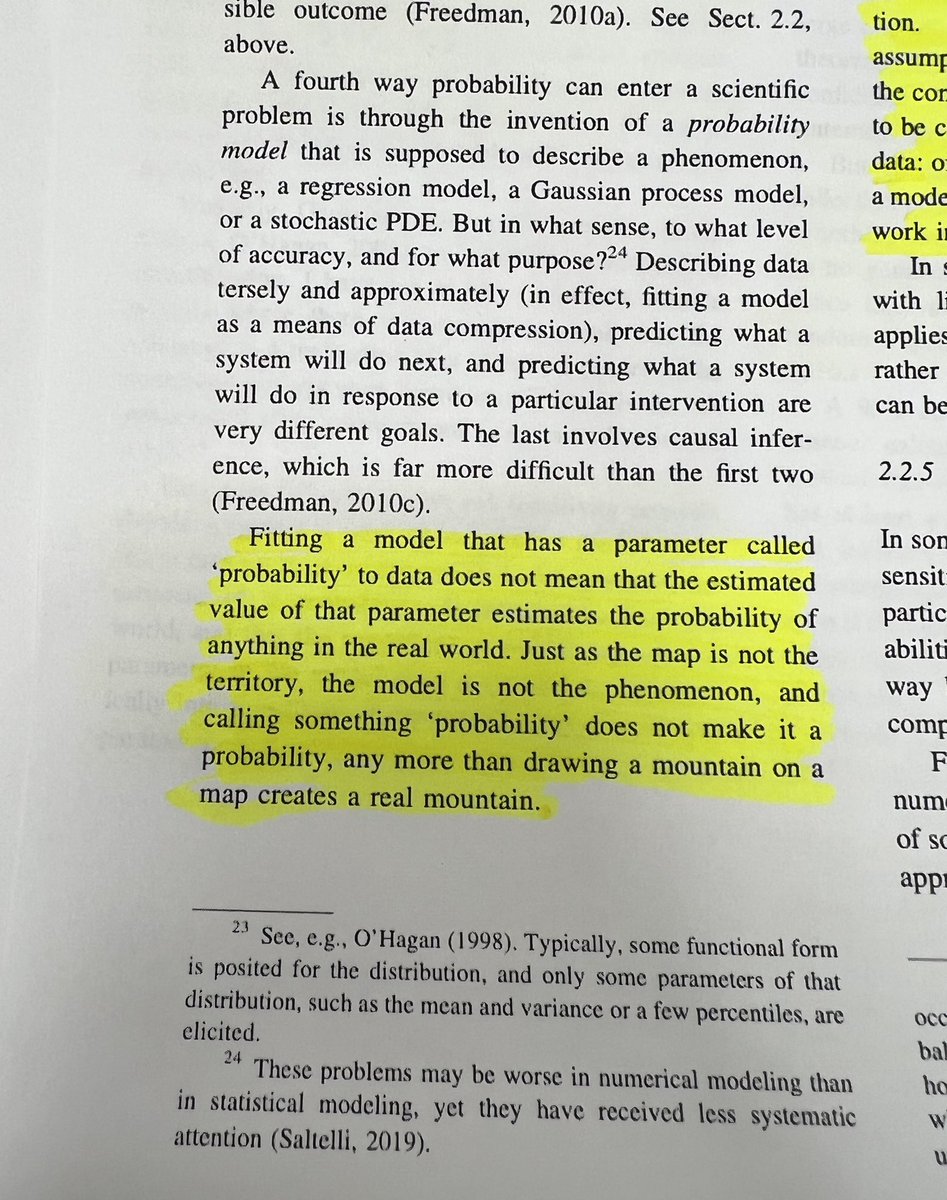
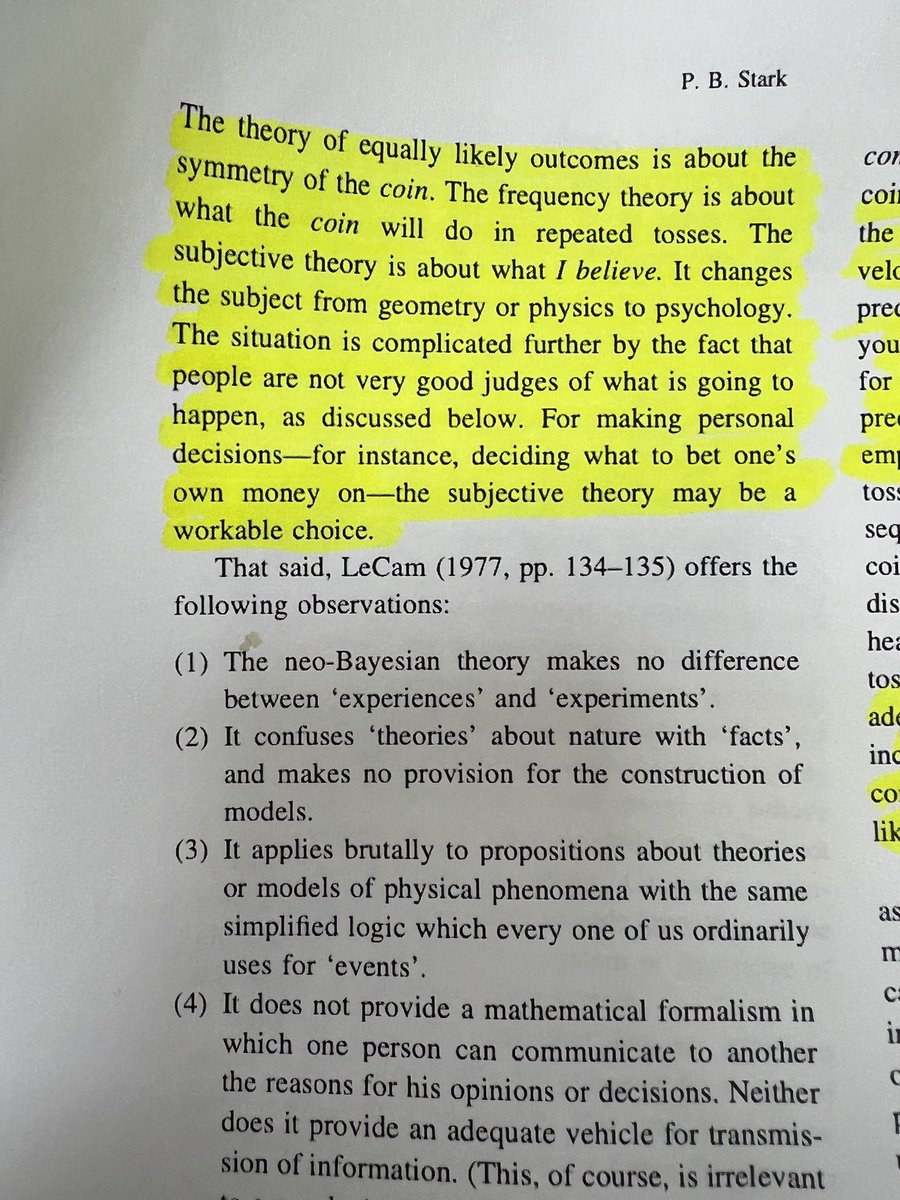
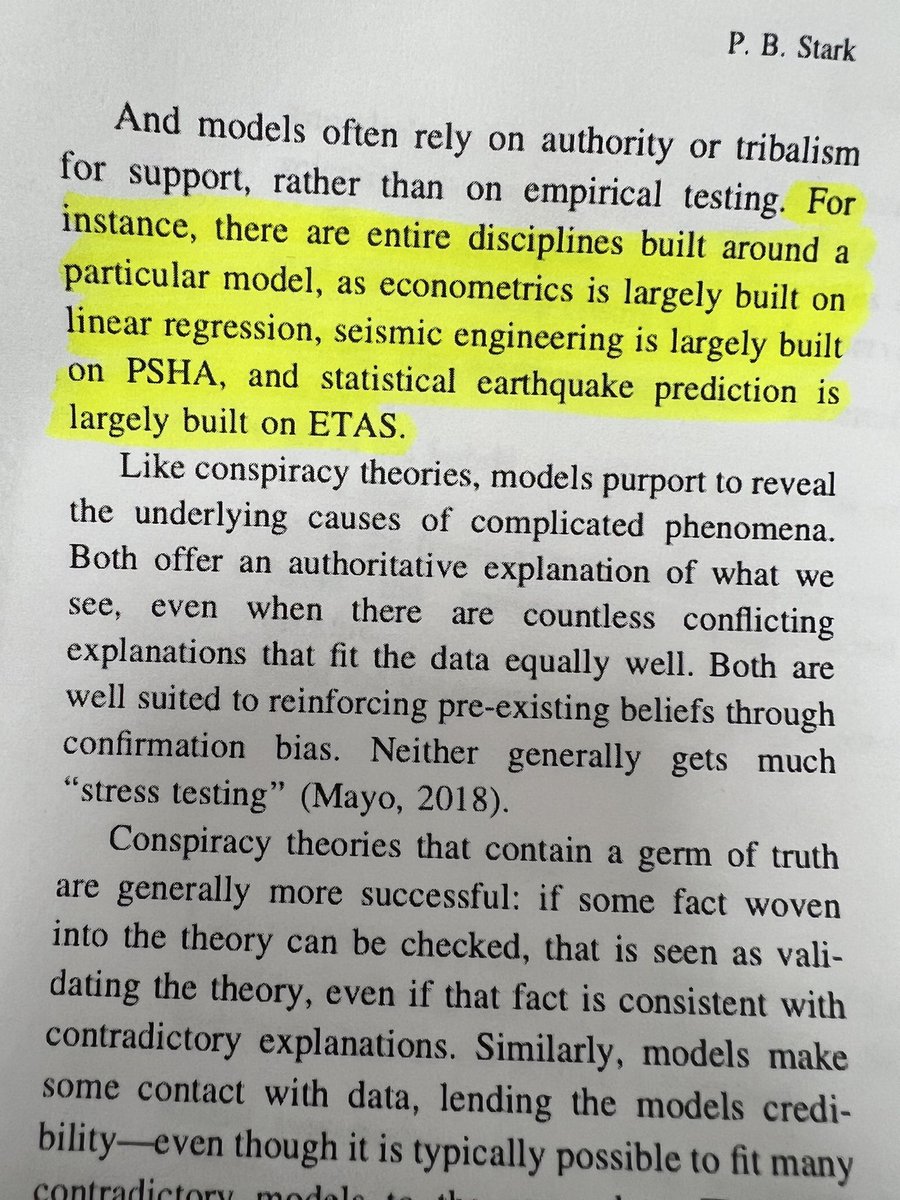
This paper by @philipbstark is a must read for anyone who builds and fits statistical models as it shows how most stat models in several disciplines are insanely disconnected from reality 1/n 
https://twitter.com/Lester_Domes/status/1602487924271898624

There are so many excellent points and examples in the paper so the rest of this thread will be screenshots with some minor annotations, first I focus on general points in the paper and then discuss the model examples which start around tweet #20 2/n 

Issue: Quantifauxcation and forcing complex phenomenon into simplistic numbers for the sake of rigor and comparisons 3/n 

Can we trust peoples intuitions and perceptions about complex phenomenon and how that translates into components of the model? 9/n 

Is it true in practice that with more data the prior (a modeling choice) will eventually be swamped? 14/n 

If you model something as being random when it is not does the probabilistic interpretation seem sensible? 15/n 

Simulations are completely dependent on what you bake into them, they don’t reflect reality itself 17/n 

What if you started calculating inferential statistics for phenomenon that have no stochastic component? 19/n 

Some extremely helpful practical examples in seismology: PHSA models that are based on metaphors instead of actual physics 20/n 


Helpful example: issues with a model used to explain wind turbine interactions with birds resulting in a type III error 21/n 


Helpful example: modeling whether women are more likely to be interrupted in academic talks and how the chosen model resulted in a type III error 23/n 


Helpful example: the issue with all the models used in the many analysts, one dataset study and how this was also a type III error 24/n 


Some general remarks about models #statstwitter 

• • •
Missing some Tweet in this thread? You can try to
force a refresh


