
The NHS has more funding and more staff than it had pre-pandemic. At the same time, across most types of care, the NHS is treating fewer patients than it was pre-Covid and is clearly struggling heading into the winter.
What's going on? A thread, based on new @TheIFS research 🧵
What's going on? A thread, based on new @TheIFS research 🧵
The full report, co-authored with my colleague Max Warner, can be found here. It focuses on the NHS in England, and uses only publicly available data.
ifs.org.uk/publications/n…
ifs.org.uk/publications/n…
The short version is: this is a puzzle without a single or simple explanation. Covid-19 is clearly having lasting adverse impacts on the health system. The real risk is that these lingering Covid effects continue to hinder NHS performance for months and years to come.
Here's the first key chart.
The NHS has considerably more hospital staff than it did pre-pandemic. Rates of sickness absence are (quite a lot) higher, but even after adjusting for that, there's 9% more consultants, 15% more junior doctors, and 8% more nurses than in 2019.
The NHS has considerably more hospital staff than it did pre-pandemic. Rates of sickness absence are (quite a lot) higher, but even after adjusting for that, there's 9% more consultants, 15% more junior doctors, and 8% more nurses than in 2019.

That's a big change! For context, the number of full-time equivalent nurses grew by just 3% between 2010 and 2019. And it's increased by 8% in three years since 2019, even after adjusting for the fact that more days are now lost to sickness absence.
As well as more (hospital) staff, the NHS also has more funding than it did pre-pandemic. That being said, inflation is eating into the real-terms value of that funding, making it less generous than originally intended. I'll deal with that in a separate thread.
But despite more funding and more staff, across almost all major types of care, the NHS is treating fewer patients than it was at the same point in 2019: in the latest month, 14% fewer emergency admissions, 14% fewer outpatient appointments, and 11% fewer elective admissions.
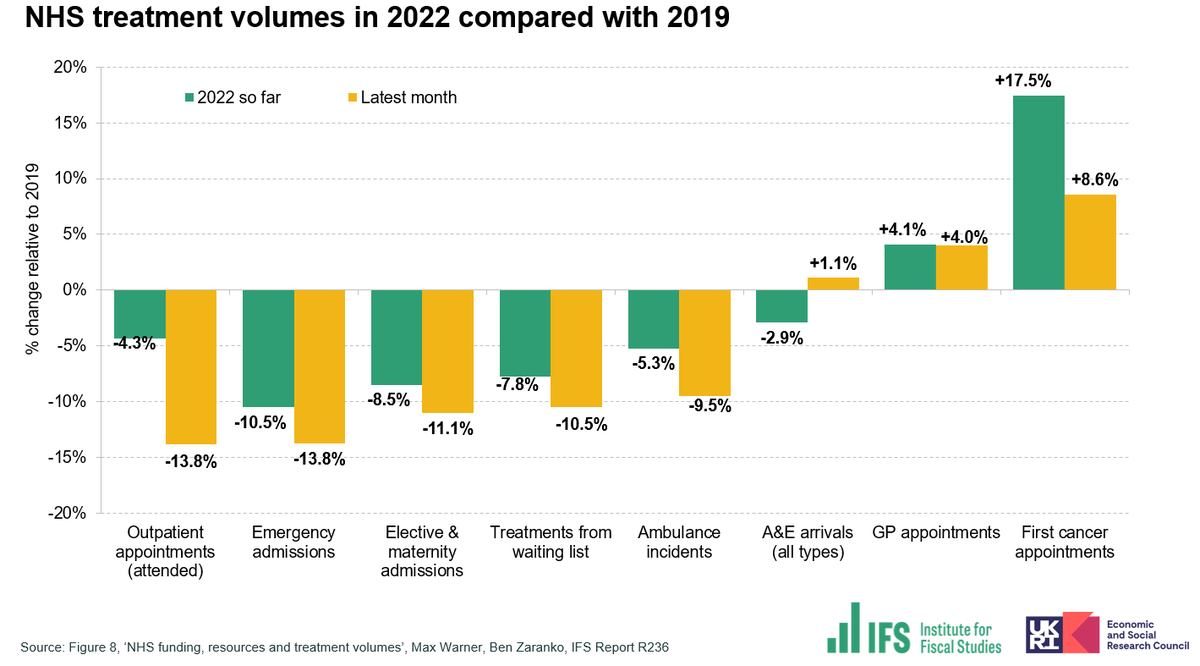
The NHS treated 7.8% fewer patients from the waiting list over the first 10 months of 2022 than it managed over the same period in 2019. I wrote about what that might mean for the backlog recovery plan here:
https://twitter.com/BenZaranko/status/1592424821417455618?s=20&t=KgEXqNyCBG8KmkVs4yi_Ag
Note, though, that the NHS is carrying out more GP appointments than it was in 2019, despite a 2% reduction in GP numbers. And, the number of first cancer appointments is substantially up on pre-pandemic levels. We shouldn't lose sight of these successes.
Nonetheless, on the face of it, something doesn't add up. There's more staffing, and more funding, but fewer patients are getting treated. So what's going on?
Perhaps the most convincing partial explanation is that although the total number of NHS hospital beds has returned to pre-pandemic levels, the *number of beds available for non-Covid activity* in the third quarter of 2022 was still lower than pre-pandemic.
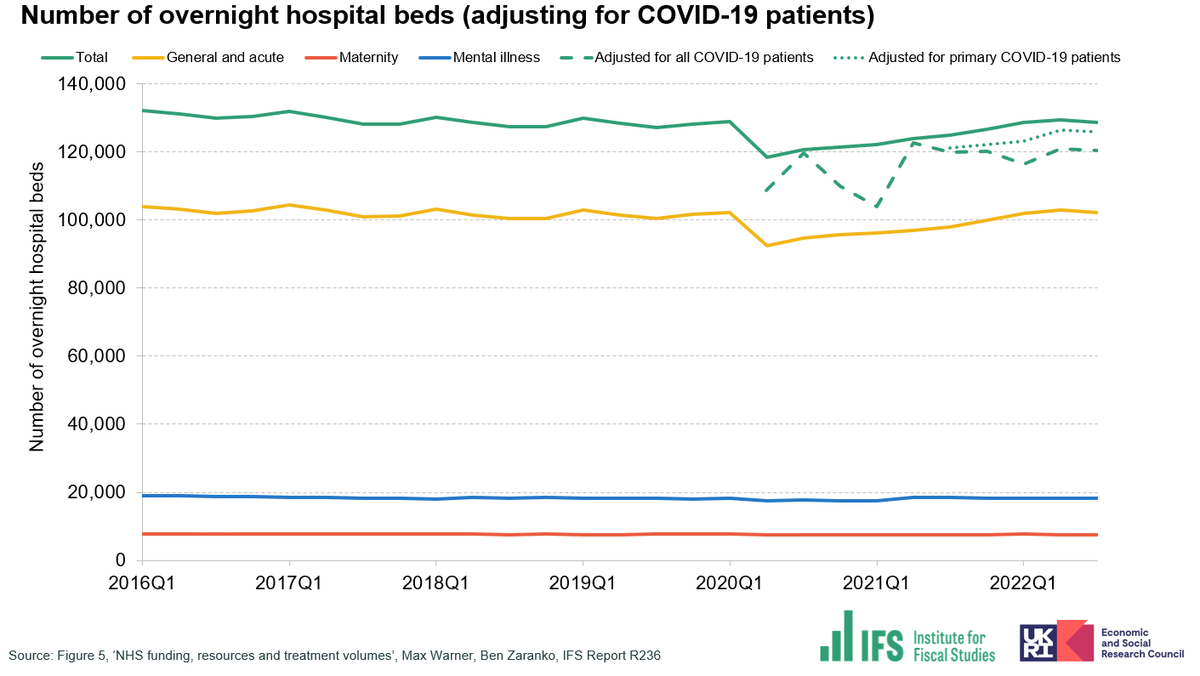
In other words, after adjusting for the fact that there's a load of beds filled with Covid patients, there's just fewer beds available to treat everybody else. (Between 1% and 5% fewer, depending on how you measure it and which Covid patients you adjust for).
That shortage of beds wouldn't necessarily explain why the number of outpatient appointments has fallen by so much, or why the NHS is managing fewer non-admitted waiting list pathways, but it has to be part of the explanation.
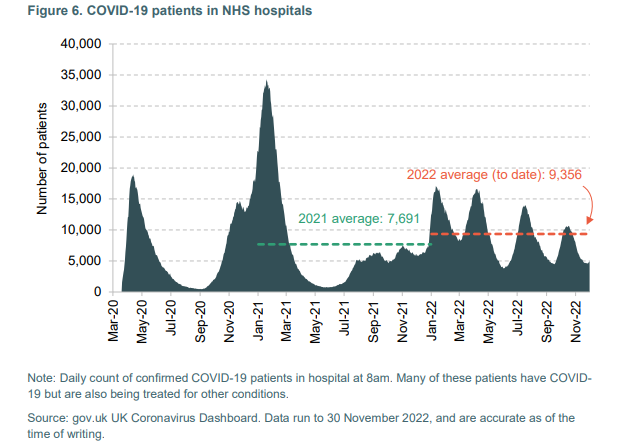
It's worth remembering that the average number patients in NHS hospitals with Covid-19 in 2022 has been higher than in 2021. I think it's easy to lose sight of that.
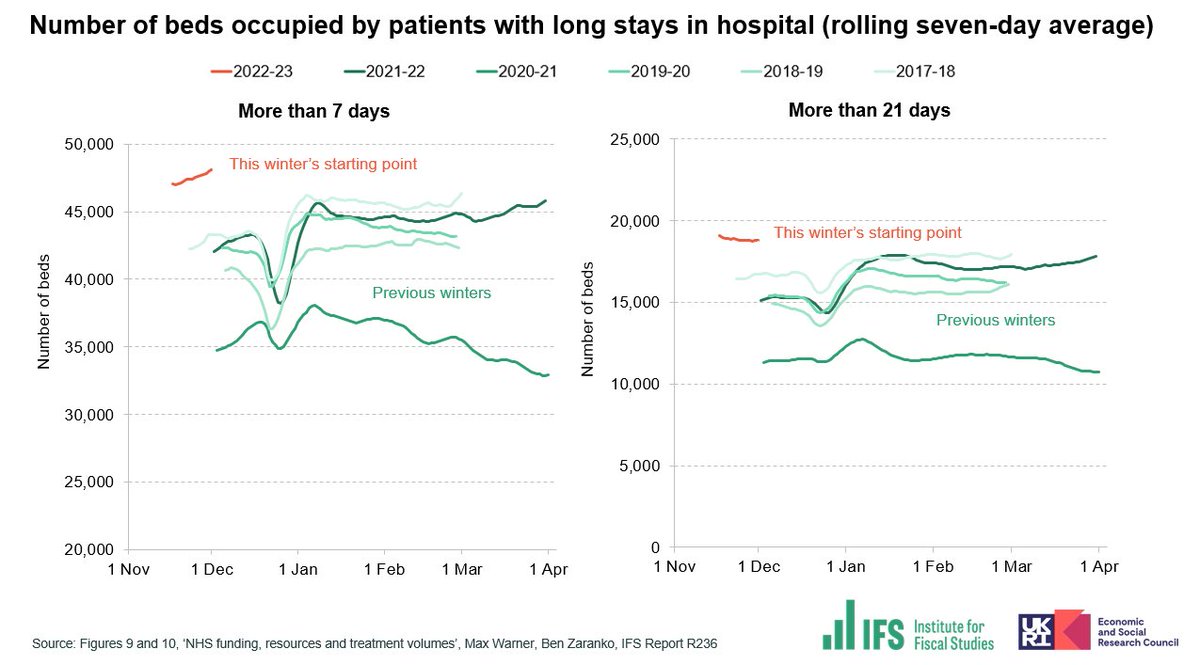
Moving on from the direct impacts of Covid, there are clear signs that the NHS is struggling to discharge hospital patients out into the community or social care, which further clogs up the system and acts as a drain on staff resources.
One symptom of that: the number of beds occupied by patients who have been in hospital for more than 7 days is 14% higher than at this point last year. The number occupied by patients who have been in for more than 21 days is 24% higher.
And, the official data suggest that in the first week of December, around 40% of those in hospital for more than 21 days were ready for discharge, compared with 34% at the same point in 2021. Even if the data is dodgy, the direction of travel is clear.
https://twitter.com/LawrenceDunhill/status/1597901213680676866?s=20&t=KgEXqNyCBG8KmkVs4yi_Ag
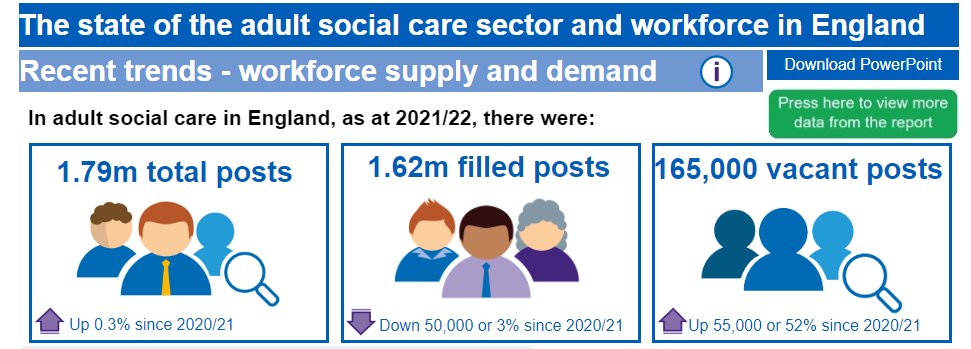
Delayed discharges are not just a social care problem. But it is worth noting that the adult social care workforce in England shrank by 3% last year, with a 52% increase in vacancies. The sector clearly has capacity problems.
skillsforcare.org.uk/adult-social-c…
skillsforcare.org.uk/adult-social-c…
It's also possible that a general worsening of population health - evident in the rising number of disability benefit claimants for a broad range of health conditions - is increasing the number of patients requiring complex, resource-intensive treatment.
https://twitter.com/TomWatersEcon/status/1600486502261194752?s=20&t=EAeYqOSF7He4XBMEZrfgeg
So, even if the NHS is treating fewer *individual patients*, if those patients are sicker on average and require more intensive treatment, it could be that the NHS is providing a greater amount of care than a simple focus on treatment volumes would suggest.
This is not an exhaustive list of possible explanations. We explore some others (changes to working hours, staff productivity, management, the quality of the NHS estate) in the report. There's only so much we can do with public data, but we've had a go.
ifs.org.uk/publications/n…
ifs.org.uk/publications/n…
Our broad conclusion: it's possible that Covid has dealt a permanent, adverse hit to NHS performance, leaving the health service able to treat fewer patients from a given level of resources. This is not inevitable, but there are worrying signs pointing in this direction.
Remember, the UK has suffered an adverse economic shock that makes us poorer as a country. A weaker outlook for the economy, combined with higher levels of debt interest spending, means that providing a given level of public service funding will likely require higher taxes.
So, any given increase in NHS funding is now more difficult to achieve – and persistent Covid impacts mean we might have to expect the NHS to treat fewer patients with that funding. That's not inevitable, but would pose major challenges for health and fiscal policy.
A few follow ups:
@jburnmurdoch's very nice piece in the FT (£) today mentions this research, and (as ever) includes some great charts:
ft.com/content/2ee165…
@jburnmurdoch's very nice piece in the FT (£) today mentions this research, and (as ever) includes some great charts:
ft.com/content/2ee165…
Another article in the FT (£), this time by @CamCavendish, also mentions our work, and is also very much worth reading:
ft.com/content/0938a2…
ft.com/content/0938a2…
And this interesting piece by Emma Duncan in the Times (£) on NHS management cites our research:
thetimes.co.uk/article/its-a-…
thetimes.co.uk/article/its-a-…
Thanks to everyone who shared this thread, which Twitter tells me has been seen more than 850,000 times (!). Particular thanks to frontline staff sharing their perspectives in the replies, which are always useful to outside observers like ourselves.
(Full disclosure: only 3% of the 850,000 made it to the end).
An interesting thread, with a theory that seems plausible. We did briefly consider this in the report, but it is (almost by definition) difficult to prove in the data.
https://twitter.com/Dr_JSA/status/1604090511693840396?t=2D-8ug1O6deB9x_13e6usw&s=19
• • •
Missing some Tweet in this thread? You can try to
force a refresh


