Many Manchester United supporters are unhappy with their team's low 'defensive line height' metric. There are some narratives based on data from markstats.club so I feel I owe you a thread 1/
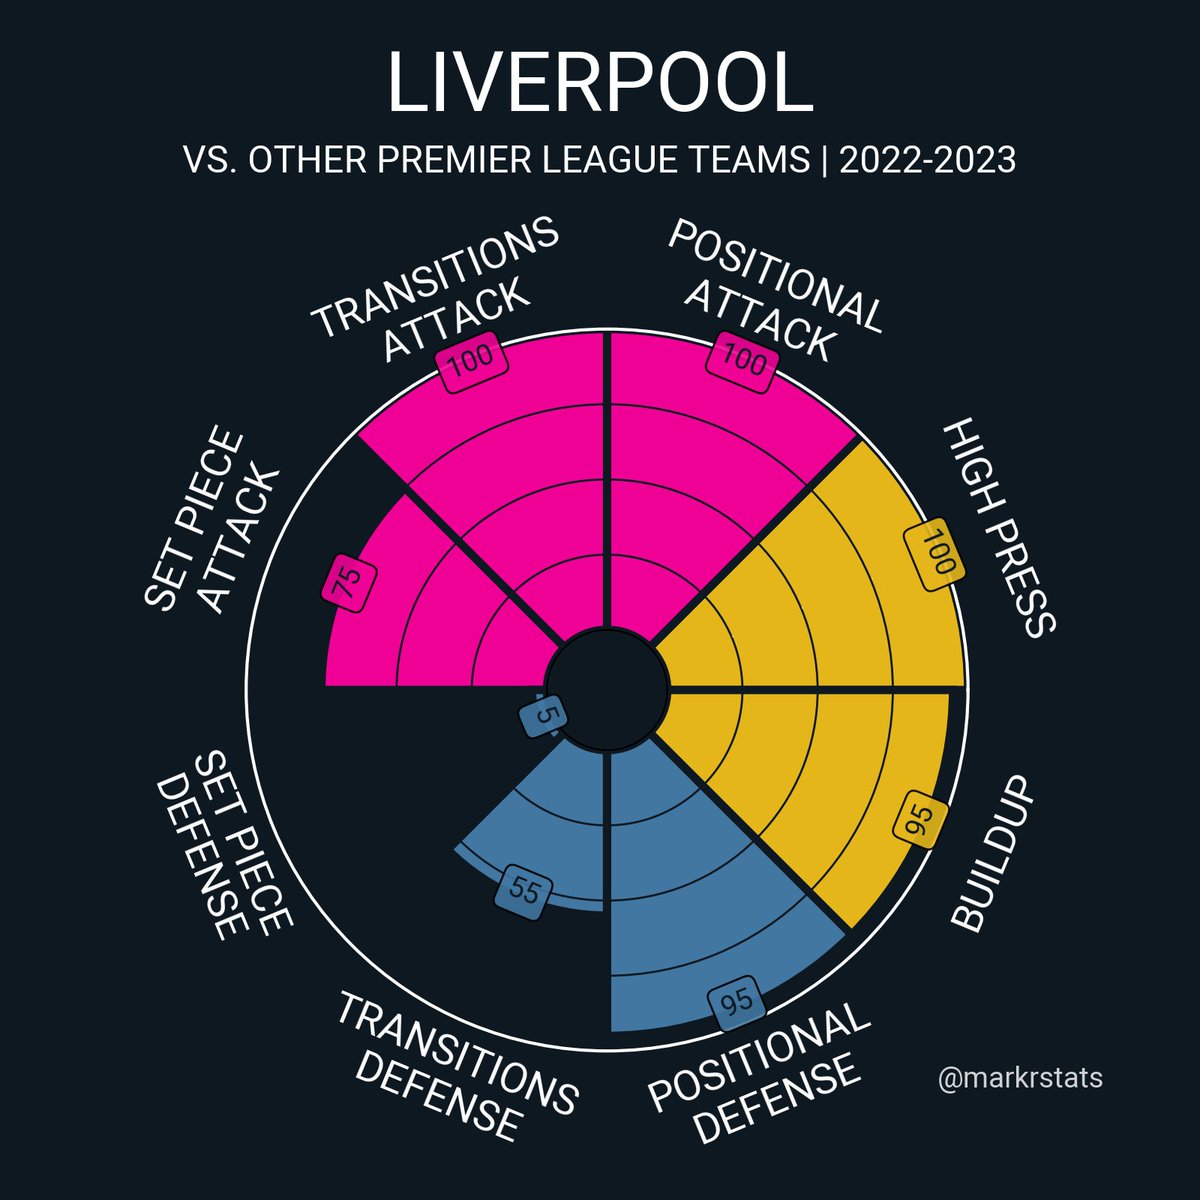
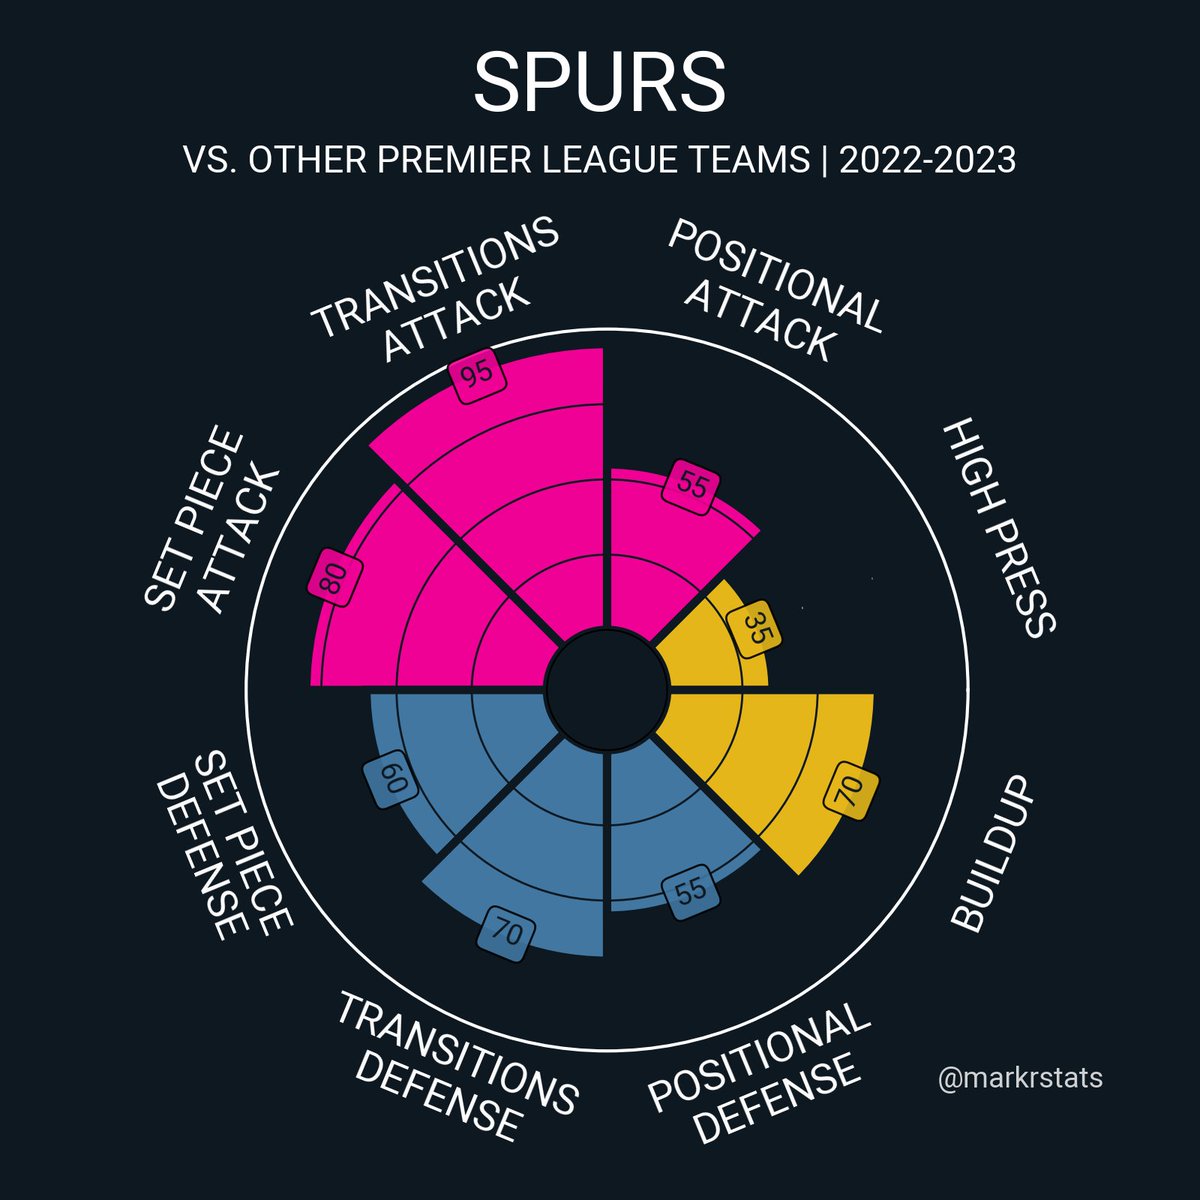
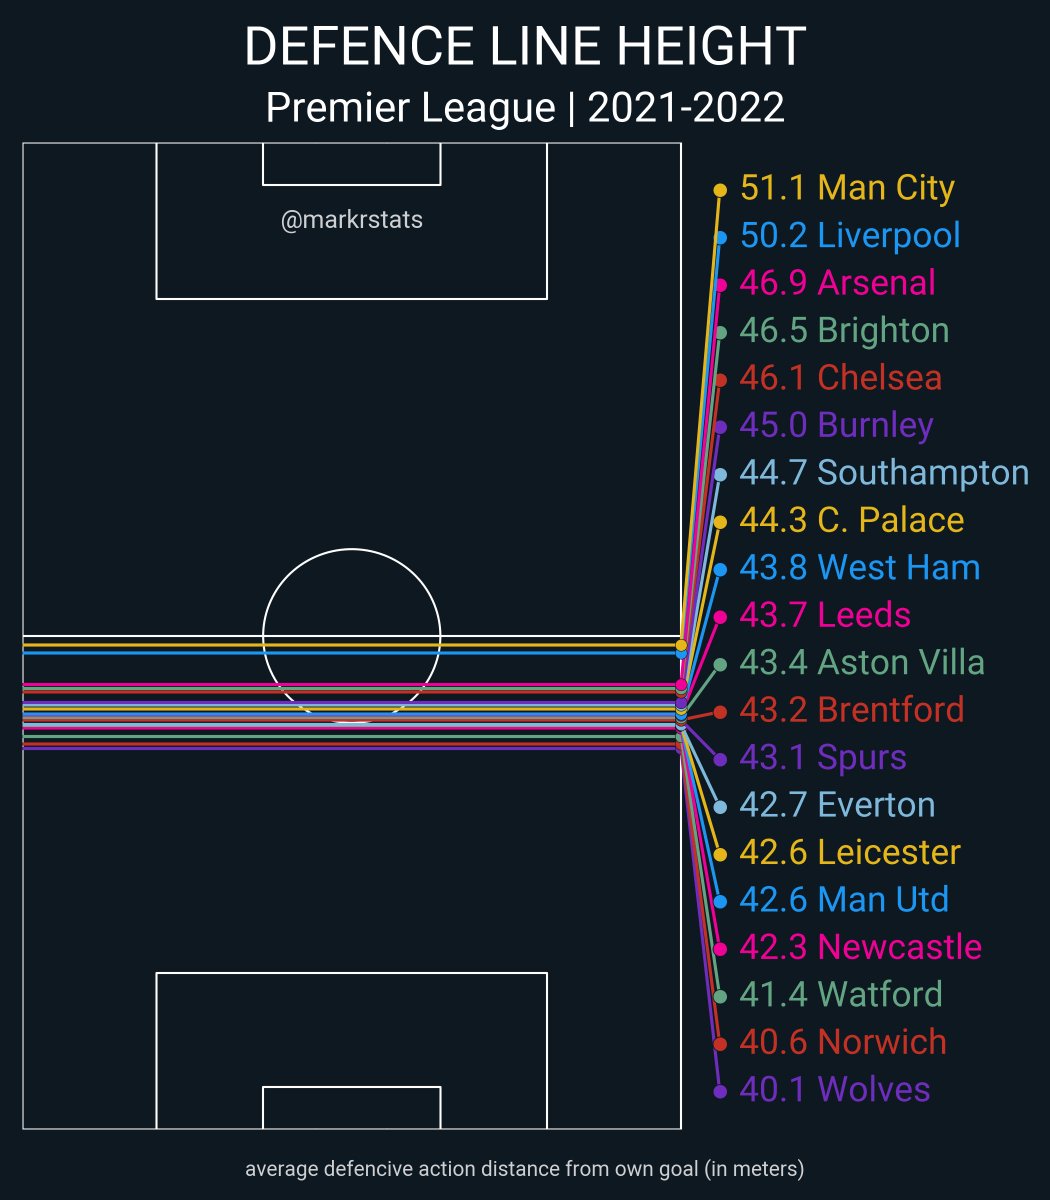
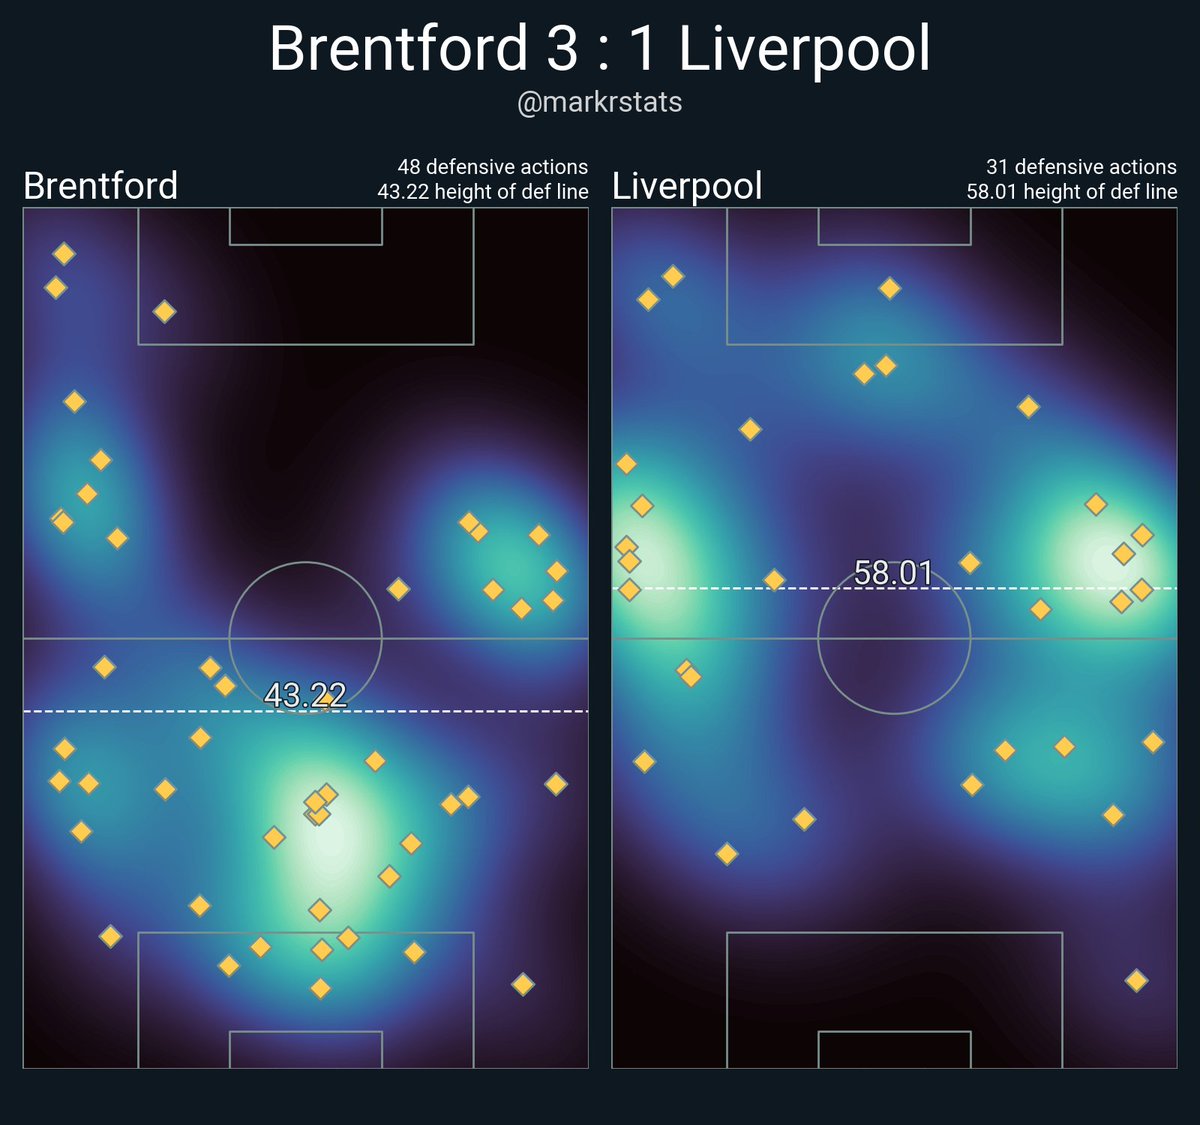
‘Def line height’ calculated as an average distance of all defensive actions (such as tackles and interceptions) to the team's own goal. Sides like Brentford are able to switch between high press and low block, which leads to pretty average 'def line height' numbers 2/
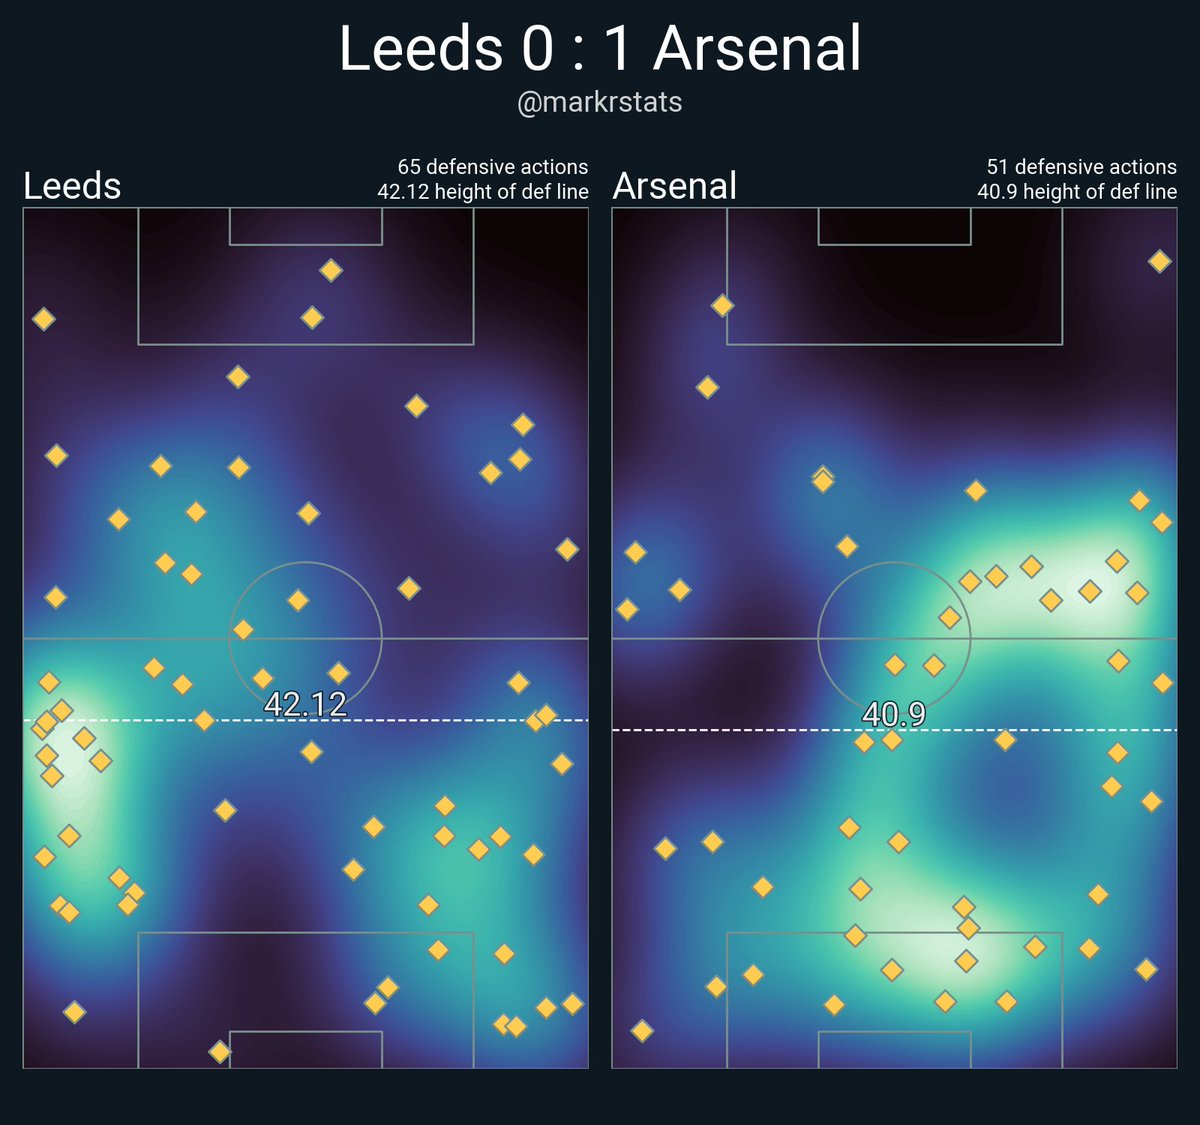
Game state also impacts 'def line height' as even dominant sides tend to defend closer to own goal when winning 3/
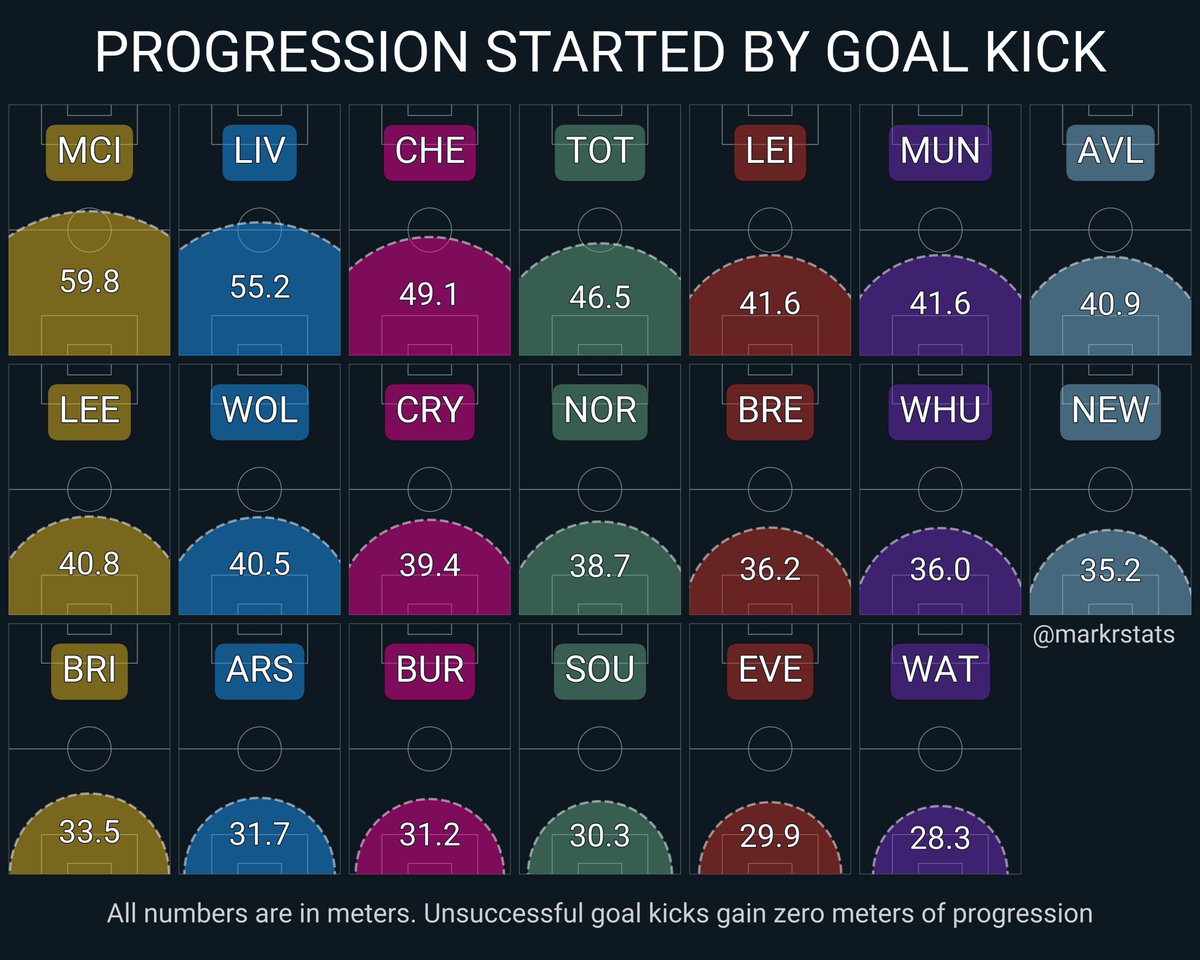
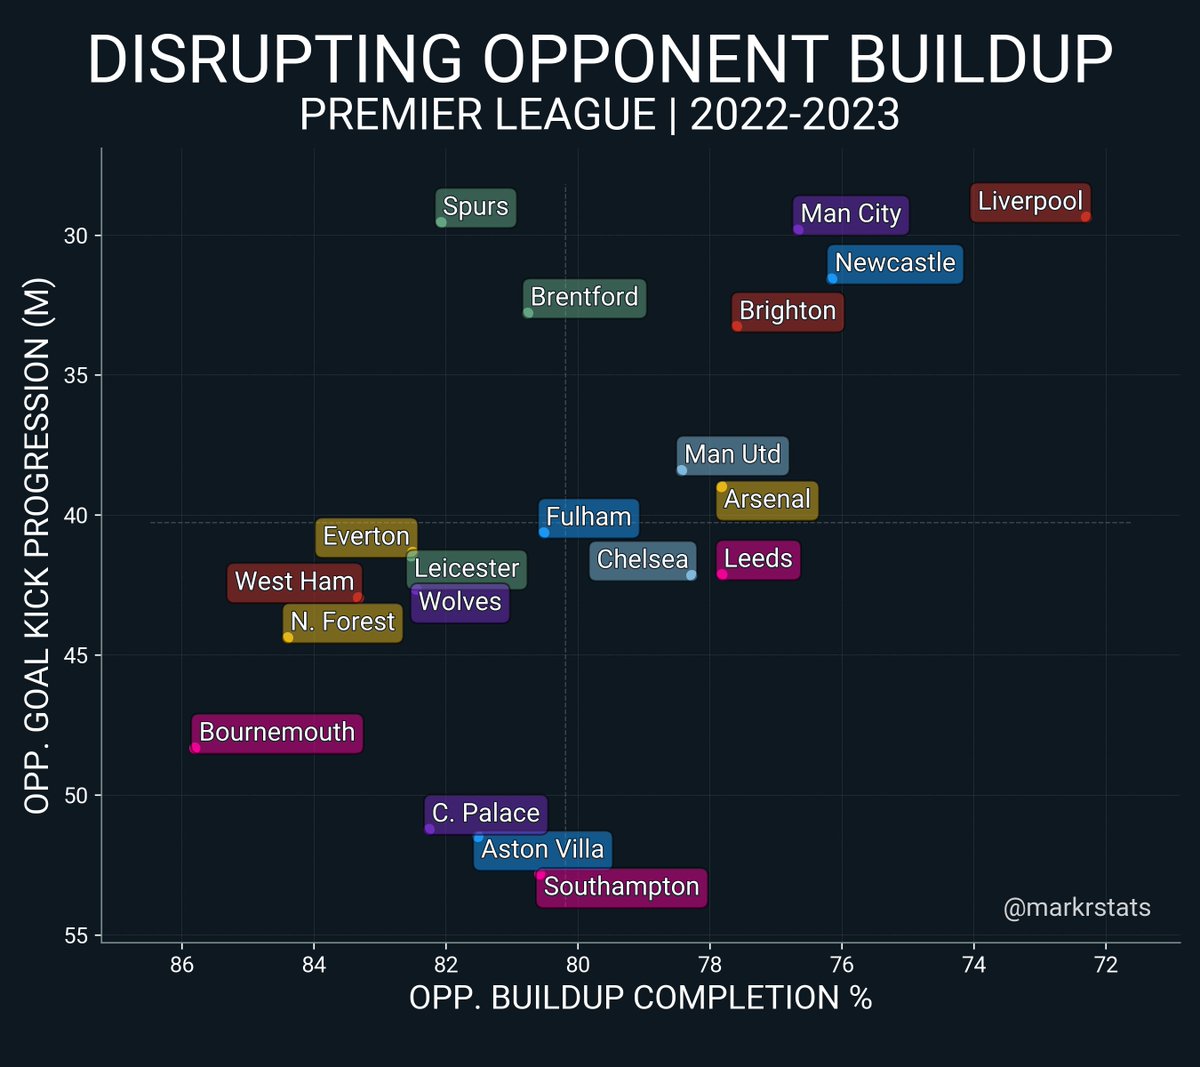
I try combining multiple metrics for high-press analysis. For example 'opponent pass completion outside of the final third' and 'opponent ball progression from the goalkick' could give an additional context of team's press efficiency
P.S. Man United isn't doomed after all
• • •
Missing some Tweet in this thread? You can try to
force a refresh
Let's shift our focus from ball progression to retention. This graph displays PL 23/24 central midfielders. The top right corner of the scatter plot highlights "Possession Anchors" - players who excel at receiving progressive passes while consistently retaining possession [1/5]
It’s no surprise to see Rodri, Bissouma + Brighton midfielders in the top-right corner. These players epitomize the profile we’re studying: comfortable receivers between the lines, often back to goal, acting as so-called "metronomes" rather than primary ball progressors [2/5]
Interestingly, Liverpool, who might resemble Brighton's style next season, already has two ”Possession Anchors”. Curtis Jones and Mac Allister are both comfortable fulfilling the role Arne Slot demands from his double pivot [3/5]
An attempt to assess team performance splitting by phases of play: positional attack/defense, set-piece att/def, transitional att/def, high press, buildup
The model believes Liverpool is the best PL side in terms of high press and non-set-piece attack
The biggest Man City strengths are their invincible defence and unbreakable buildup
Spurs are the second best PL side by attacking value gained within the first 15 seconds of possessions (aka 'transitions attack'). However they are pretty average at breaking low block (aka 'positional attack')
End of season is a perfect time to revisit old templates. Some of mine require updates but fine in general, others I will never use again, so it’s their last dance. Thread contains 10+ different visualizations for Premier League 21/22
1. Starting with two graphs which show average goalkick length and progression from goalkick for Premier League 21/22 teams
2. Average defensive line height of a Premier League team is 44.2 meters. Graph shows how far from own goal (in meters) PL teams registered their defensive action