Throwaway line in a thesis I'm reading got me thinking regarding adaptive effects of intermittent HIIT vs SIT vs continuous HIIT:
Is the *rate* of metabolic disruption important for adaptive signalling, independent from the magnitude of disruption? 🤔 ...
Is the *rate* of metabolic disruption important for adaptive signalling, independent from the magnitude of disruption? 🤔 ...

The former presumably being greatest at work bout onset, the latter being greatest at end
SIT would presumably induce the greatest onset flux
Intermittent HIIT (eg 30x15s) a high volume of onset events
While the end magnitude may be similar across all (ie iso-effort) ?
SIT would presumably induce the greatest onset flux
Intermittent HIIT (eg 30x15s) a high volume of onset events
While the end magnitude may be similar across all (ie iso-effort) ?
ok the more I think about this, the less 🤯 it seems
Consistent with what we know about intensity-dependence of eg. mito biogen
I think I just found a nice new-to-me perspective on training stimuli & adaptations, which I'm trying to understand better #thinkingoutloud
Consistent with what we know about intensity-dependence of eg. mito biogen
I think I just found a nice new-to-me perspective on training stimuli & adaptations, which I'm trying to understand better #thinkingoutloud
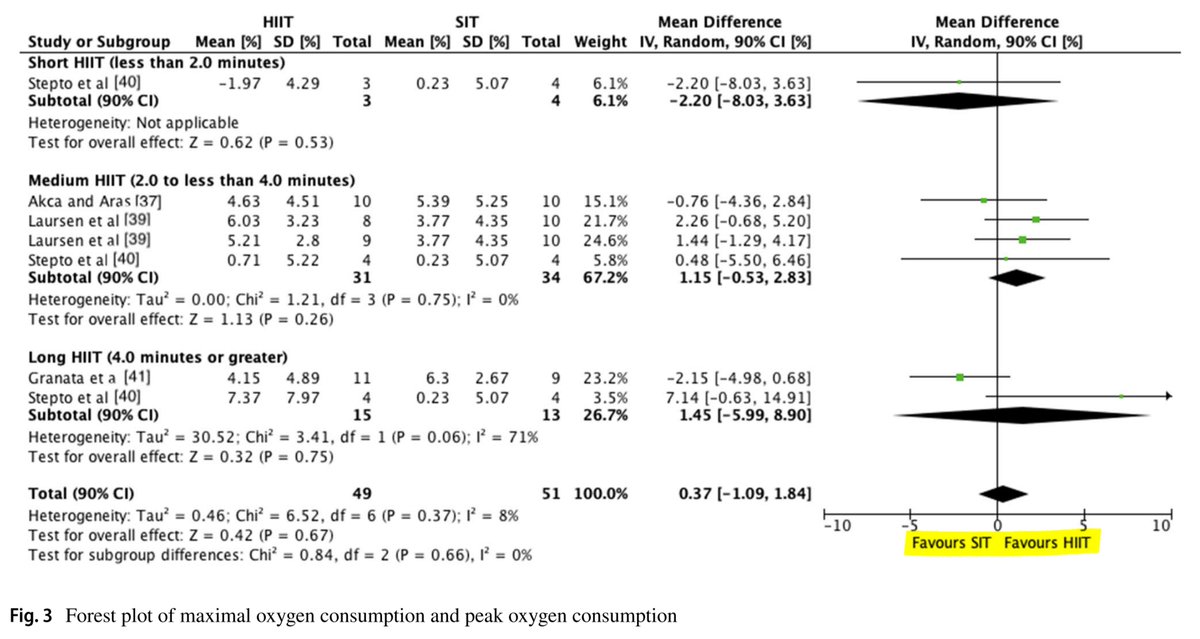
eg peripheral & central effects of HIIT & SIT, from my colleague's PhD thesis (not the thesis I was reading)
Where can I learn more?
tspace.library.utoronto.ca/handle/1807/10…
researchgate.net/profile/Michae…
Where can I learn more?
tspace.library.utoronto.ca/handle/1807/10…
researchgate.net/profile/Michae…

• • •
Missing some Tweet in this thread? You can try to
force a refresh


