RECESSION WATCH -- A short 🧵--
1) 10Yr/2Yr UST spread been inverted since 7 July '22 -
Persistent inversion has always led to recession...
1) 10Yr/2Yr UST spread been inverted since 7 July '22 -
Persistent inversion has always led to recession...

2) 40% of US banks have tightened lending standards -
This has always been followed by recession and current reading implies 7%+ corporate high yield default rate by year-end...
This has always been followed by recession and current reading implies 7%+ corporate high yield default rate by year-end...

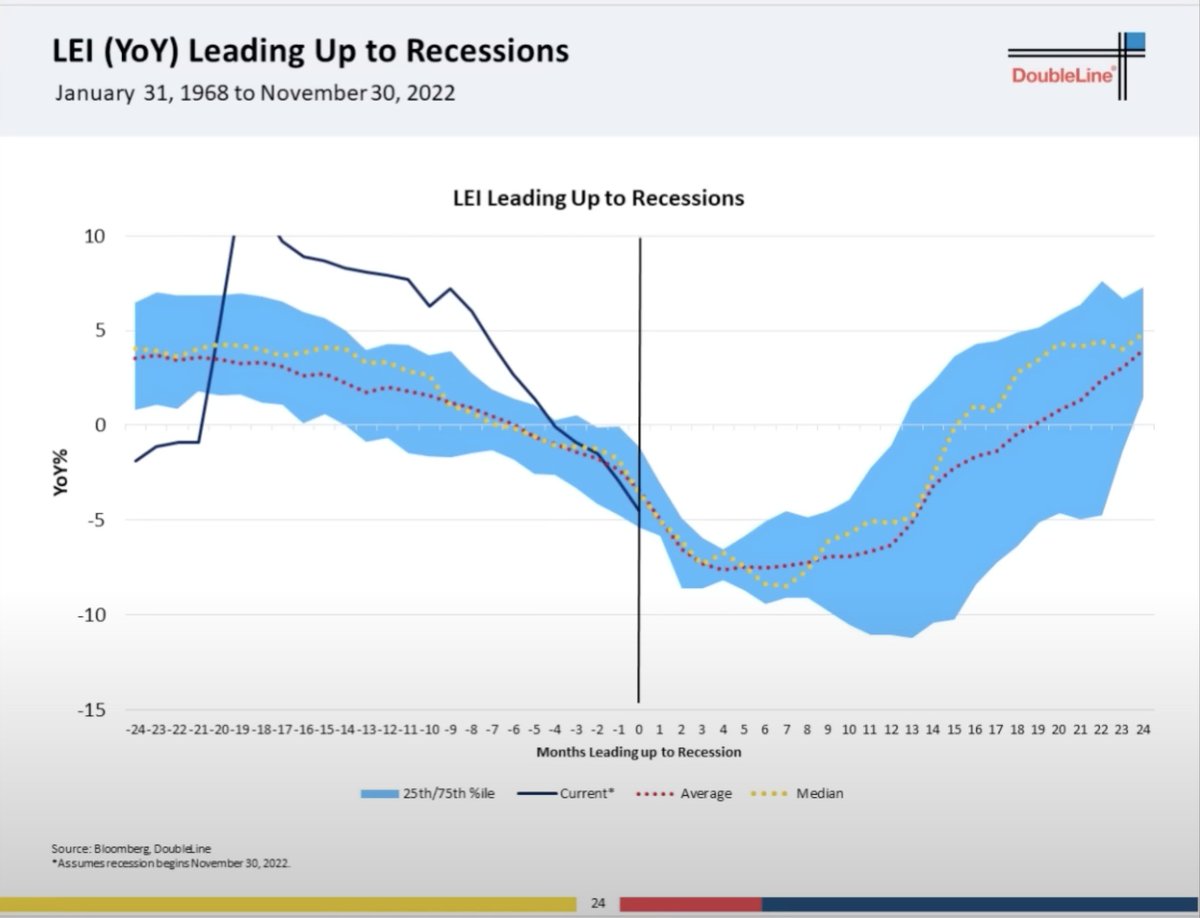
3) YoY change in US LEIs is deeply negative -
Prior cycles suggest we are a month away from the onset of recession...
Prior cycles suggest we are a month away from the onset of recession...
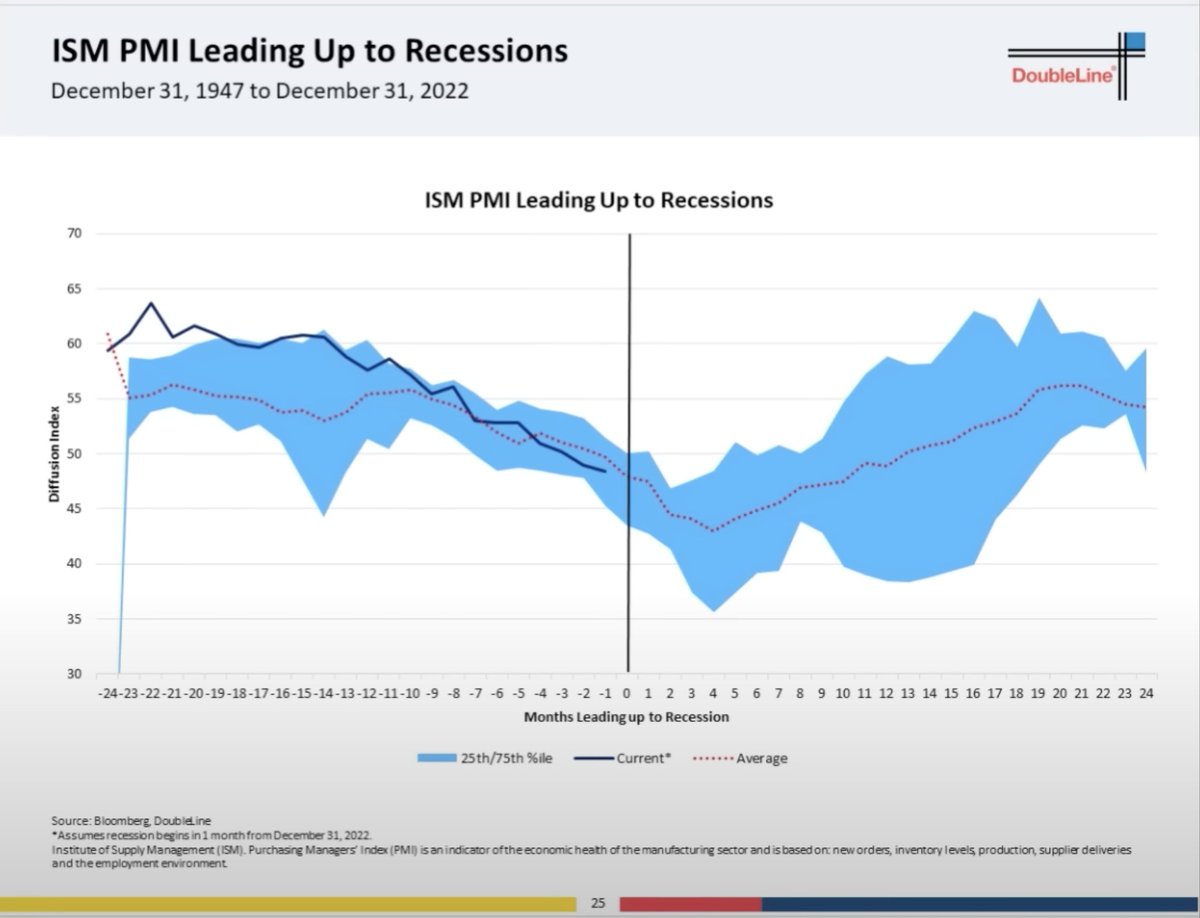
4) ISM PMI reading is recessionary -
Prior cycles suggest we are less than two months away from the onset of recession...
Prior cycles suggest we are less than two months away from the onset of recession...
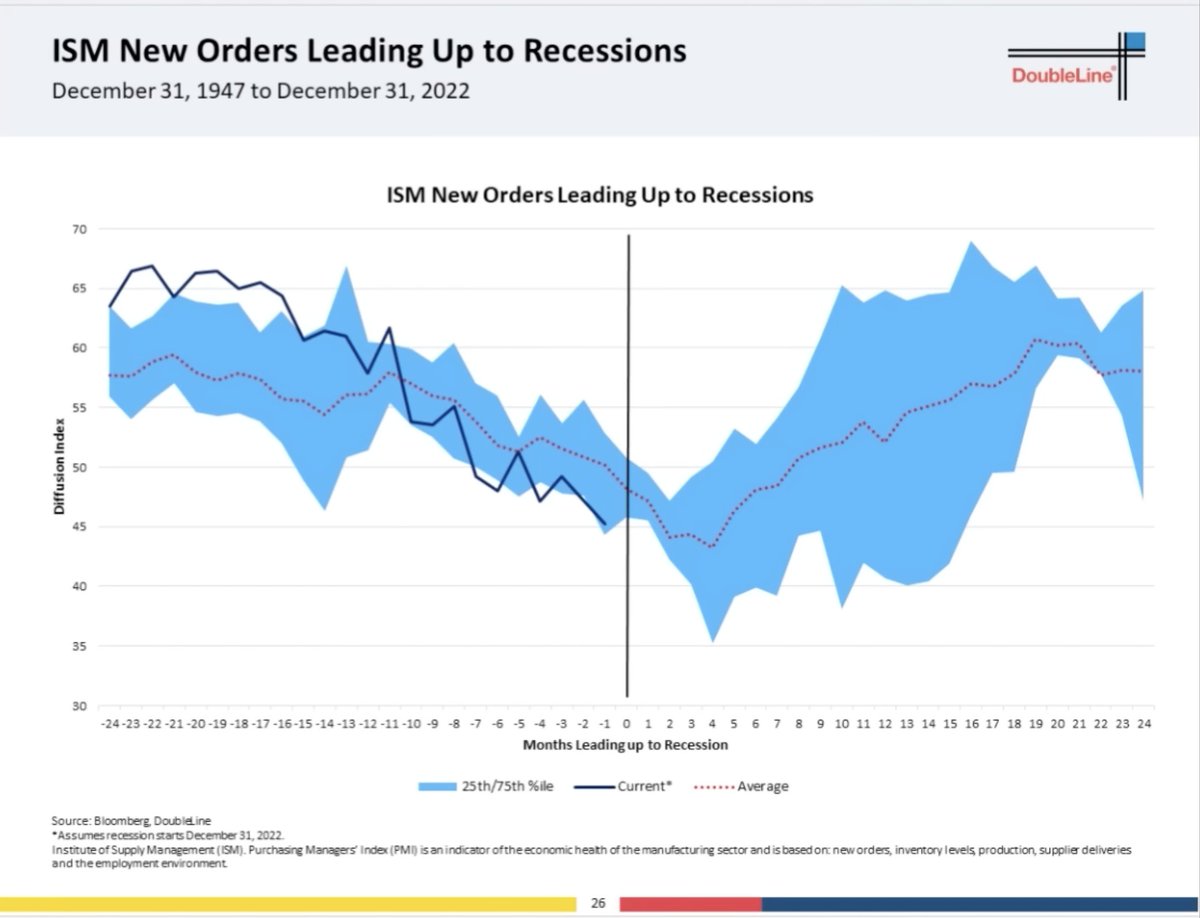
5) ISM New Orders in recessionary territory -
Prior cycles suggest we are less than two months away from the onset of recession...
Prior cycles suggest we are less than two months away from the onset of recession...
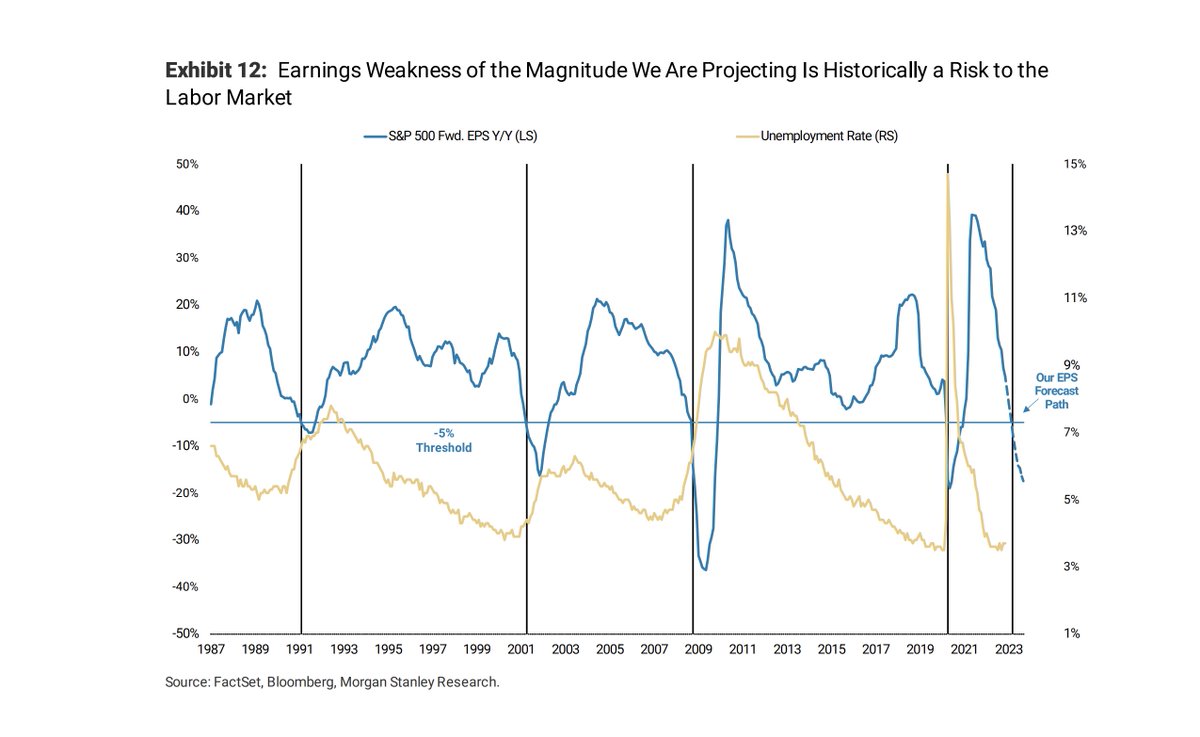
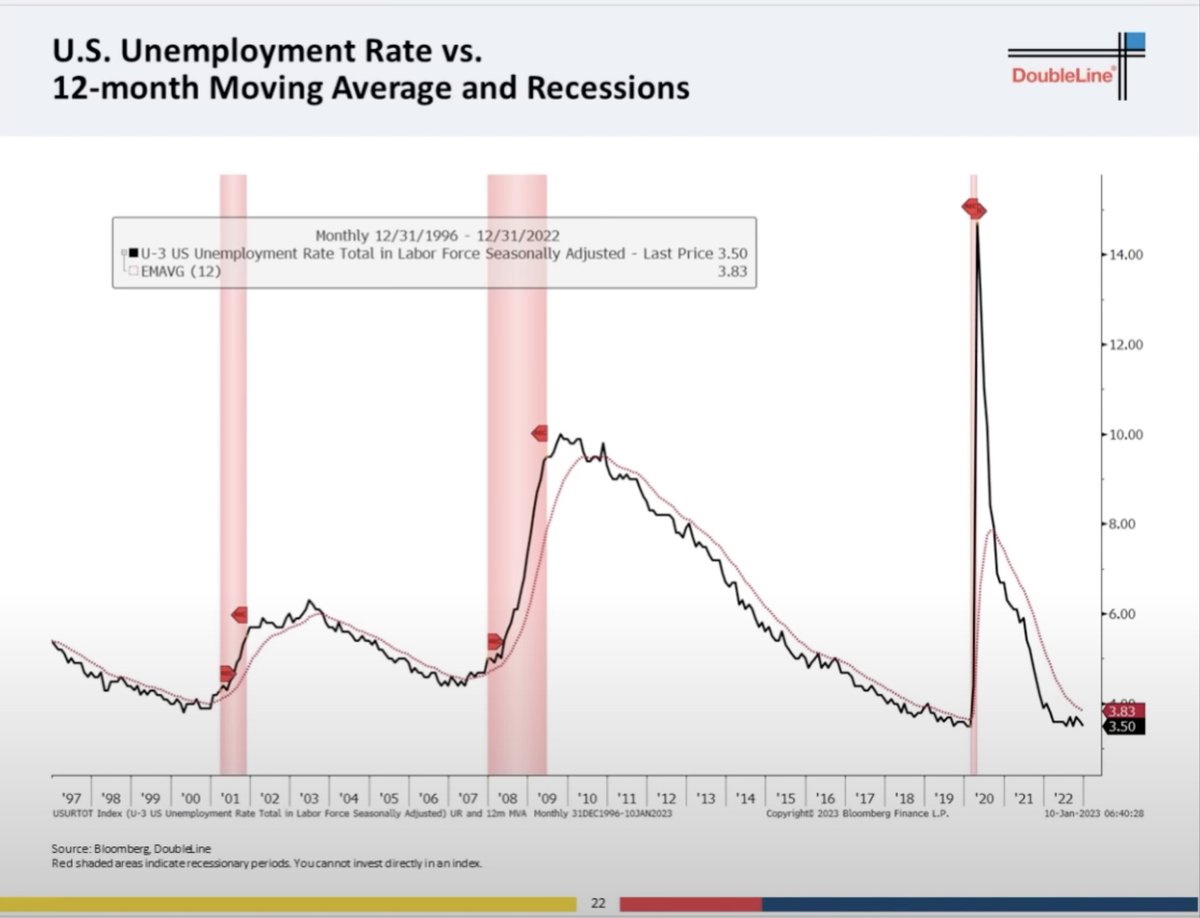
6) The US jobs market is the last man standing but cracks are emerging (in % of states with rising unemployment).
On watch for the unemployment rate to tick higher and when it crosses above its 12-month moving average, it should coincide with the onset of recession.
- END -
On watch for the unemployment rate to tick higher and when it crosses above its 12-month moving average, it should coincide with the onset of recession.
- END -
P.S - These macro indicators do work
In late 2019, similar indicators were forecasting a recession in spring 2020...
In late 2019, similar indicators were forecasting a recession in spring 2020...
https://twitter.com/saxena_puru/status/1180811060153970688?s=20&t=NJHOl_FdD3BirUkZkkj0Pg
• • •
Missing some Tweet in this thread? You can try to
force a refresh