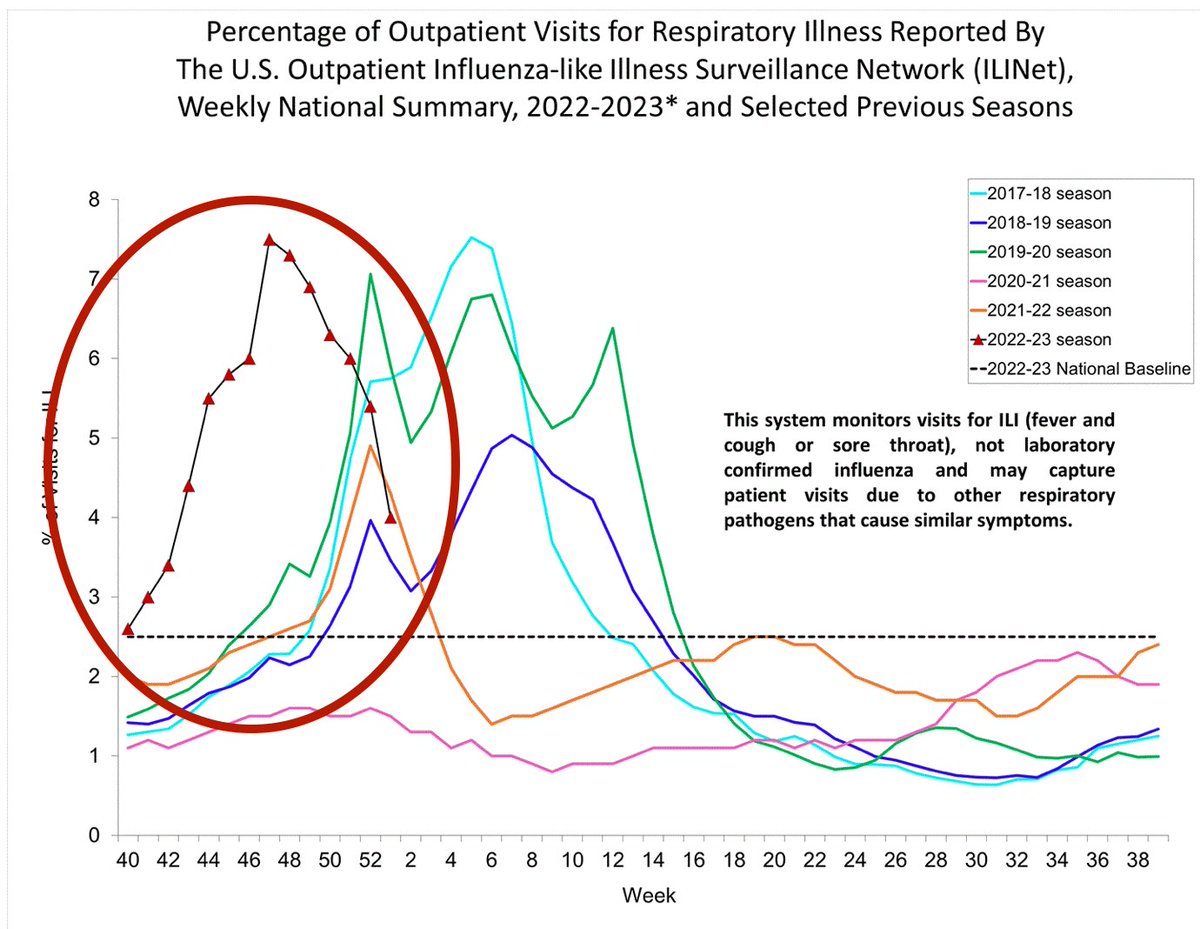
1. #Flu activity continues to decline across the US, though the percentage of outpatient visits for #influenza-like activity is hovering just over the epidemic threshold. There's always a chance of more flu, especially flu B, but for now the big wave is pretty much done.
A 🧵
2. #Flu outbreaks reported from long-term care facilities has dropped down considerably, a sign there's less flu circulating. Those are the folks who are most vulnerable, so this is a good thing.
3. The other highly vulnerable population is young kids. @CDCgov was notified of 6 additional pediatric #flu deaths in the week ending Jan. 28; they bring the season total to 97 so far. Sad to see pediatric flu deaths heading back towards pre-Covid levels.
(chart=mine)
4. I can't stress how odd it is to see #flu season wrapping up this early in the winter. The map on the left was week 4 in 2017-18, a bad flu season. The map on the right is this year. New York City, Oklahoma & New Mexico are the flu holdouts.
FluView: cdc.gov/flu/weekly/

• • •

Missing some Tweet in this thread? You can try to force a refresh
 

Keep Current with Helen Branswell 🇺🇦

Helen Branswell 🇺🇦 Profile picture

Stay in touch and get notified when new unrolls are available from this author!

Read all threads

This Thread may be Removed Anytime!

PDF

Twitter may remove this content at anytime! Save it as PDF for later use!

Try unrolling a thread yourself!

how to unroll video
  1. Follow @ThreadReaderApp to mention us!

  2. From a Twitter thread mention us with a keyword "unroll"
@threadreaderapp unroll

Practice here first or read more on our help page!

More from @HelenBranswell

Jan 27
1. A #flu 🧵:
Activity continued its sharp decline in the week ending Jan 21. It's barely over the epidemic threshold at this point nationally; in 6 regions it's below it. But for the fact that we've seen little #fluB activity, it would be tempting to guess flu season is over. Image
2. But virtually all — 99.5% — of the #flu activity so far this season has been caused by flu A. There hasn't been much flu B since the first half of the 2019-20 season. In the Before Times, it was common to see flu B in late winter, early spring. This year? Ask me in June.
3. This #flu season took off like a bat outta hell in October, peaking Thanksgiving week. Activity reached a high apex, but the drop off has been swift. The image on the left shows #influenza-like illness the week ending Jan. 7. On the right, the week ending Jan. 21. ImageImage
Read 7 tweets
Jan 20
1. Time for a #flu 🧵
#Influenza A, which started circulating at high levels earlier this season than in any season since the 2009 #H1N1 pandemic, is declining as quickly as it climbed. In several parts of the country, doctor visits for flu-like illness are below epidemic levels.
2. It is truly remarkable to see the map of #flu-like activity show so little red in the 2nd week of Jan. It is like this year's flu season shifted forward 2 months or so.
Last week on the left. Same week in 2018, on the right, as the 2017-18 season started to take off.
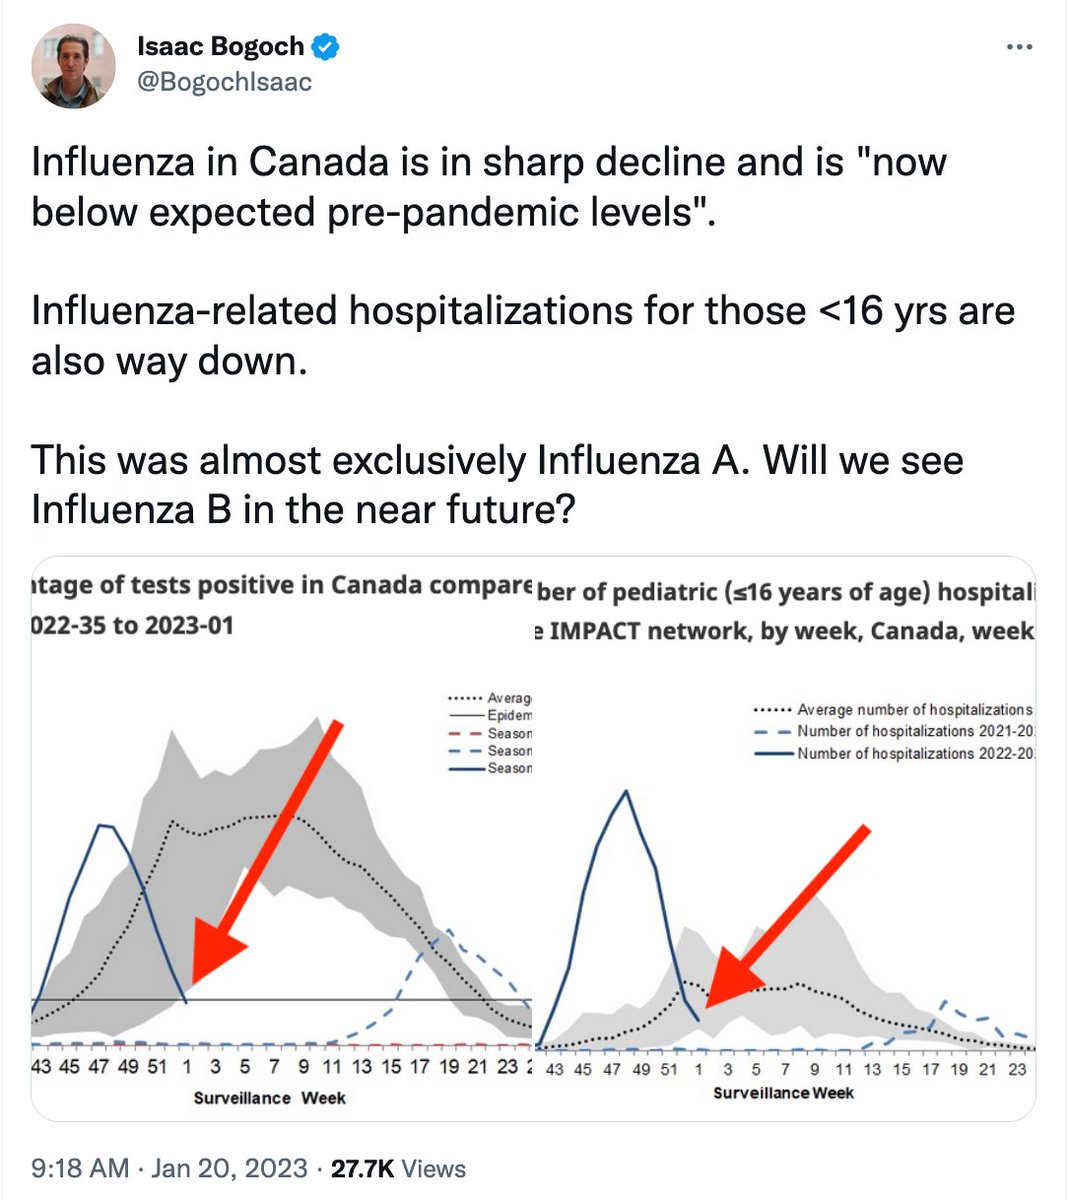
3. Canada is seeing the same phenomenon, reports @BogochIsaac, who raises a key question: Virtually all the #flu activity so far has been #influenza A. Do we have a flu B wave in store? Pre-Covid, flu B often hit late in the season, after flu A had moved through. Will it this yr?
Read 7 tweets
Jan 13
1. A #flu 🧵
Flu activity continues to decline in most parts of the US.
Virtually all of the flu transmission so far has been influenza A, which means we could get some flu B activity later, in a smaller wave. That was not uncommon in flu years pre-Covid.
2. Then again, some years there's a single, sharp wave of flu activity and once it's done, we're done. That's what happened in 2017-2018, which was a severe flu season. (This season, so far, has not been a severe season. It has been an unusually early season.)
3. Five more kids have died from #flu, bringing the total to 79 to date. That's a shock after the first 2 years of the Covid pandemic when only 45 pediatric flu deaths were reported.
But 79 is still low compared to pre-Covid years. The big year (left) was the H1N1 pandemic.
Read 6 tweets
Jan 6
1. A #flu thread:
US activity continued to decline in the week ending Dec. 31. The current wave of flu — caused exclusively by flu A viruses — has peaked. In pre-Covid times, it was common to see a second peak with flu B late in the season, March-ish. Will that happen in 2023? 🤷‍♀️
2. Another 13 children have died from #flu this year. These deaths bring the 2022-23 total to 74. Too high, but still low by pre-Covid standards, when 100 to 200 pediatric deaths were reported/year. The new deaths occurred over 9 weeks but were reported to @CDCgov last week.
3. The drop off in outpatient visits for #influenza-like illnesses has been happening primarily in kids, teens & young adults, the age groups that have fueled this fall & early winter's sharp peak of #flu activity.
Read 5 tweets
Dec 30, 2022
1. A short #flu tweet:
While flu activity remains high around the US, the decline that began a few weeks ago continues. 6.1% of visits to HCPs for the week ending Dec. 24 were for #influenza-like illnesses, down from 6.3% the previous week. Image
2. The percentage of long-term care facilities reporting #flu outbreaks has also dropped off a little, which is a very good piece of news. Image
3. The bad news: 14 more children have died from #influenza this #flu season. The deaths occurred over the past 6 weeks but were reported to @CDCgov last week. So far this season 61 kids have died from flu. An awful toll, but still low compared to most pre-Covid years. Image
Read 5 tweets
Dec 16, 2022
1. It's Friday. Let's talk #flu.
Gonna keep this short because I wrote a story about what today's FluView report from @CDCgov shows. You can read that piece here.
statnews.com/2022/12/16/ear…
2. Nine more children have died from #flu this season; the total to-date is 30. That's number will rise; but it's still well below the total of most pre-Covid flu seasons. Still, as @CDCgov's Lynnette Brammer told me today: “We never like to see that number go up.” Image
3. You can see here how visits to health care providers for #influenza-like illnesses has declined over the past two weeks. You can also see some seasons have a couple of peaks. What will this one look like? Ask me in June. Image
Read 5 tweets

Did Thread Reader help you today?

Support us! We are indie developers!


This site is made by just two indie developers on a laptop doing marketing, support and development! Read more about the story.

Become a Premium Member ($3/month or $30/year) and get exclusive features!

Become Premium

Don't want to be a Premium member but still want to support us?

Make a small donation by buying us coffee ($5) or help with server cost ($10)

Donate via Paypal

Or Donate anonymously using crypto!

Ethereum

0xfe58350B80634f60Fa6Dc149a72b4DFbc17D341E copy

Bitcoin

3ATGMxNzCUFzxpMCHL5sWSt4DVtS8UqXpi copy

Thank you for your support!

Follow Us on Twitter!

:(