
#aspnet starter kit 🔭 - Observability
- If you can't measure it, you can't improve it.
Do you know how well your app is doing?
What's the average CPU usage, or what endpoints are called most often?
Metrics answers it all.
Let's see how we can achieve that easily 👇
#dotnet
- If you can't measure it, you can't improve it.
Do you know how well your app is doing?
What's the average CPU usage, or what endpoints are called most often?
Metrics answers it all.
Let's see how we can achieve that easily 👇
#dotnet

1\ Understanding the behavior and performance of your ASP.NET Core application are critical for ensuring its reliability and availability.
With the right tools, you can monitor key performance indicators, track error rates, and resource utilization.
With the right tools, you can monitor key performance indicators, track error rates, and resource utilization.
2\ So what to measure exactly? 🤔
Everything. Any data can be viable and bring unique tech and business insights:
- System resources: RAM, CPU, Network, Disk, etc
- Endpoints: throughput, response time, error rate
- Status codes: 200, 500, etc
- Validation errors
Everything. Any data can be viable and bring unique tech and business insights:
- System resources: RAM, CPU, Network, Disk, etc
- Endpoints: throughput, response time, error rate
- Status codes: 200, 500, etc
- Validation errors
3\ The industry has seen various ways of achieving that, from in-house-made solutions to AppMetrics.
Now the de-facto standard for it is OpenTelemetry.
Now the de-facto standard for it is OpenTelemetry.
4\ OpenTelemetry is an amazing collection of tools, APIs, and SDKs that can help you measure the performance of your web apps. With OpenTelemetry you can instrument, collect, generate, and export metrics, logs, and traces to gain valuable insights into the behavior of your code.
5\ Why OpenTelemetry is a real deal⭐
- Open-source
- Standardized
- Vendor agnostic
- Tech agnostic (use it in any programming language or framework)
- Community
- Open-source
- Standardized
- Vendor agnostic
- Tech agnostic (use it in any programming language or framework)
- Community
6\ That might sound so cool, so how to integrate it into an existing #aspnet web application?
⭐A couple of NuGet packages
⭐Ten lines of code
Let's implement it. We're going to use OpenTelemeterty to collect metrics. Prometheus and Grafana to visualize it 👇
⭐A couple of NuGet packages
⭐Ten lines of code
Let's implement it. We're going to use OpenTelemeterty to collect metrics. Prometheus and Grafana to visualize it 👇

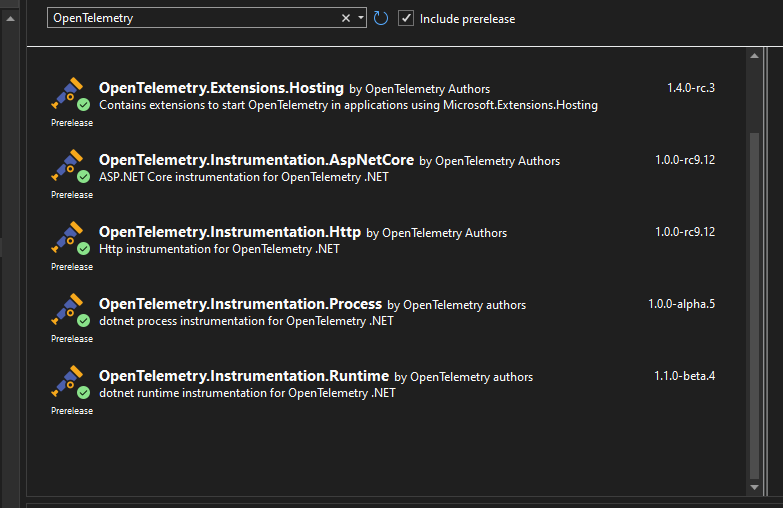
7\ That's the nuggets I use for this showcase.
But eventually, if you just search for OpenTelemetry you're going to find plenty more. Different instrumentation, exporters.
The controversial stuff - the ecosystem seems to be huge, but all of the packages are still pre-release
But eventually, if you just search for OpenTelemetry you're going to find plenty more. Different instrumentation, exporters.
The controversial stuff - the ecosystem seems to be huge, but all of the packages are still pre-release
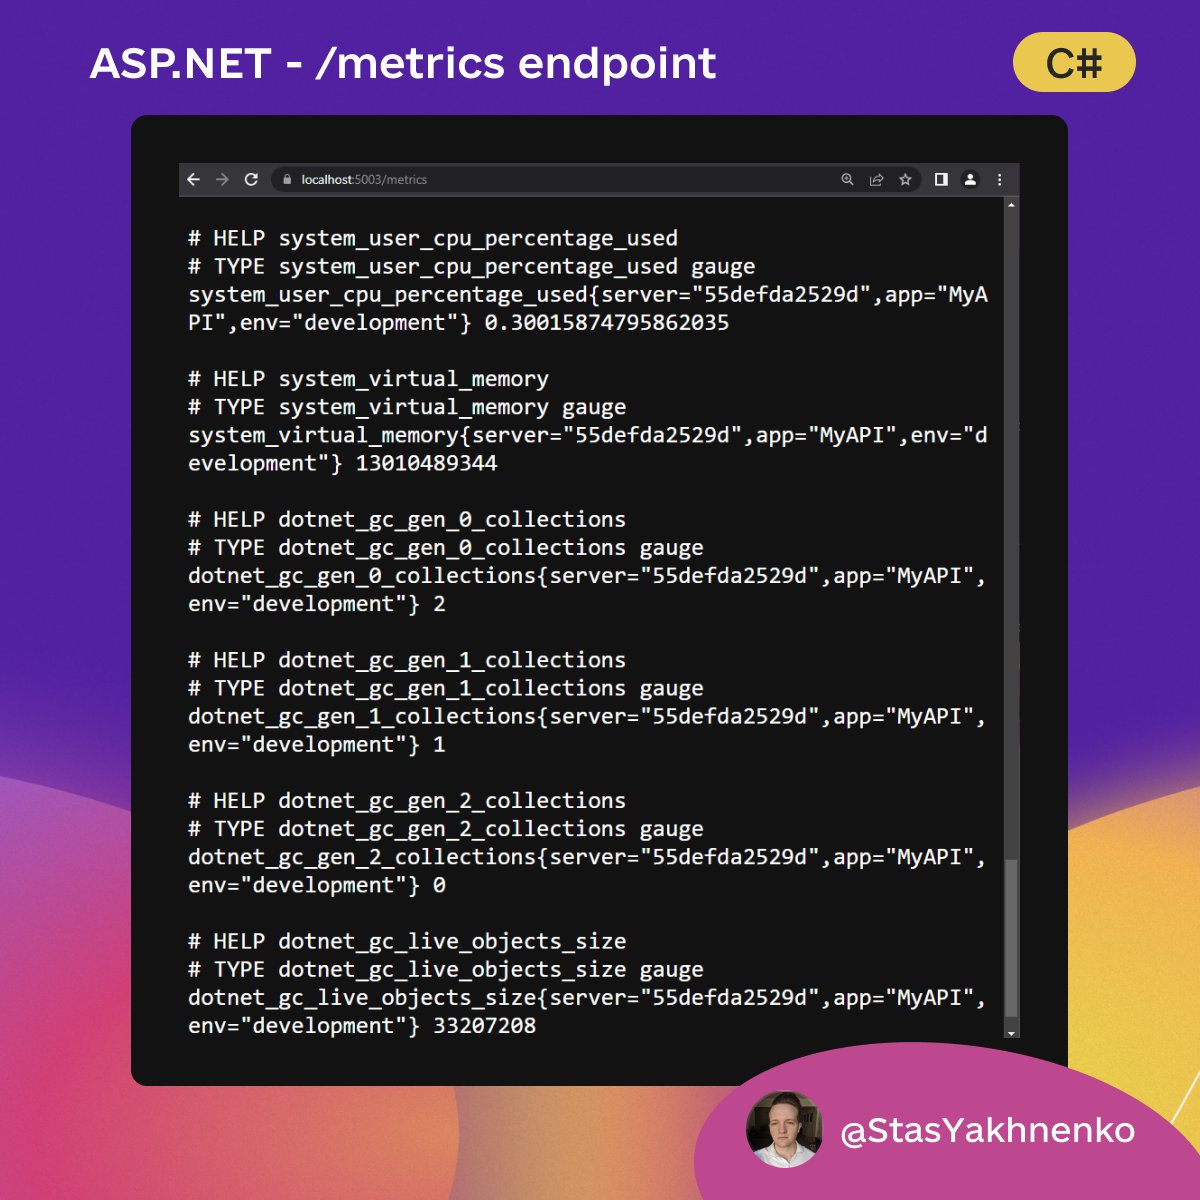
8\ With that setup, you're able to access the new endpoint "/metrics", which has all the data we're monitoring, in the Prometheus format.
Let's see how it looks 👇
Let's see how it looks 👇
9\ Last step - visualisation.
For it, you can use any tools you like, I'll stick to #grafana and #prometheus.
They're easy to set up with docker, and much fun to work with 😎
As for the dashboard, I found one in public dashboards: /
grafana.com/grafana/dashbo…
For it, you can use any tools you like, I'll stick to #grafana and #prometheus.
They're easy to set up with docker, and much fun to work with 😎
As for the dashboard, I found one in public dashboards: /
grafana.com/grafana/dashbo…
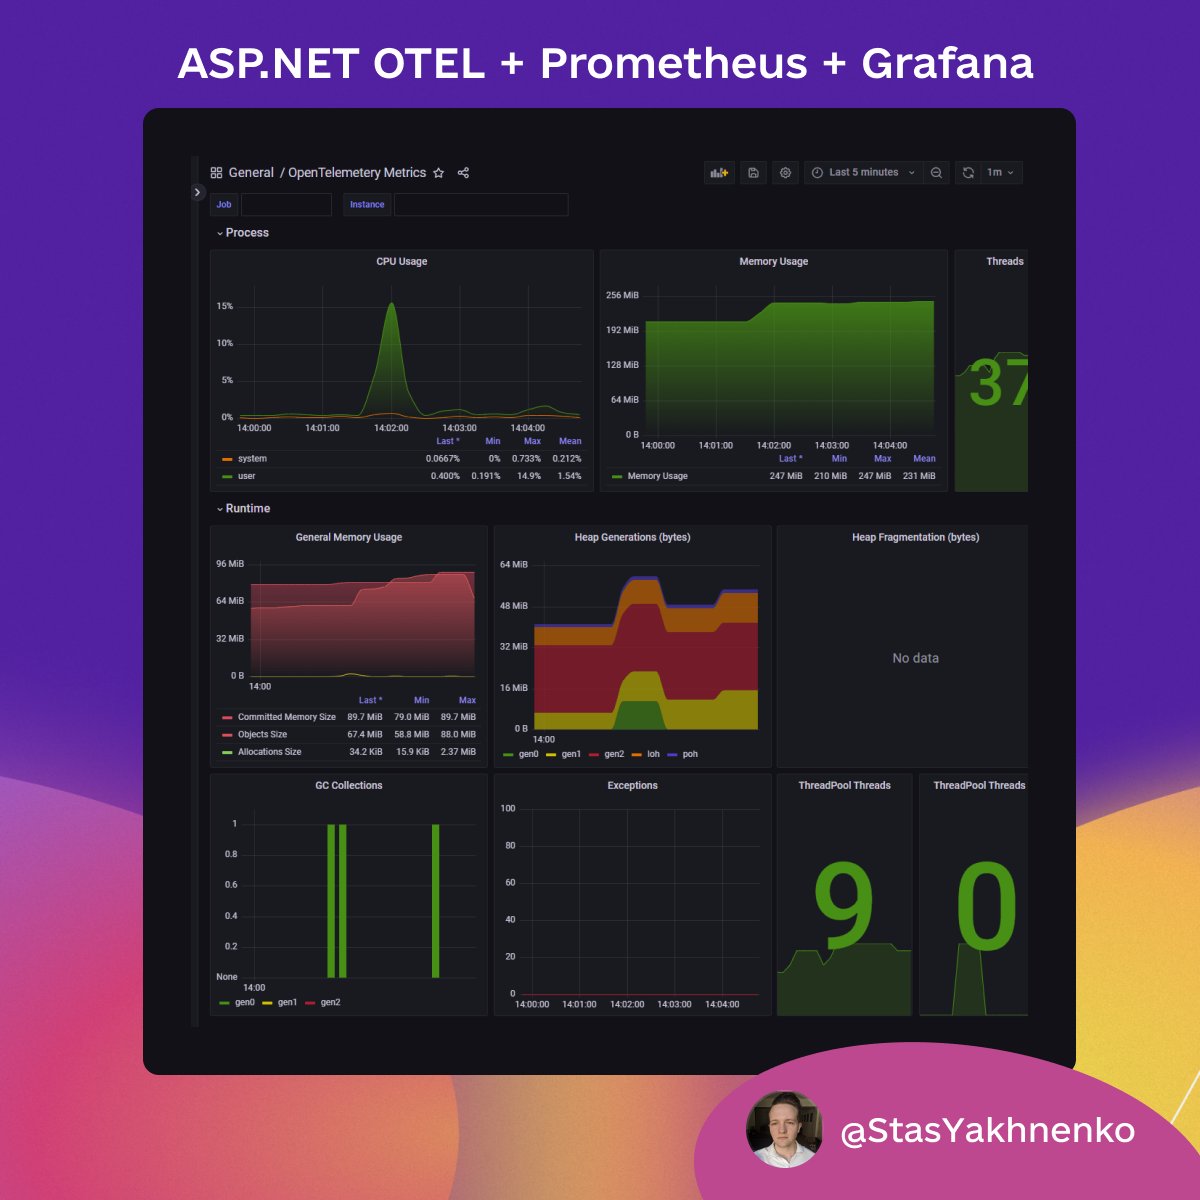
10\ A little bit more configuration and that's the result 👇
All the data is on one dashboard, easy to navigate, and easy to observe.
#grafana dashboards are configurable, so you might customize them according to your needs.
All the data is on one dashboard, easy to navigate, and easy to observe.
#grafana dashboards are configurable, so you might customize them according to your needs.
11\ In conclusion, if you're looking for a powerful and flexible solution for observability in ASP.NET Core, look no further than OpenTelemetry. With its rich set of features, community support, and commitment to open standards, it's just the best choice
BTW, this thread and overall investigation about OpenTelemetery was highly inspired by @davidfowl short tweet
https://twitter.com/davidfowl/status/1588942067157594112
@davidfowl If you find this thread insightful consider liking, RT, and subscribing. I regularly write about different ASP.NET tips and techniques, so don't miss it! 🌟
• • •
Missing some Tweet in this thread? You can try to
force a refresh


