My day trading strategy mega thread! 🧵
I'm going to cover my entire system for day trading the stock market. The goal of this thread is to help you identify and execute your own high quality trades
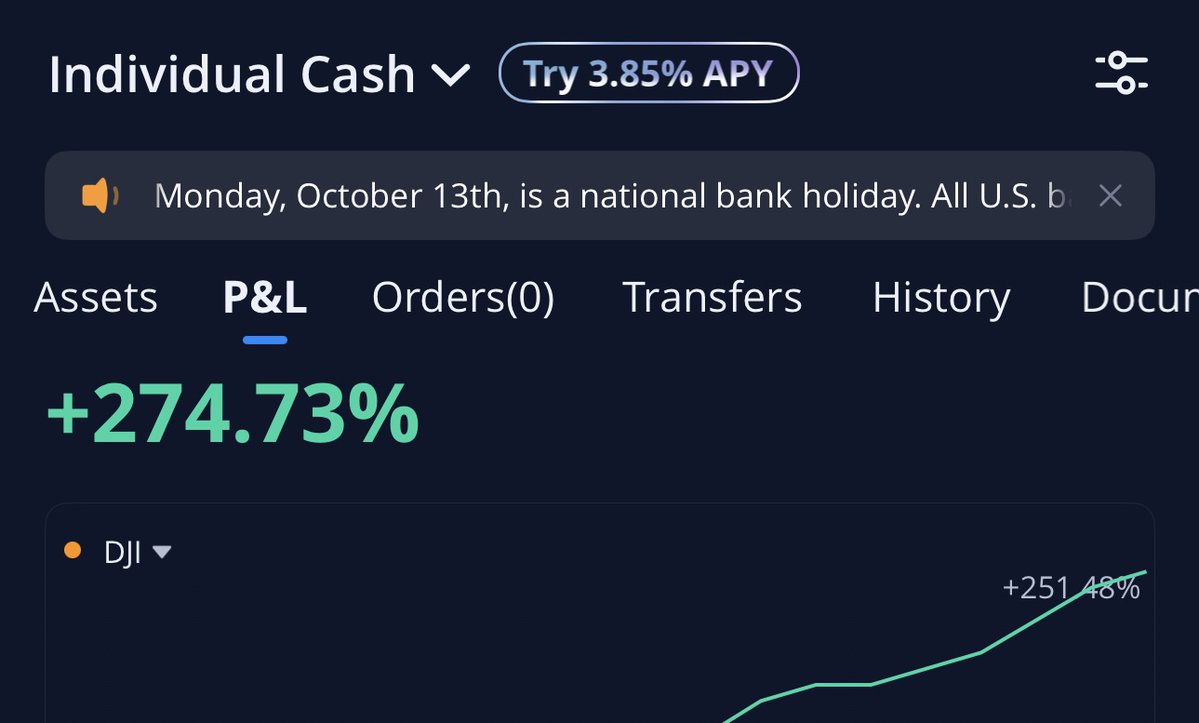
I've taken 127 trades this year with a 75.59% win rate, Here's how 👇 $spy $qqq

I'm going to cover my entire system for day trading the stock market. The goal of this thread is to help you identify and execute your own high quality trades
I've taken 127 trades this year with a 75.59% win rate, Here's how 👇 $spy $qqq


There are 4 main parts to my trading and i'll go over each of them separately. Then we will look at how they all come together into a simple effective A+ trade.
1 - Supply and Demand
2 - EMA indicators
3 - Basic chart patterns
4 - Risk management
Lets take a look 👇
1 - Supply and Demand
2 - EMA indicators
3 - Basic chart patterns
4 - Risk management
Lets take a look 👇
(1) Learning Supply and Demand Zones -
This is 1 week of S&D zones I traded on QQQ. To make it easy to keep track of through each chart I have numbered the Zones in this thread 1-5
I'm going to show you exactly how I found and traded each of them. Starting with these 3 below 👇
This is 1 week of S&D zones I traded on QQQ. To make it easy to keep track of through each chart I have numbered the Zones in this thread 1-5
I'm going to show you exactly how I found and traded each of them. Starting with these 3 below 👇

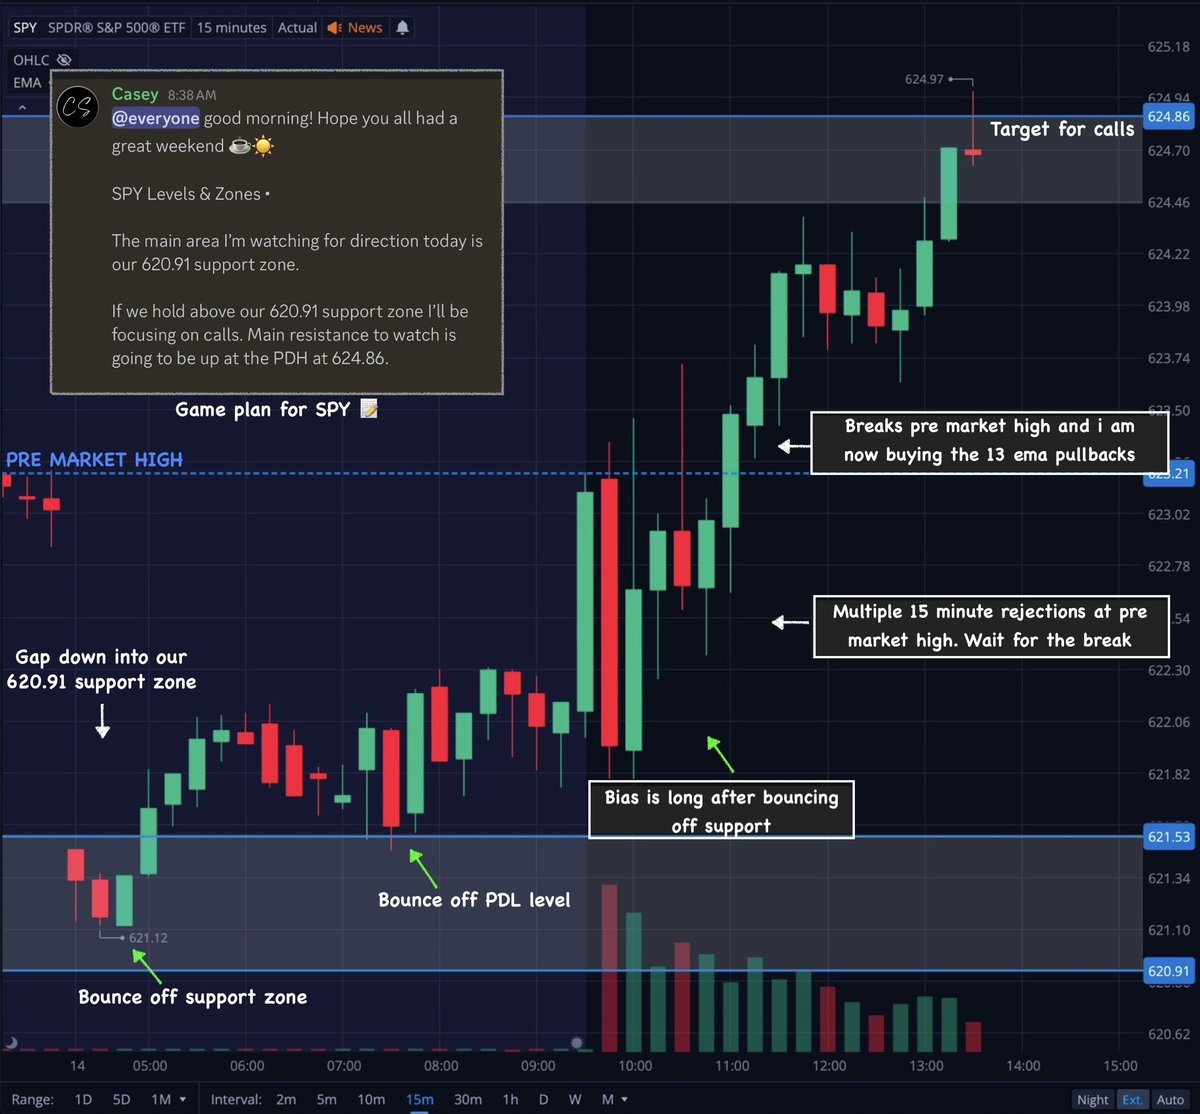
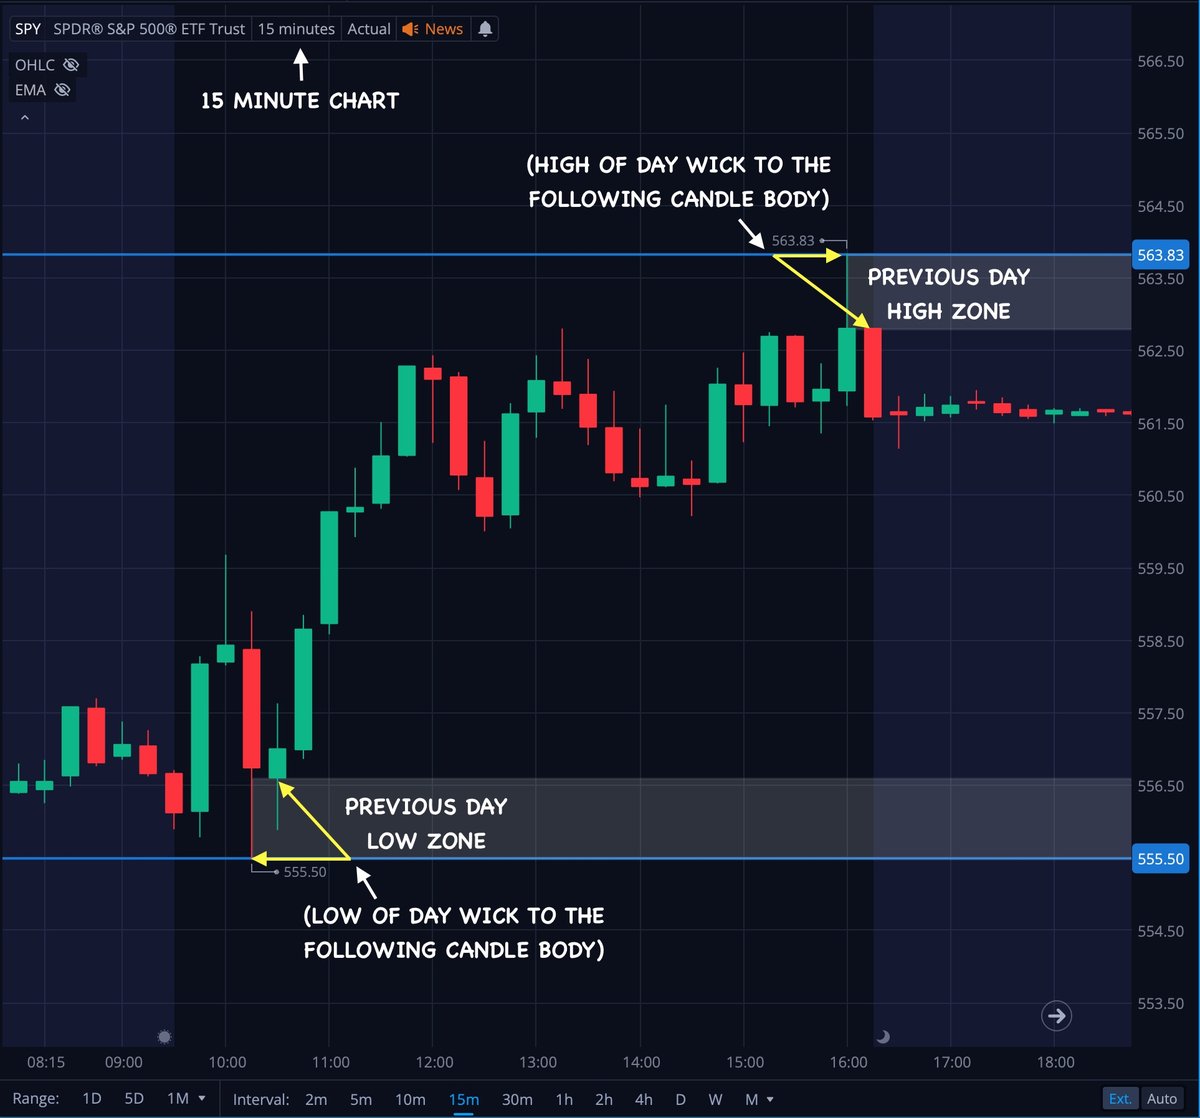
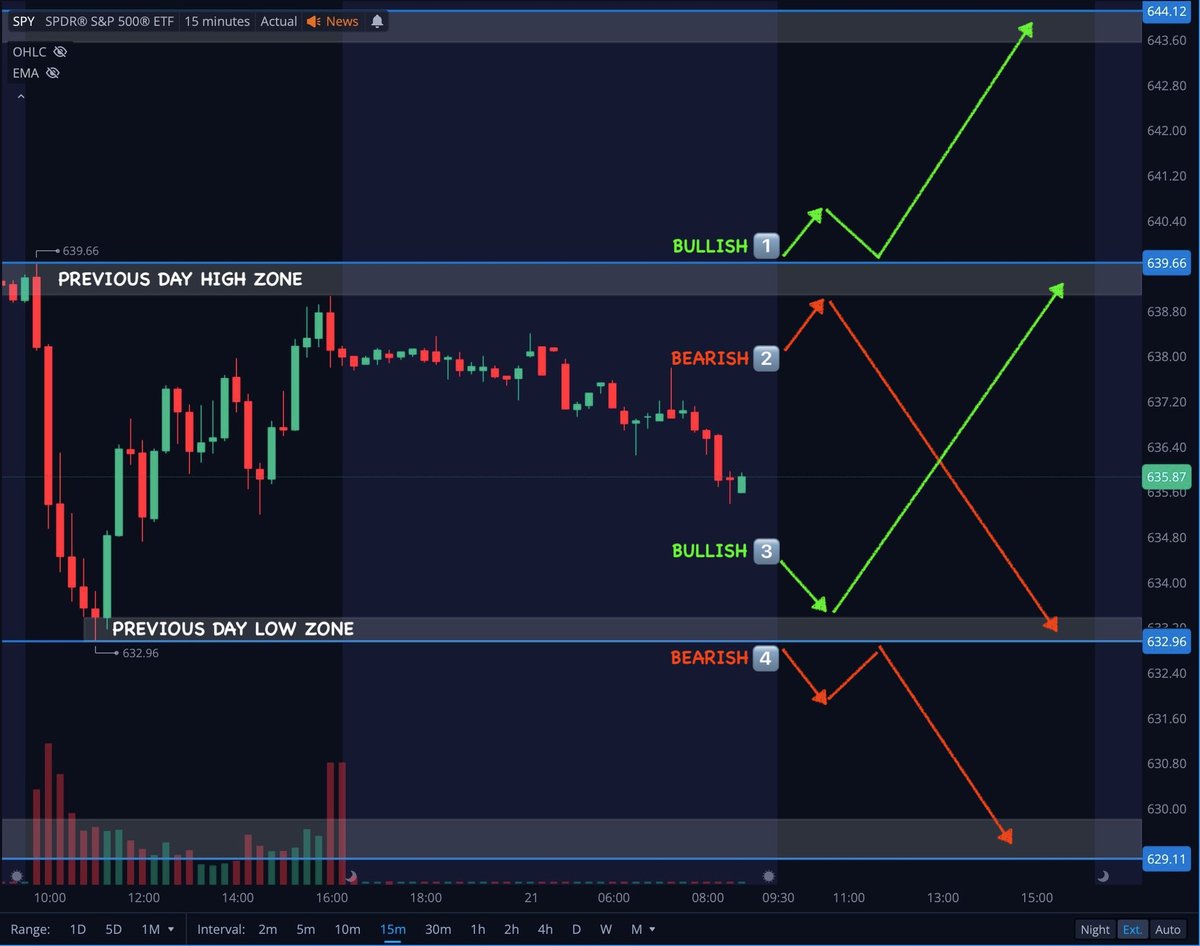
Zone 1 is my breakout point. I get this from the previous days high. I draw a zone from the high of day wick to the following candle body.
Breaking above this zone tells me that we are out of range and putting in a higher high from the day before. This is a good sign of momentum
Breaking above this zone tells me that we are out of range and putting in a higher high from the day before. This is a good sign of momentum

Zone 2 is the next resistance point we will see if we break out of that previous days range. I use this as a price target and a place to be cautious of a rejection/reversal.
To find this zone I look back on the chart and find the place we last saw resistance/reversal happen 👇
To find this zone I look back on the chart and find the place we last saw resistance/reversal happen 👇

Zone 3 is my next area to watch for a rejection/reversal if we break through Zone 2. I find this area by repeating the above process again
When price hits Zone 2, im watching for a break or rejection. A break likely sends it to Zone 3, Rejection likely sends it back to Zone 1👇
When price hits Zone 2, im watching for a break or rejection. A break likely sends it to Zone 3, Rejection likely sends it back to Zone 1👇

Here's a look at how I played these zones this day. I missed the move from Zone 1 to 2. I watched Zone 2 for a break or rejection. Because I have these Zones charted, I know that a break of 2 will likely lead to 3. So when it breaks I enter long and aim for Zone 3 👇

Coming into the following day I need another zone to aim for if Zone 3 Breaks. This is where Zone 4 comes in. I found this Zone using the same simple process I used to find 2 and 3.

I look back as far as I need in order to find the next area where price got rejected. In this case it was about 2 weeks back. When there is large gaps between resistance levels it creates smooth price action as price is able to move freely from one zone to the next 👇

Here is a closer look at the price action of that day. Again because I had these Zones on my chart I had a good idea of where price may be headed next. Catching 100% move up into Zone 4, then a 400% move on the rejection back to Zone 3 👇

The following day we stayed in range under Zone 4. So now I know that a break of Zone 4 will bring momentum in the future. Time to find another price target for when that happens 👇

Repeating the same process like clockwork, I look back on the chart at the last place price was rejected over Zone 4. This is where I got Zone 5 from.
And again by observing the lack of resistance in between Zone 4 and 5 I know that price will likely move freely between the two.
And again by observing the lack of resistance in between Zone 4 and 5 I know that price will likely move freely between the two.

Once again coming into the day I have my Zones to watch. If we break Zone 4 I'm looking at going long and aiming for Zone 5. This keeps me on the right side of the momentum so i'm not fighting against the trend.
I use the same process in reverse for playing the downside..
I use the same process in reverse for playing the downside..

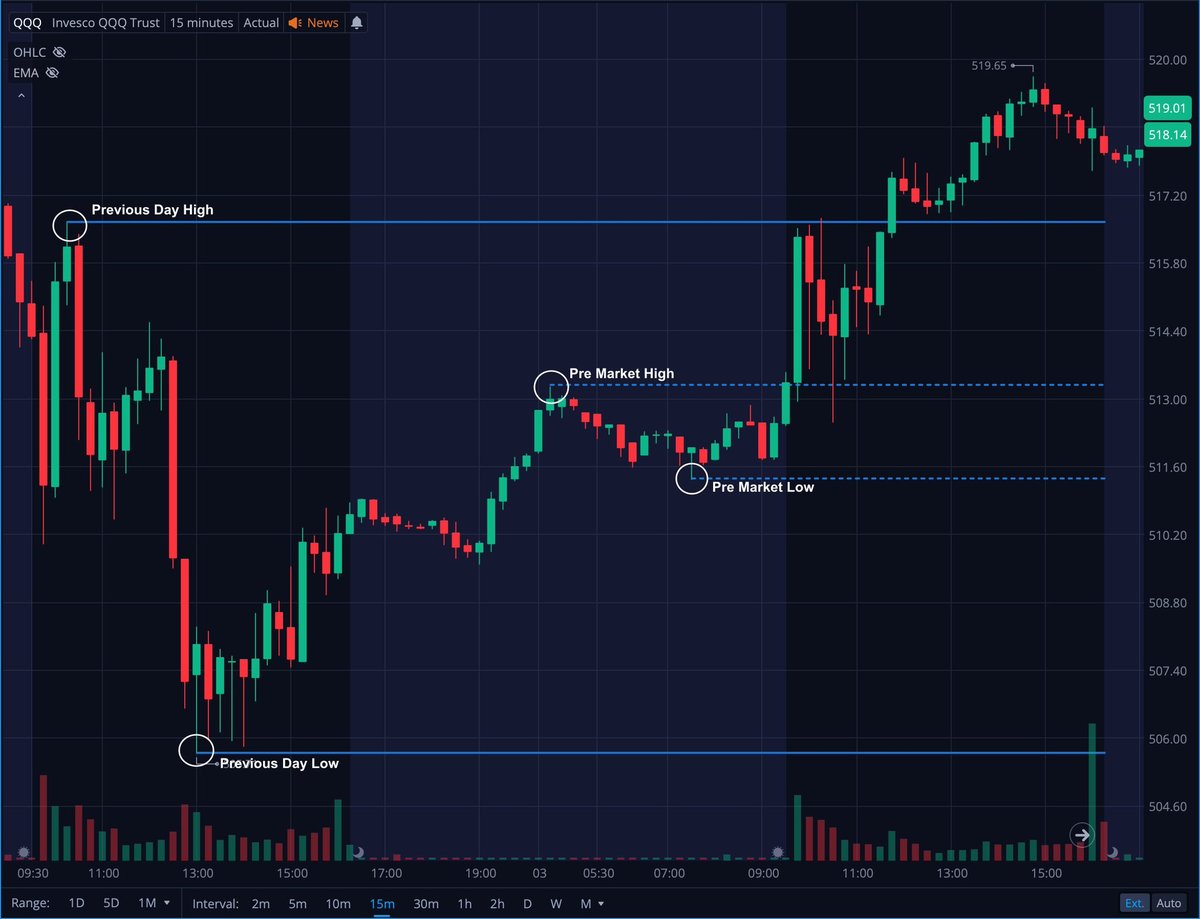
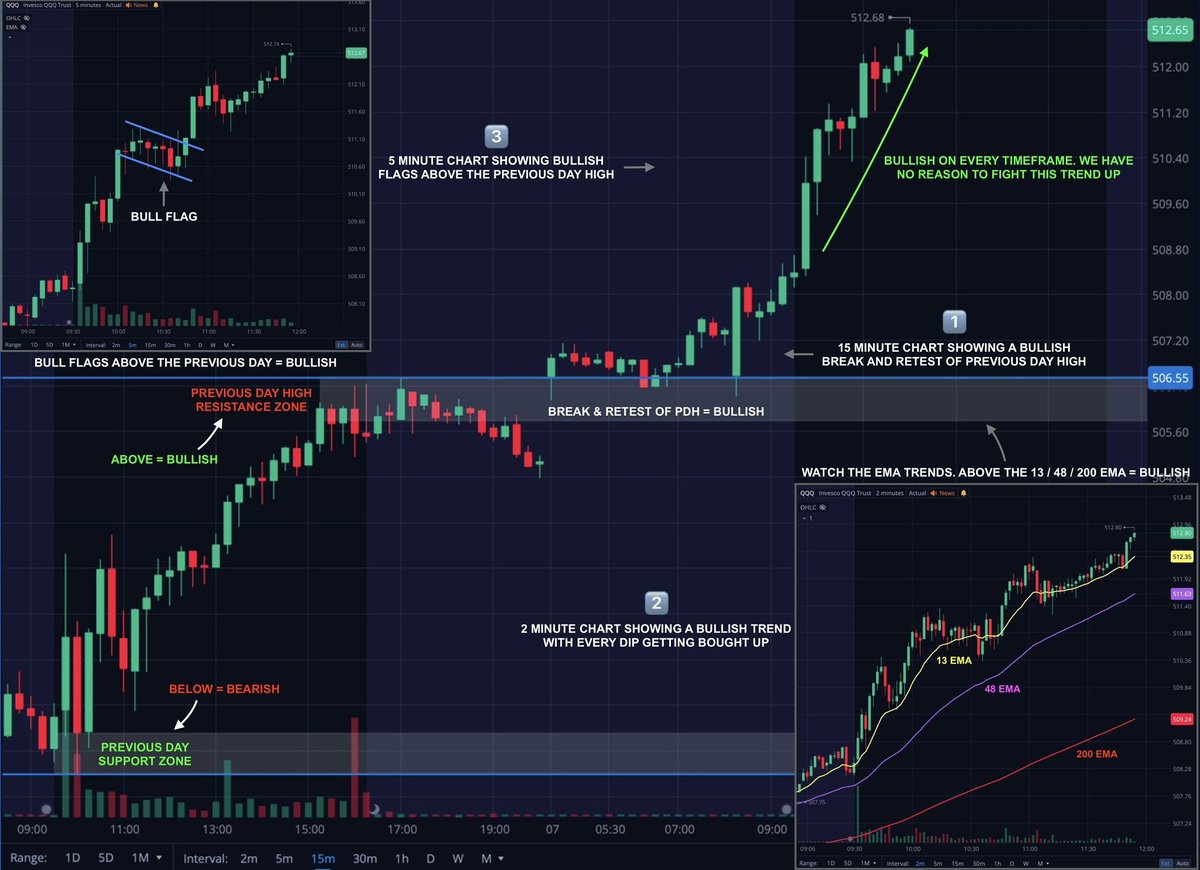
Intraday S&D zones are a great tool to use when we are inside of larger timeframe zones.
Look for areas where price has found support and resistance early in the day.
Mark those zones and watch for a break above/below them later in the day, then trade them the same way 👇
Look for areas where price has found support and resistance early in the day.
Mark those zones and watch for a break above/below them later in the day, then trade them the same way 👇


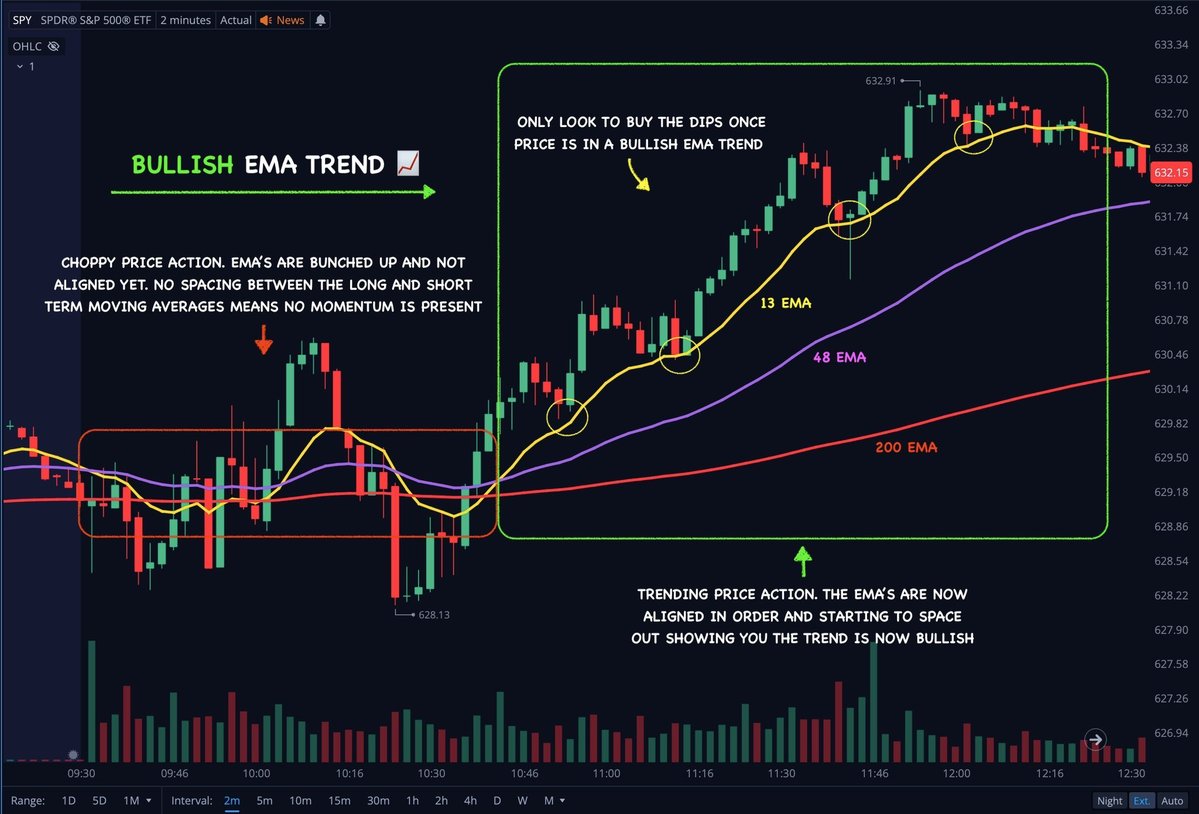
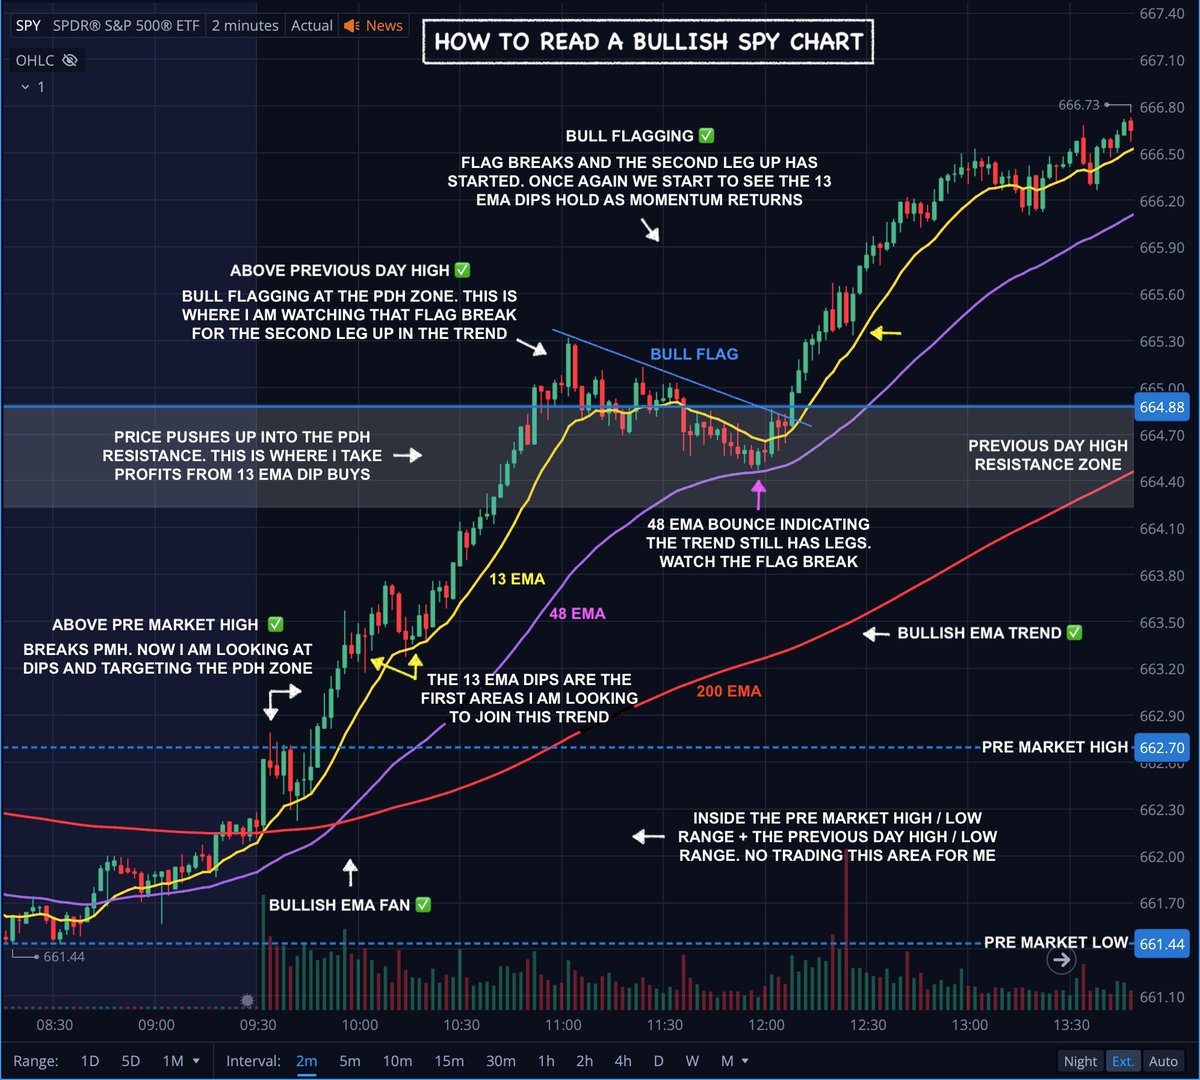
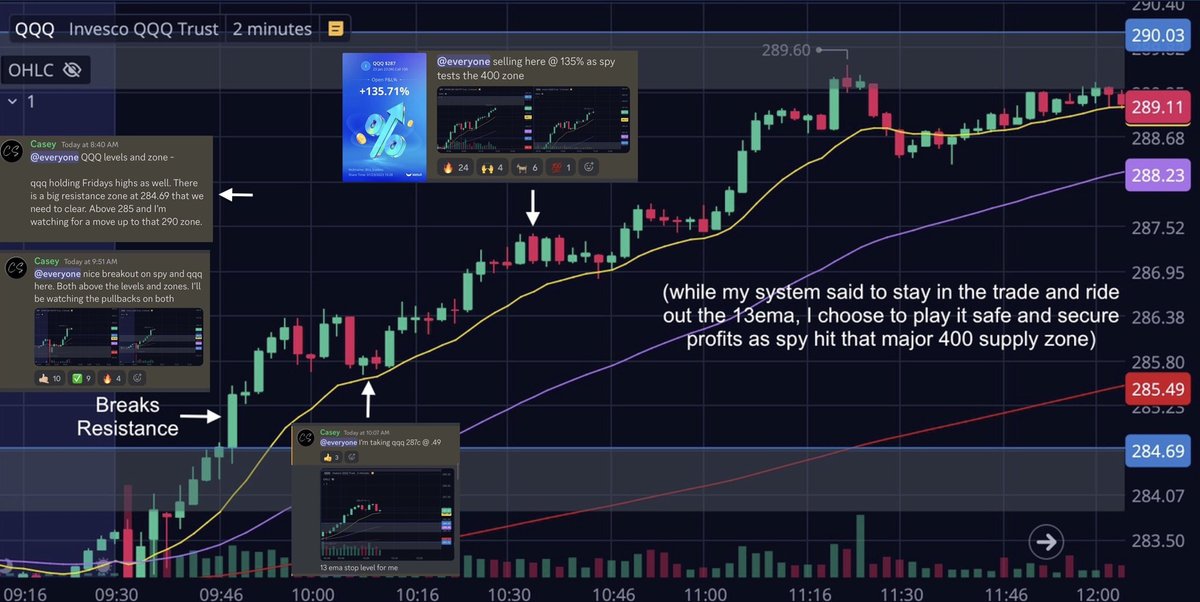
(2) Utilizing EMA's
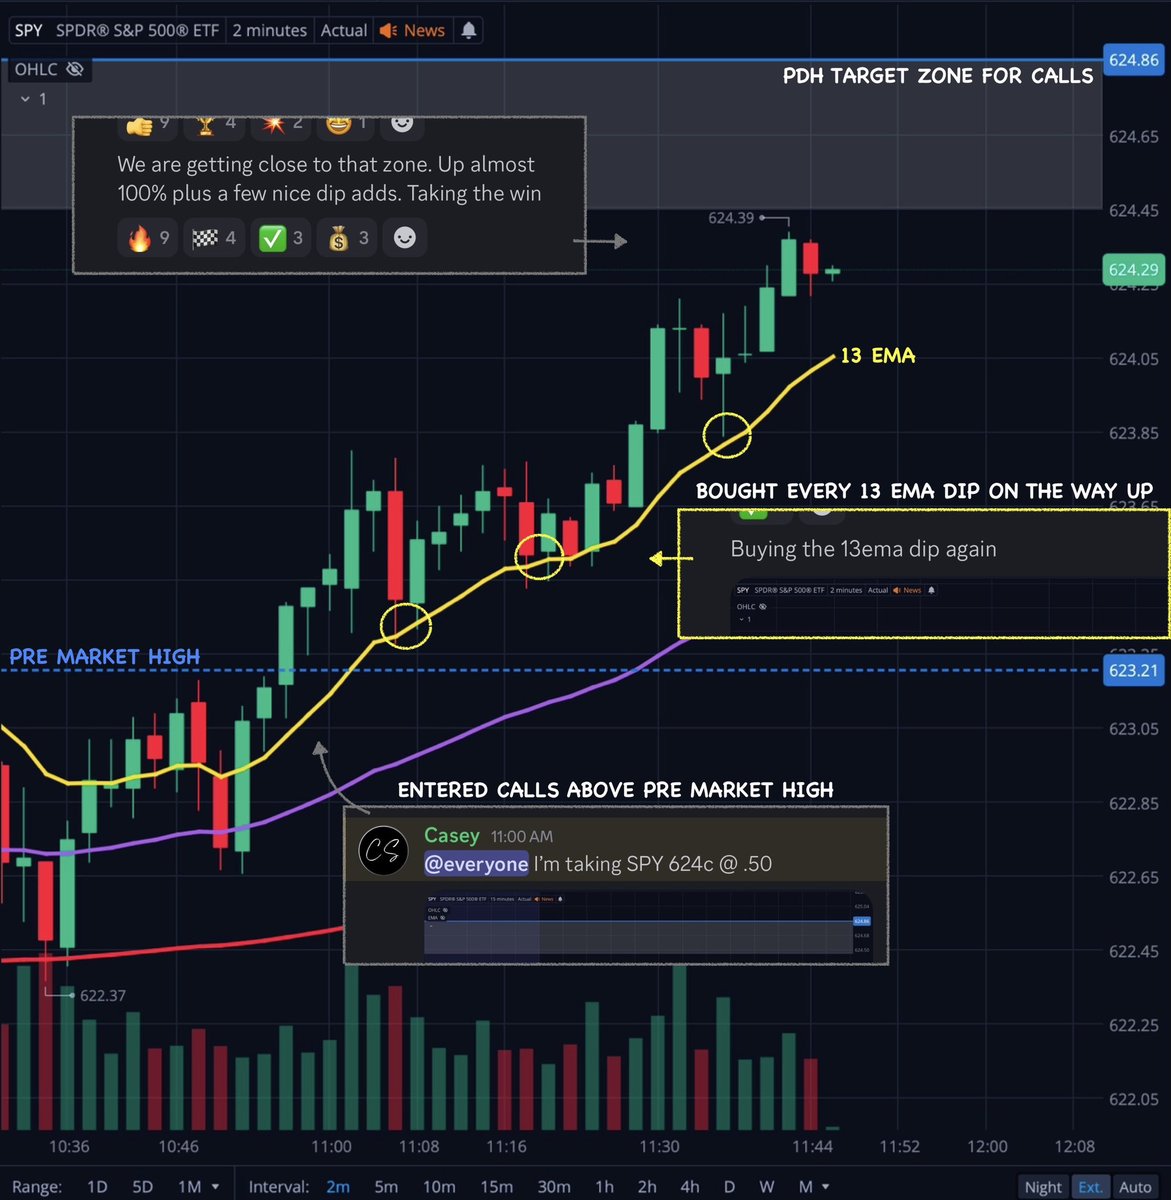
I use the 200ema - 48ema - 13ema on the 2 minute chart. I use them to gauge my entries and exits
I want stock price over the 200ema for pullback entries to the 13 and 48ema to go long
I want stock price under the 200ema for pullback entries to go short 👇
I use the 200ema - 48ema - 13ema on the 2 minute chart. I use them to gauge my entries and exits
I want stock price over the 200ema for pullback entries to the 13 and 48ema to go long
I want stock price under the 200ema for pullback entries to go short 👇

I use the emas is to gauge momentum. When they are flat/scrambled/close together it is a strong sign of consolidation/chop (no trade zone!)
When the emas start to drift apart and align in order it is a clear visual of momentum. This is when pullback buys are most respected! 👇
When the emas start to drift apart and align in order it is a clear visual of momentum. This is when pullback buys are most respected! 👇


As price moves from Zone to Zone i'm using the emas to gauge the momentum, avoid consolidation/chop areas, and buy the pullbacks.
Once in the trade i'm using the 13ema to ride out my winners, scaling out along the way. Exiting the trade on the break.
Once in the trade i'm using the 13ema to ride out my winners, scaling out along the way. Exiting the trade on the break.


Every trade follows the same concept and basic set of rules.
Its a simple process of breaking above resistance and buying dips to the emas to go long. Or breaking below the support and buying pullbacks to the emas to go short 👇
Its a simple process of breaking above resistance and buying dips to the emas to go long. Or breaking below the support and buying pullbacks to the emas to go short 👇
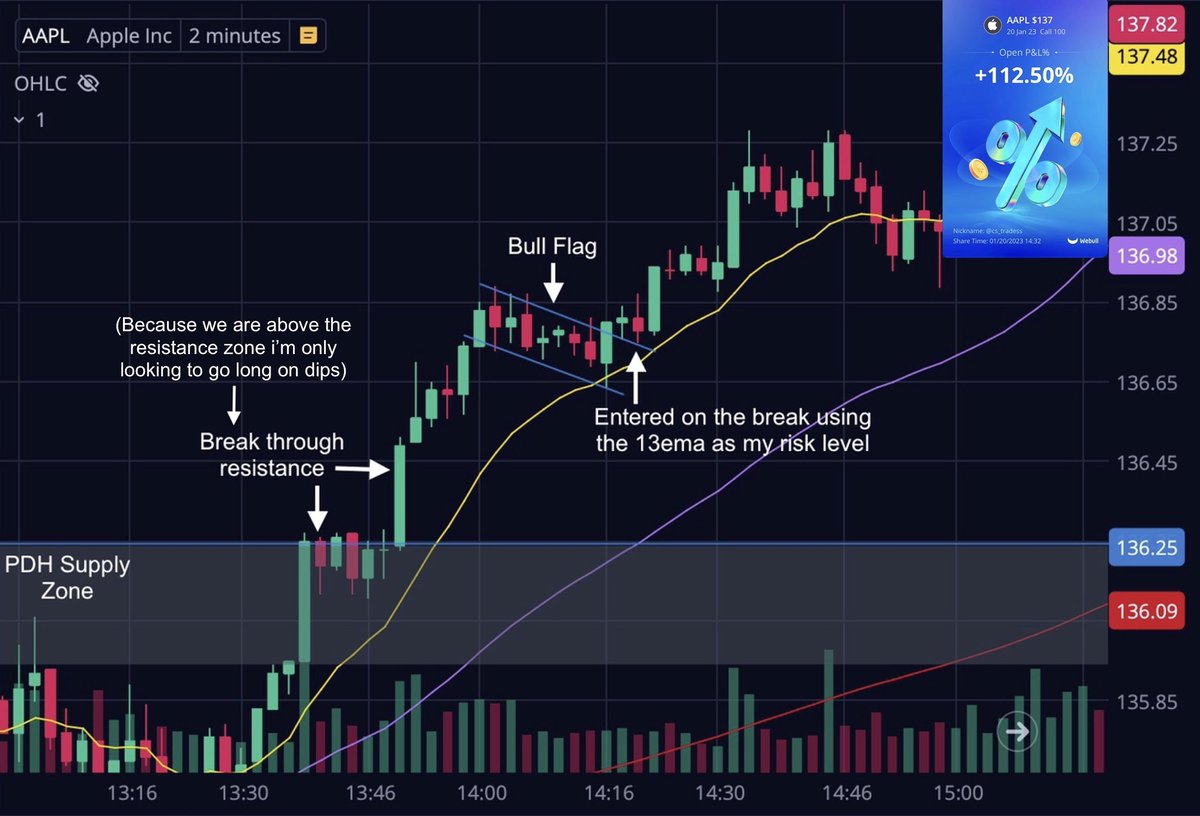


(3) Chart patterns and analysis - I like to keep it simple and focus on what works. I use things like Bear/Bull flags, common candle stick patterns, and overall market awareness to assist me in my trading. These are simple effective tools that anyone can learn 👇


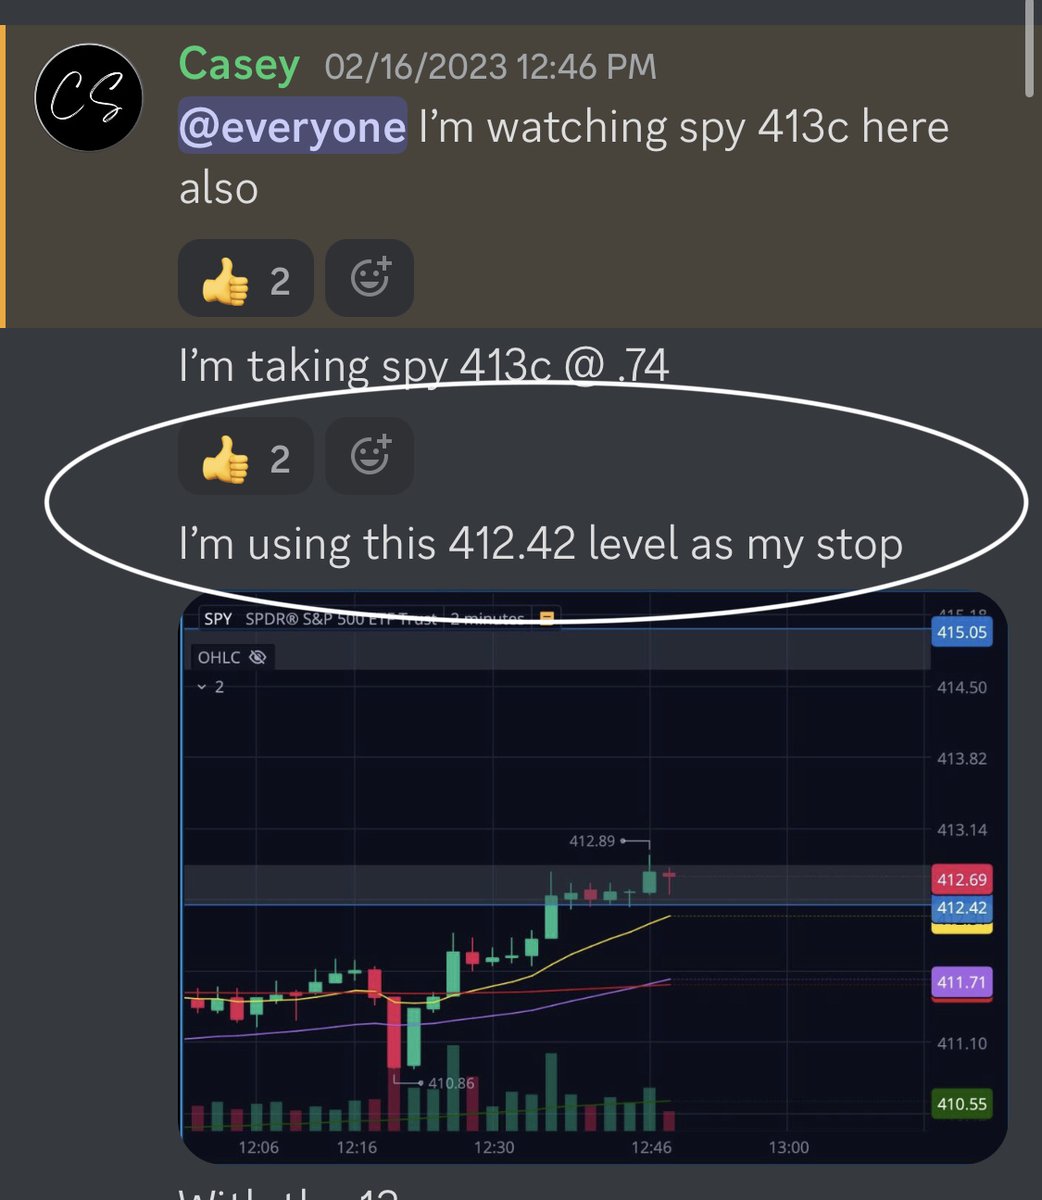
(4) RIsk management - Without a doubt the most important part of any trading system. Keeping losers small is critical!
I do this by having a clear risk level for every trade I enter. and more importantly, respecting it! Every strategy comes with systematic losses, except it.
I do this by having a clear risk level for every trade I enter. and more importantly, respecting it! Every strategy comes with systematic losses, except it.


These 4 steps all come together to form a uncomplicated system that is simple to follow and execute on a daily basis.
Watch my levels and zones for direction ✔️
Basic chart analysis for confirmation ✔️
Enter on pullbacks to my emas ✔️
Set stops and use risk management ✔️
Watch my levels and zones for direction ✔️
Basic chart analysis for confirmation ✔️
Enter on pullbacks to my emas ✔️
Set stops and use risk management ✔️


Thank you taking the time to read this thread 🙏 If you find it helpful give it a ❤️ & ♻️ to share it! And follow along for daily breakdowns of trades and charts 🤙
Link to the room where I teach, trade and alert daily👇
whop.com/team2trading
Link to the room where I teach, trade and alert daily👇
whop.com/team2trading
• • •
Missing some Tweet in this thread? You can try to
force a refresh