Many conflicting prophecies on economy and markets. A 🧵on how they could fit:
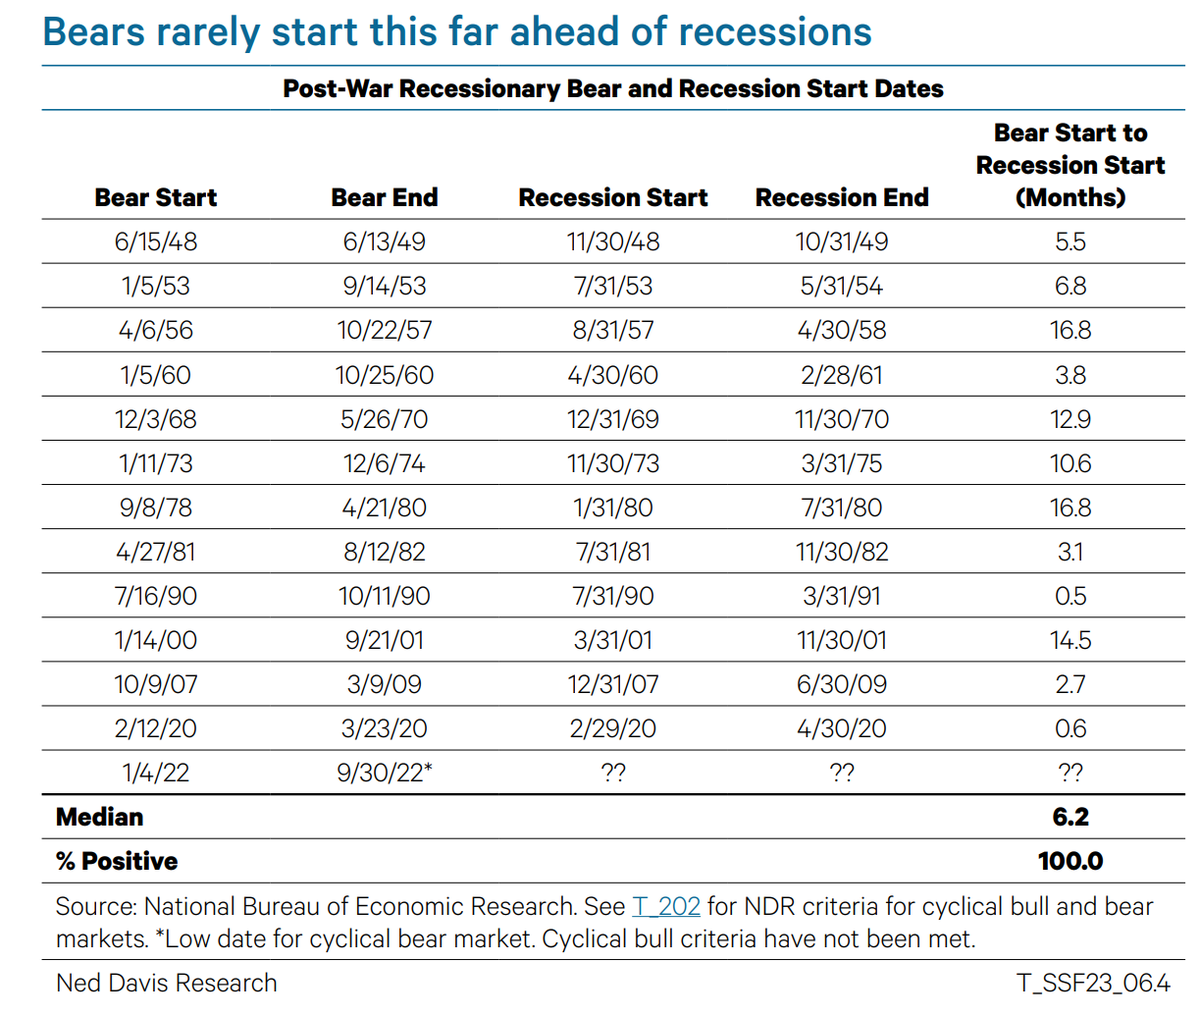
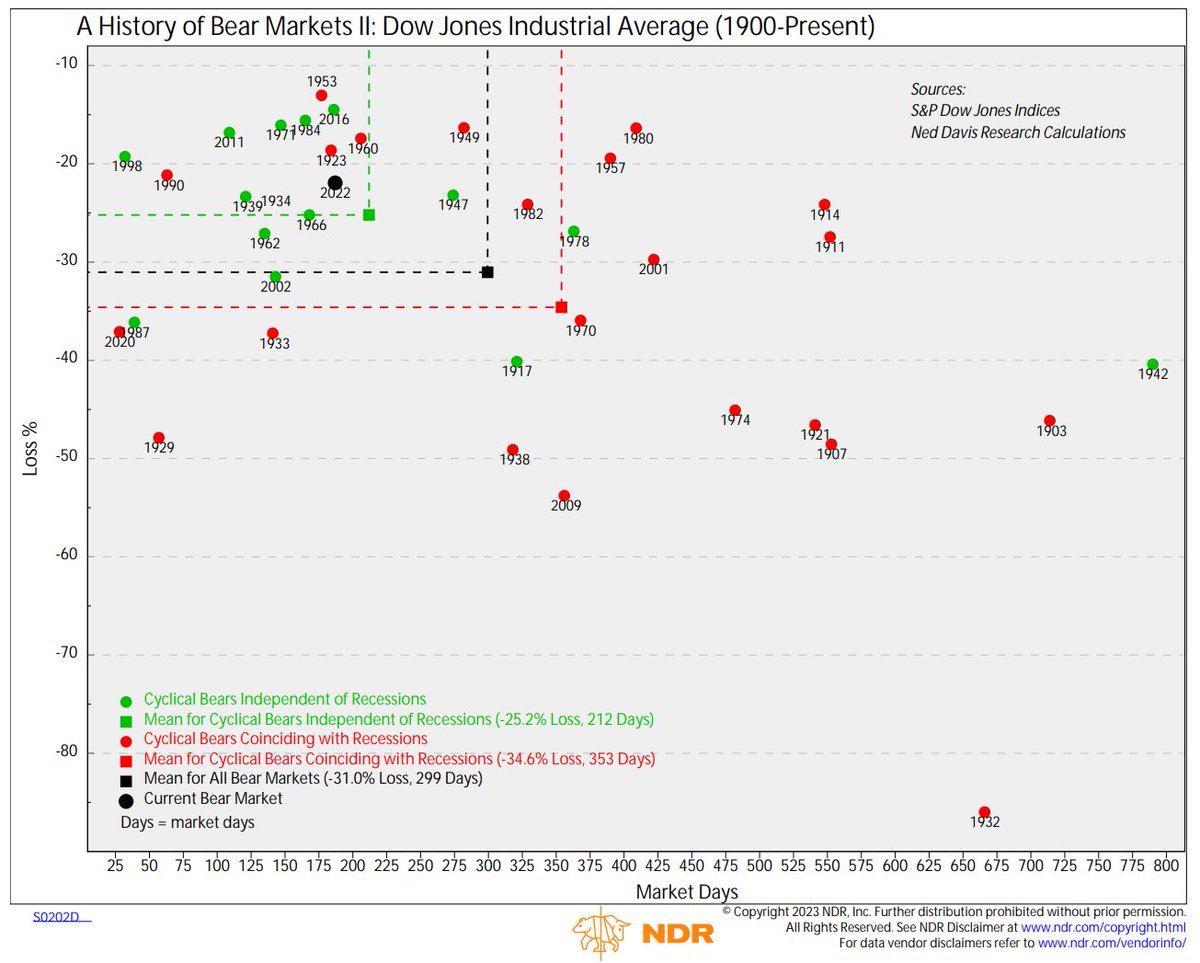
A bear market has never ended before the start of a recession. Most economists say US is not in recession but it's likely so logical conclusion is lows are not in place. Makes sense. @NDR_RESEARCH 1/9
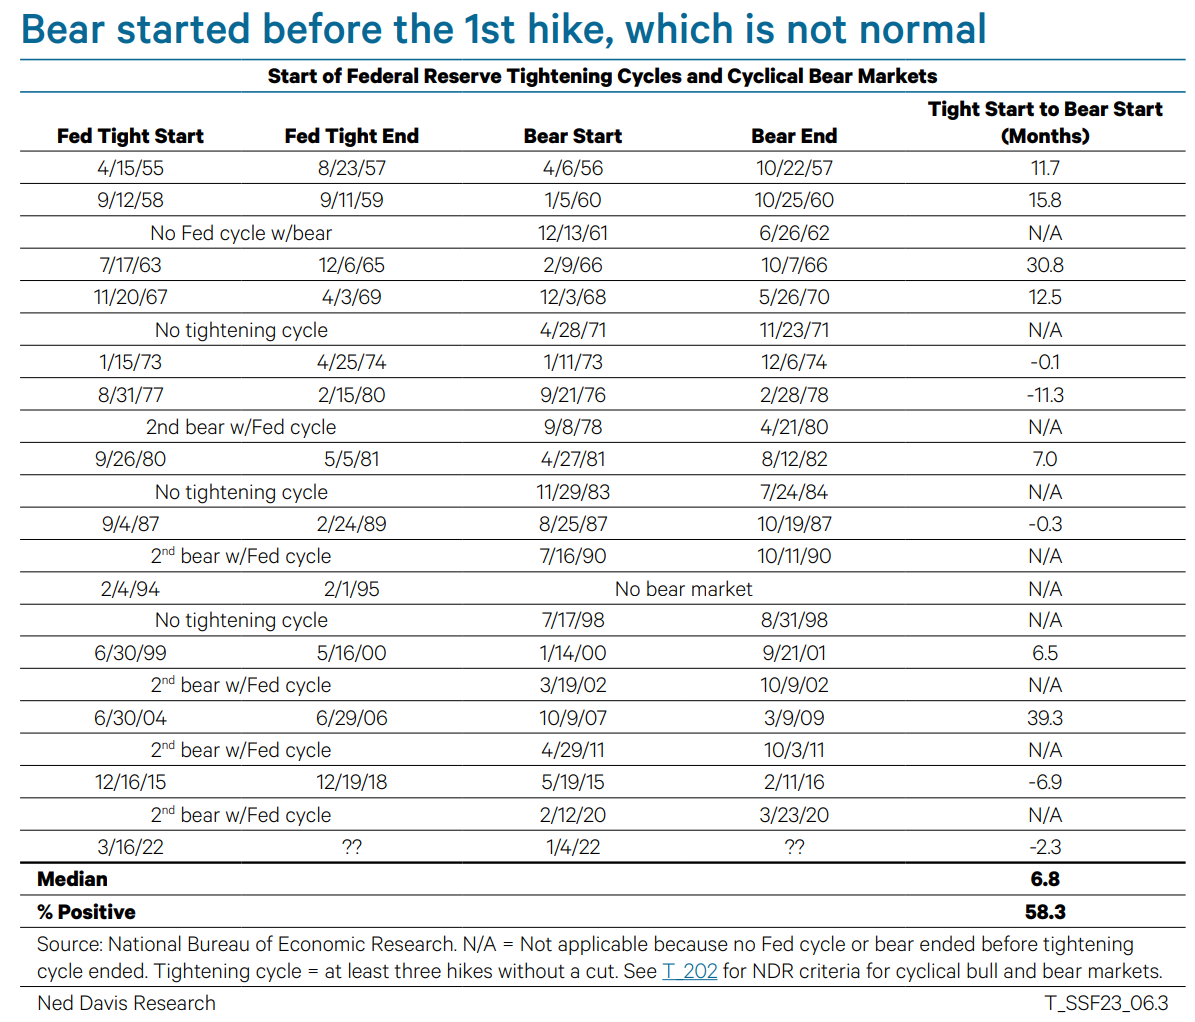
Powell has repeatedly said he is willing to push the economy into recession to get inflation in check. Bears end a median of 14 months after the last hike. The Fed is expected to hike again on March 22, implying the bear could continue well into 2024. 2/9
But…the stock market started pricing in the Fed and economic cycles earlier than normal. Bears start a median of 7 months after the 1st hike. This bear started 2.3 months before. The lead time was longer only twice before: 2015 (QE3 ended) and 1978 (we’ll come back to that). 3/9
The market was even further ahead of the economy. Bears start a median of 6 months before recessions. Longest is 17M (1956 & 1978). Recent data imply a recession is not imminent. If recession is pushed to late 2023 or 2024 there is no precedent for staying in a bear that long 4/9
A non-recession bear in 2022 would fit with the typical cycle. For the past 60 years, the US has averaged 2 bear markets for every recession. The pattern is recession bear, post-recession bull, non-recession (or echo bear), and post-echo bull. 5/9
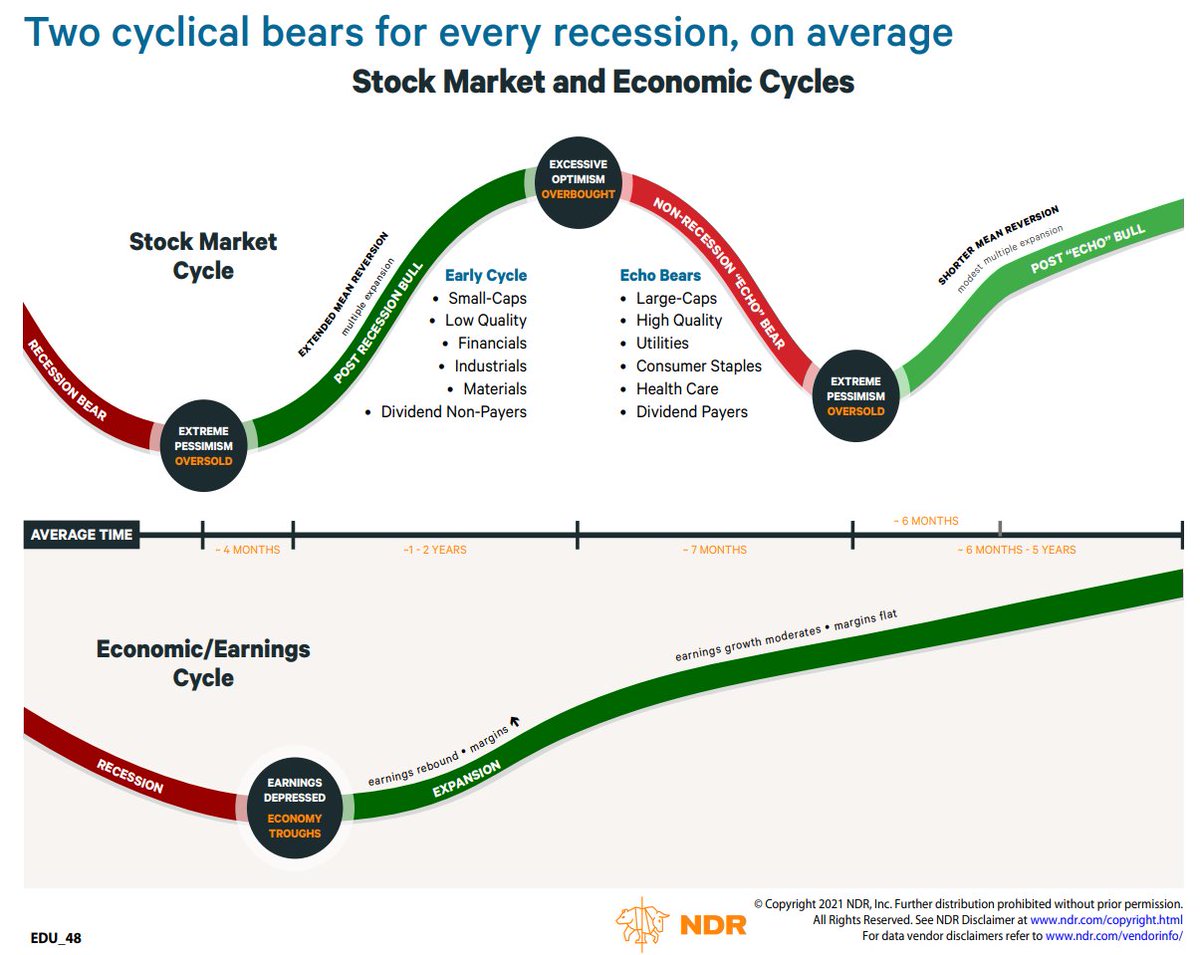
Post-recession bulls are the most powerful part of the cycle bc economy is surging. The US economy is so developed it can’t sustain high growth, so after about 2 years, growth slows. There are fears of a double-dip recession, but that has only happened once in 60 years. 6/9
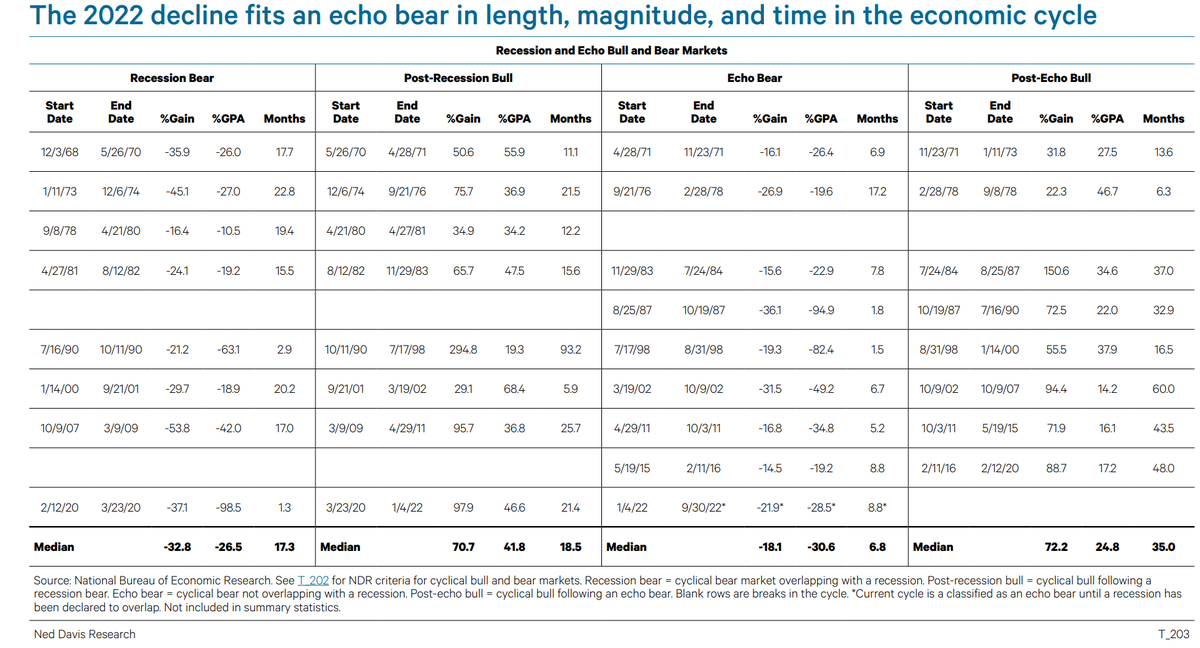
As recession fears fade, the market enters a post-echo bull until the next recession. To date, the 2022 bear ~2yrs into the expansion and is close to the average echo bear. Perfectly normal cycle behavior! 7/9
The tricky part this cycle is the expansion could be shorter than normal, so a post-echo bull could be far less than the 3yr avg.
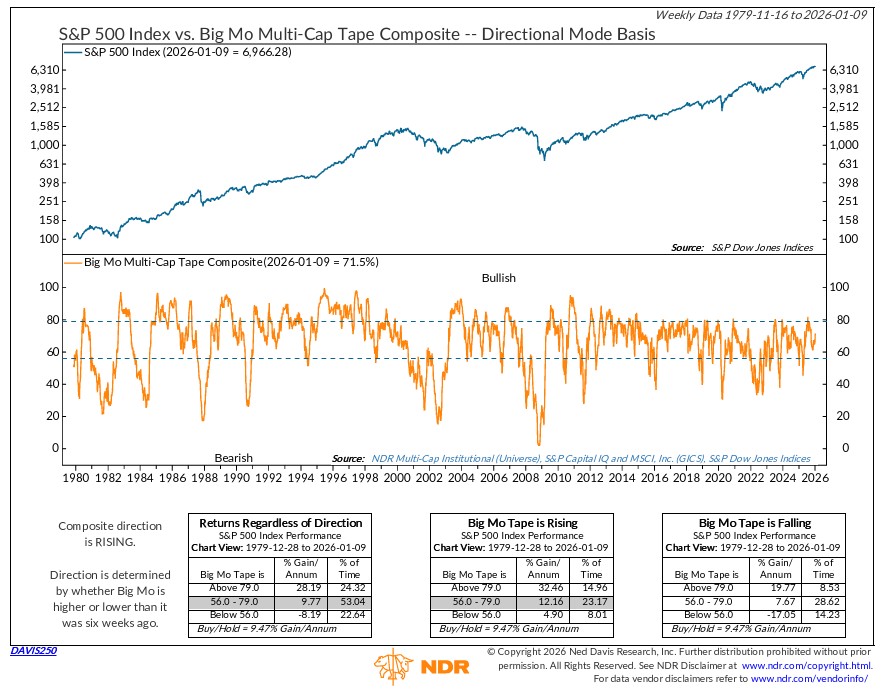
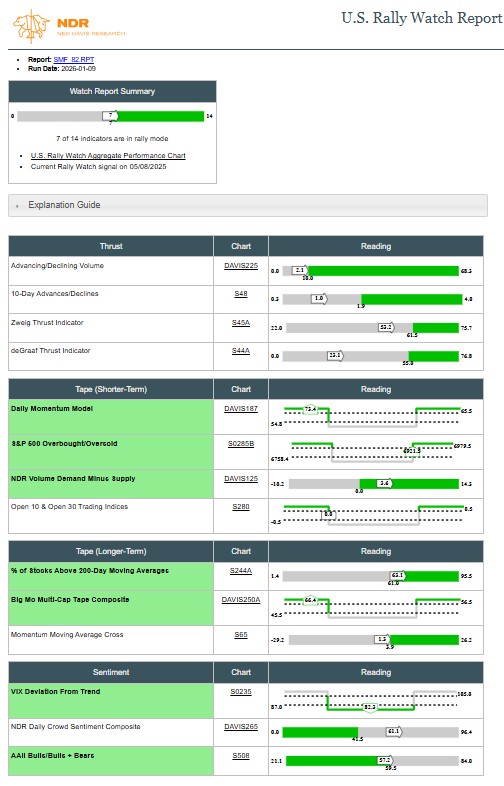
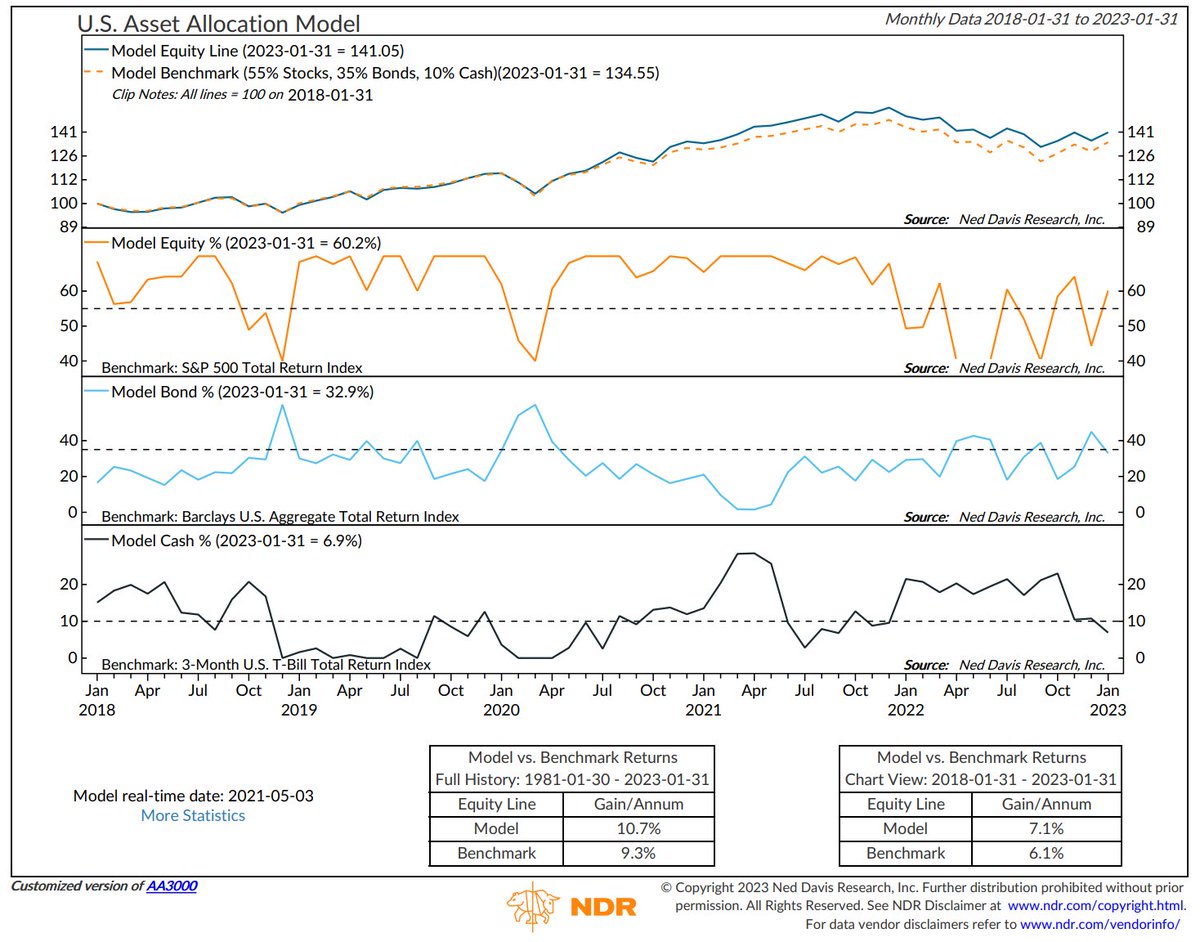
A (hopefully) interesting thought process, but at the end of the day, we focus on indicators. They lean bullish for now. 8/9
I had the privilege of discussing the echo bear/recession bear debate, markets pricing out rate cuts, and short-term overbought conditions with @RomaineBostick and @kgreifeld on @BloombergTV The Close. Interview starts at the 1hr 30min mark. bloomberg.com/news/videos/20…
• • •
Missing some Tweet in this thread? You can try to
force a refresh
Quick check on market internals.
Big Mo Tape, which measures the % of sub-industries in uptrends, is up to 71.5%, its highest reading since Oct. 3. Not surprisingly, the latest bump came from Industrials. @NDR_Research 1/4
Big Mo Tape is one of the indicators in our Rally Watch Report. It's back to 7/14 bullish signals. The fact that the short-term breadth thrust indicators haven't fired isn't surprising. 3/4 short-term tape + 2/3 long-term tape says the trend is bullish. That 2/3 sentiment are still bullish implies not everyone is all in yet. 2/4
Style breadth is strong. All 6 style boxes have >60% of stocks above their 200-day moving averages. Weaker short-term breadth from large-cap Growth bears watching.
Rotations are healthy, but when the bull market leaders fall too far behind, it has sometimes signaled the end of the cycle. 3/4
Lots of takes on poor breadth. Not perfect but far from terrible. A🧵
Some point to mega-caps dominating returns. 4 stocks >50% of the S&P 500's YTD gain.
But that's normal for a cap-weighted index. The biggest stocks account for most of the gains in up years. @NDR_Research 1/7
It's OK for the generals to lead if the infantry follows. 59% of S&P 500 stocks >50D & 200D moving averages.
The broader NDR Multi-Cap is at 58% & 57%. Not fantastic but pretty good.
Even small-caps are >50%, and they have better 10-day breadth (67%) 2/7
Breadth decent across style boxes. Only small-cap Growth and Value <50% above 200D M.A.
Short-term breadth worse for large- and mid-cap Growth but better for SMID Value. Looks for like a rotation than a breadth breakdown. 3/7
History doesn't repeat, but it does rhyme. Despite the volatility the S&P 500 has been following the typical post-election year trend. The trend peaks in early August, and the year-end rally is weaker than normal.
Why and is it relevant in 2025? A 🧵 @NDR_Research 1/7
The reason 2H of post-election years tends to be weak is that the combo of monetary & fiscal policy tends to peak early in post-election years. Policy remains restrictive until shortly before mid-terms, on average. 2/7
Government policy has been especially restrictive in the 1st year of 2nd terms. Policy growth was negative in 4 of the last 5 "year 5s" Presidents are more concerned about legacy than the economy in the ST. They know lame duck status is quickly approaching. 2/7
The @NDR_Research SPX Cycle Composite is pretty bullish on 2025, esp. 1H. Why?
First, what is the Cycle Composite? An average of 3 historical price patterns: 1yr, 4yr (post election yrs), and 10yr (yrs ending in 5). Think of it has history's view of what 2025 can look like? 1/4
The 1 yr and 4 yr are intuitive. Fund flows & IPOs follow seasonal patterns, as does gov’t policy around pres. elections.
Why the 10 yr? The Kondratieff cycle shows the economy goes thru 10yr boom and bust waves. Years ending in 5 are by far the best for the SPX, on avg. 2/4
Only 2 recessions in year 5s. 1945 (demilitarization) & 1975 (ended in March 1975).
SPX has declined only once in a year 5 since 1895. That was in 2015, also the only year 5 that includes an @NDR_Research defined cyclical bear market. 3/4
Funny what of my research gets picked up and what doesn't. On Monday we featured this table showing that the year after the S&P 500 has logged at least 50 record highs, stocks have been weak.
I get it. Simple sells. Being bearish sells (up to a point). @NDR_Research 1/3
But factoids are not research. Nuance matters. The logic behind the study is by the time the market logs so many records, it has not only recovered from a bear but the bull is mature. Trees don't grow to the sky.
But bears don't die of old age, either. They need a catalyst. 2/3
Of the 7 cases, only 2 were weak right away. 3 were strong 1H, weak 2H (1929 crash, 2015 oil & Chinese growth, 2018 Fed tightening), 2 were solid all year.
My takeaway is we enter 2025 in good shape but potential negative catalysts are out there (inflation, EPS slowdown). 3/3
A 🧵on the election and markets:
Biden/Trump is a rematch no one wants, but Biden in particular has an approval rating issue. At 41%, he has the lowest of any president seeking reelection at this point in the year. The median for incumbents who won is 55%. @NDR_Research 1/5
Taking Biden's reelection bid out of the equation, presidential approval acts like any sentiment indicator. A low % implies pessimism, which tends to be bullish for stocks.
For approval rating there's a "no bad it's bad" zone but Biden's approval would need to fall 6 points. 2/5
The start of election years tends to be weak. Stocks have done better when the incumbent party has gone on to retain the White House. It's a chicken-and-egg argument. A strong economy helps stocks and therefore helps the incumbent. 3/5