Ed Clissold Profile picture
Feb 21 9 tweets 5 min read
Many conflicting prophecies on economy and markets. A 🧵on how they could fit:
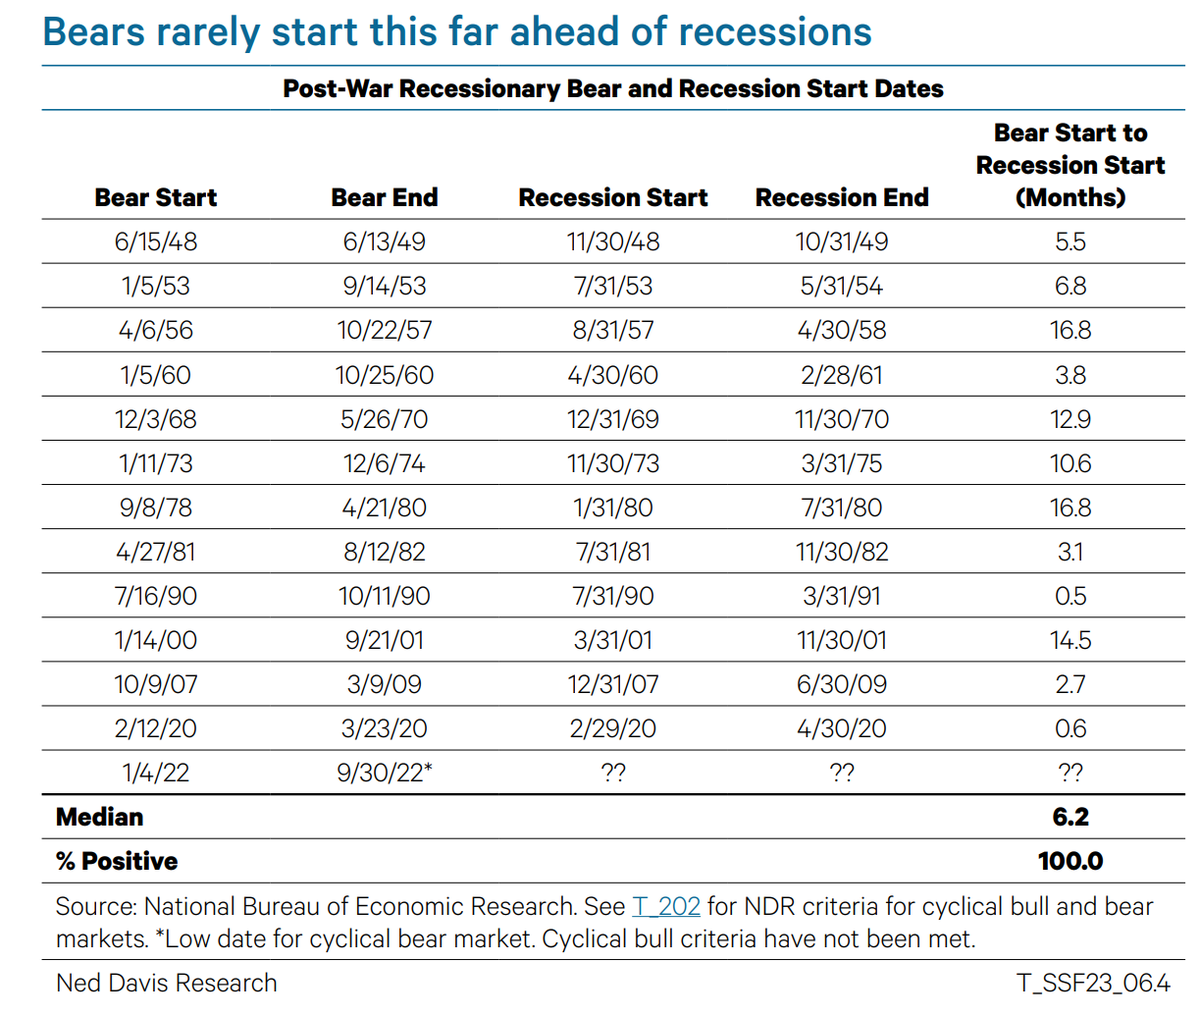
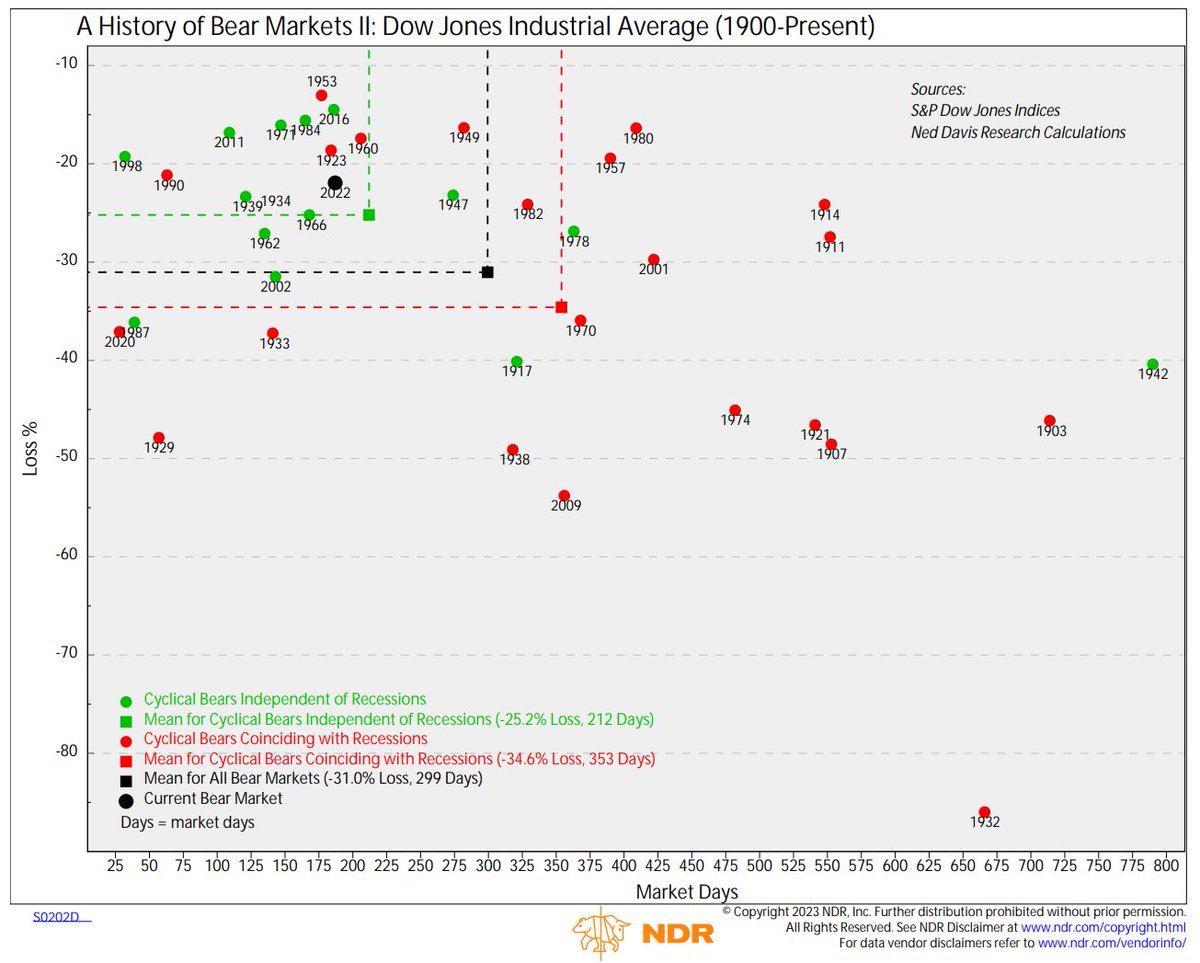
A bear market has never ended before the start of a recession. Most economists say US is not in recession but it's likely so logical conclusion is lows are not in place. Makes sense. @NDR_RESEARCH 1/9
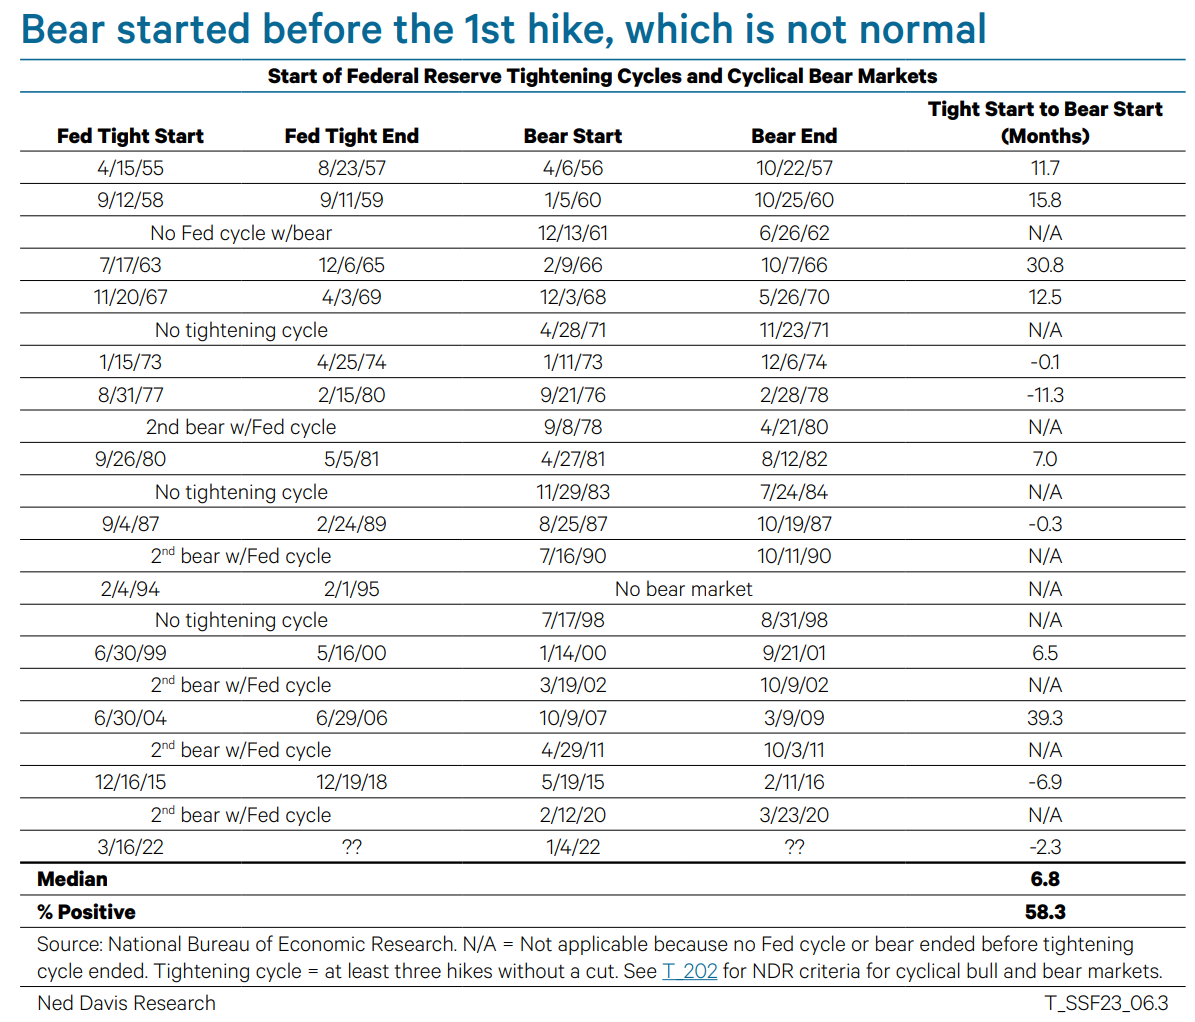
Powell has repeatedly said he is willing to push the economy into recession to get inflation in check. Bears end a median of 14 months after the last hike. The Fed is expected to hike again on March 22, implying the bear could continue well into 2024. 2/9
But…the stock market started pricing in the Fed and economic cycles earlier than normal. Bears start a median of 7 months after the 1st hike. This bear started 2.3 months before. The lead time was longer only twice before: 2015 (QE3 ended) and 1978 (we’ll come back to that). 3/9
The market was even further ahead of the economy. Bears start a median of 6 months before recessions. Longest is 17M (1956 & 1978). Recent data imply a recession is not imminent. If recession is pushed to late 2023 or 2024 there is no precedent for staying in a bear that long 4/9
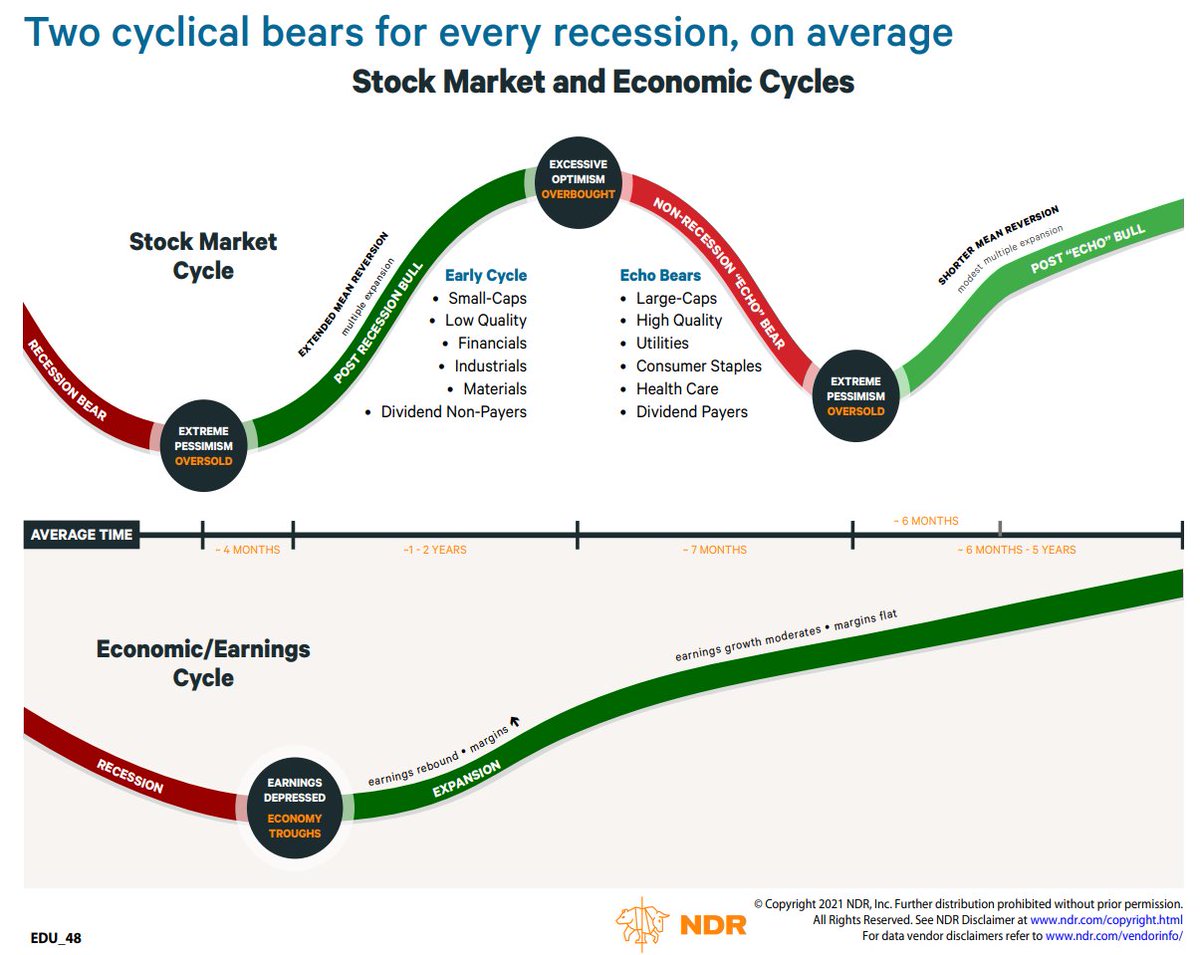
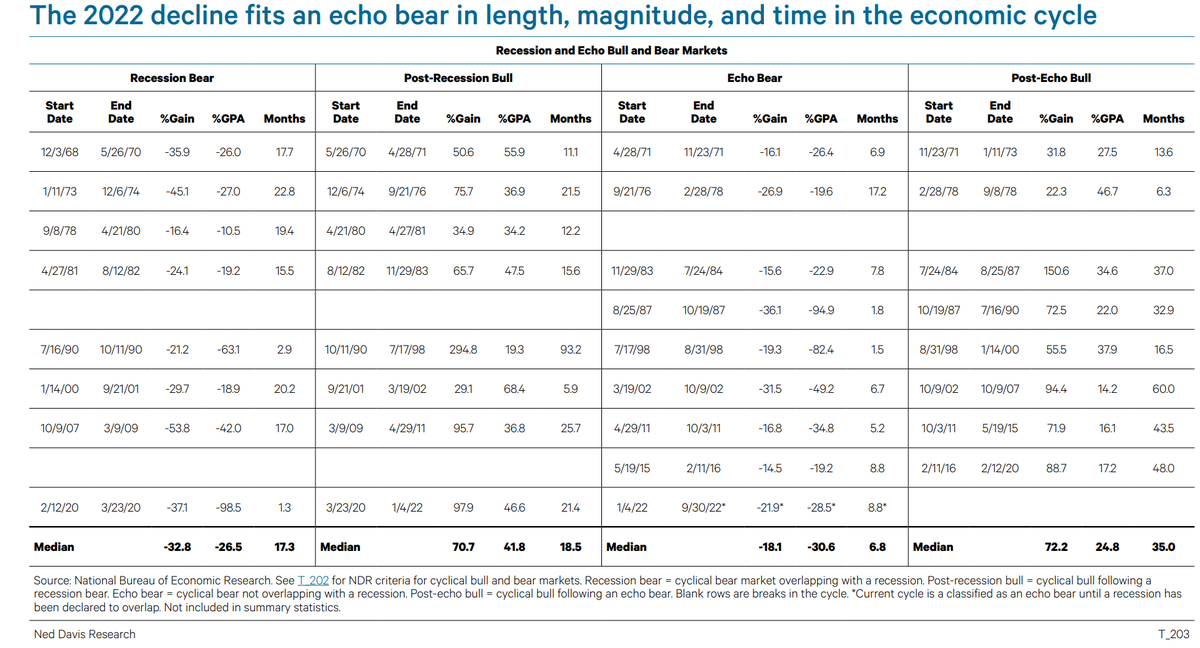
A non-recession bear in 2022 would fit with the typical cycle. For the past 60 years, the US has averaged 2 bear markets for every recession. The pattern is recession bear, post-recession bull, non-recession (or echo bear), and post-echo bull. 5/9
Post-recession bulls are the most powerful part of the cycle bc economy is surging. The US economy is so developed it can’t sustain high growth, so after about 2 years, growth slows. There are fears of a double-dip recession, but that has only happened once in 60 years. 6/9
As recession fears fade, the market enters a post-echo bull until the next recession. To date, the 2022 bear ~2yrs into the expansion and is close to the average echo bear. Perfectly normal cycle behavior! 7/9
The tricky part this cycle is the expansion could be shorter than normal, so a post-echo bull could be far less than the 3yr avg.
A (hopefully) interesting thought process, but at the end of the day, we focus on indicators. They lean bullish for now. 8/9
I had the privilege of discussing the echo bear/recession bear debate, markets pricing out rate cuts, and short-term overbought conditions with @RomaineBostick and @kgreifeld on @BloombergTV The Close. Interview starts at the 1hr 30min mark. bloomberg.com/news/videos/20…

• • •

Missing some Tweet in this thread? You can try to force a refresh
 

Keep Current with Ed Clissold

Ed Clissold Profile picture

Stay in touch and get notified when new unrolls are available from this author!

Read all threads

This Thread may be Removed Anytime!

PDF

Twitter may remove this content at anytime! Save it as PDF for later use!

Try unrolling a thread yourself!

how to unroll video
  1. Follow @ThreadReaderApp to mention us!

  2. From a Twitter thread mention us with a keyword "unroll"
@threadreaderapp unroll

Practice here first or read more on our help page!

More from @edclissold

Jan 23
Going thru charts, these 5 stood out:
1. Friday was a 10.7:1 up day (using NDR Multi-Cap universe of stocks). With the 12/29’s 35:1 up day, it triggered a 2x 10:1 breadth thrust. SPX has risen at >2x its LT average for up to 6 months after signals, on average. @NDR_RESEARCH 1/5
2. We got 2x 10:1 up day signals in July and Nov 2022. We’ve adjusted our mantra from “trust the thrust” to “trust but verify.” One breadth thrust indicator that didn’t fire in 2022 but gave one on 1/12/23 was the NYSE 10-day advances/declines. @WalterDeemer 2/5
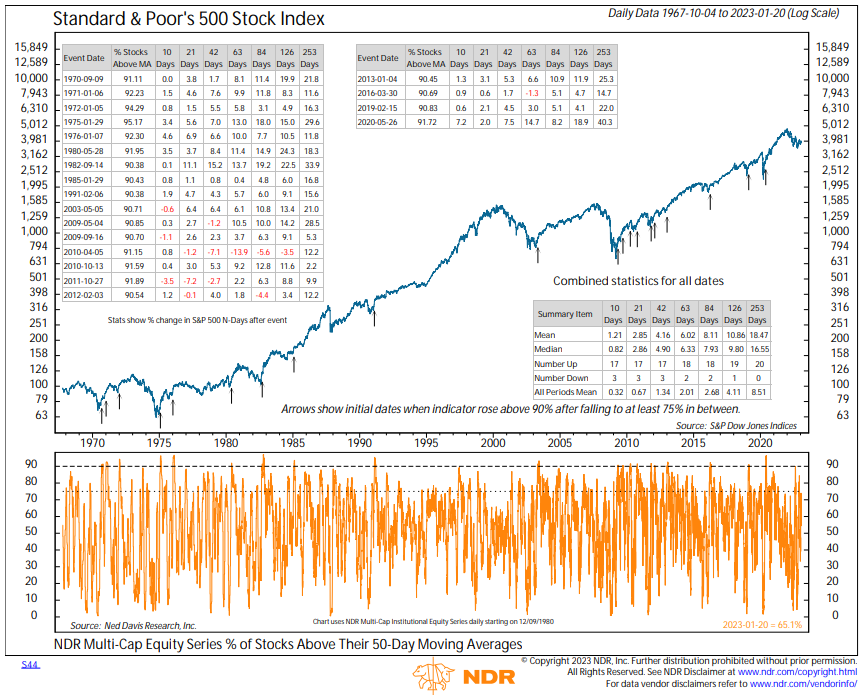
3. One verification chart we’ve been watching is the percent of stocks above their 50-day moving averages. Needs to get above 90%. Currently 65%. 3/5
Read 5 tweets
Jan 5
Going thru charts, these 5 stood out. Today's topic: Growth vs Value
1. 2022 was the worst year for the R1G vs R1V since 2000. One may think Growth would rebound. Possible but once secular regimes flip they tend to persist. Value beat Growth every year 2001-2006 @NDR_Research 1/5
2. We’ve said that this is NOT dotcom 2.0. Most mega-cap Growth stocks have positive cash flow. The early 1970s Nifty 50 is a better comparison. That being said, FANMAG is tracking major bubbles after they popped. If it walks like a duck, and quacks like a duck...2/5
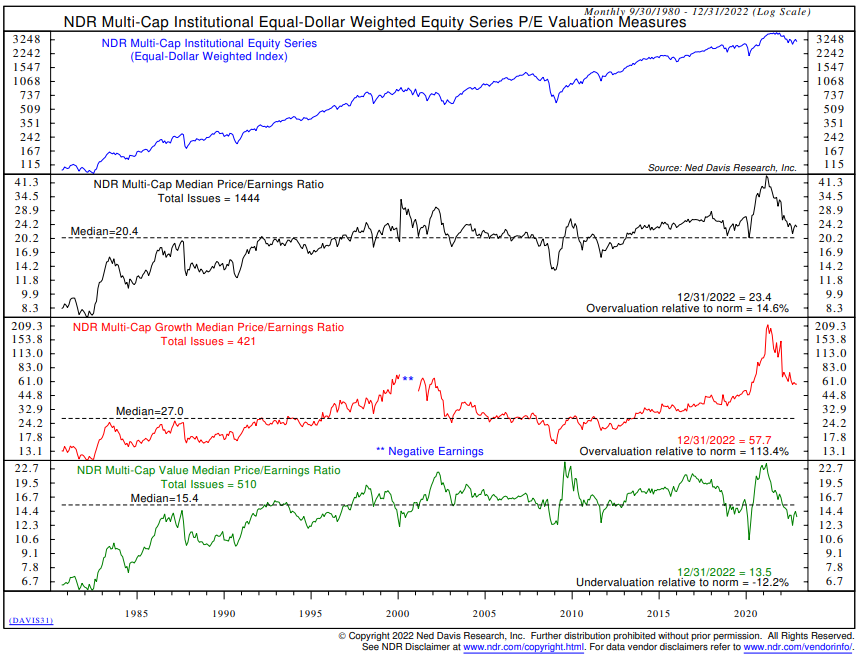
3. It's more than FANMAG. The median P/E of Growth stocks in our universe is 113% above its LT mean. The median Value stock is 12% below the LT mean. 3/5
Read 5 tweets
Nov 17, 2022
A fun part of working at @NDR_Research is I can test commonly held beliefs. 4 myths circulating finance today:
Myth #1 ⬆️ rates are bad for FANMAG stocks.
Reality: Pre-COVID, FANMAG was cyclical. It was defensive during shutdowns, but FANMAG is becoming cyclical again. 1/ Image
During shutdowns, FANMAG was among the few stocks whose business models thrived.
Put differently, I don't know of a single Growth manager who says "I was debating the terminal rate in my dividend discount model for <insert ticker here>. 2/
Myth #2: ⬆️ rates are bad for dividend stocks b/c bonds are more competitive. True...but high dividend yielders tend to have low betas. Higher rates favor low beta stocks. Basically, beta trumps yield competition. 3/ Image
Read 6 tweets
Nov 8, 2022
5 charts to ponder on Election Day:
1. Pres' party added House seats only 4 times since 1900: 1902 (TR), 1934 (FDR), 1998 (Clinton), and 2002 (W). Dem presidents lose median of 36 seats, so Dems could outperform history and still lose the House (hollow victory?) 1/5 @NDR_Research Image
2. Stocks tend to rally after mid-terms, even under 1st term Democrats. Note that mid-term years prior to elections have been esp. weak under 1st term Dems.
(Not to Twitter trolls: these are just stats, not my opinion!) 2/5 Image
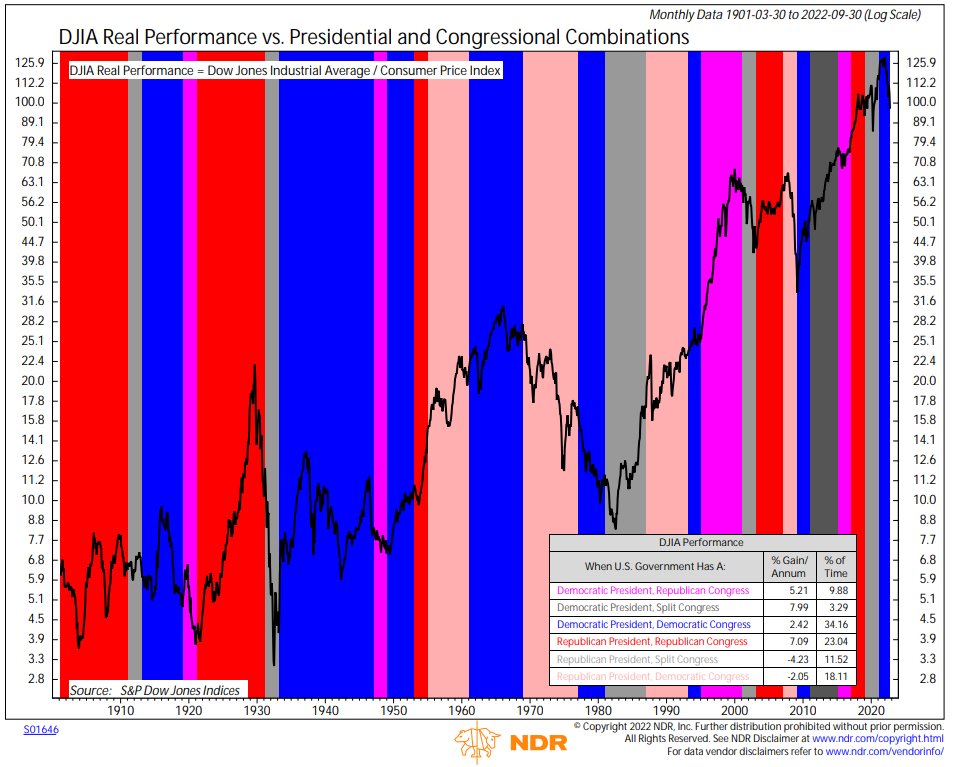
3. Historically, the market has preferred a check on Dem presidents' power. Real returns have been higher under Dem pres + Rep Congress (5.2%/yr) and Dem pres + split Congress (8.0%) than Dem Pres + Dem Congress (2.4%).
Note: not a lot of cases for some combos. 3/5 Image
Read 5 tweets
Nov 3, 2022
Going thru charts, these 5 stood out:
1. Wed was an 11:1 down day (declining volume/advancing volume). That negates the 10/17 17:1 up day, so the clock starts over for a double 10:1 up day. @NDR_Research 1/5 Image
2. Even if we had gotten a 2x 10:1 signal, the ⬆️ in breadth thrust signals recently means a mindset shift from "trust the thrust" to "trust but verify." LT breadth has yet to verify any ST breadth signals YTD. % stocks >50-day M.A. got to 61% on 11/1. Needs to be >90%. 2/5 Image
3. Small-cap relative strength in 2H is inconsistent with the recession narrative. Maybe their 2021 underperformance and strong USD offset, but a reversal in small-caps would say something about economic expectations. FWIW, we've been tactically OW small/large. 3/5 Image
Read 5 tweets
Oct 15, 2022
Going thru charts, these 5 stood out:
1. The market is entering the most bullish phase of the 4yr presidential cycle. But macro backdrop is terrible. Which will win?
We favor models over seasonality, but historical perspective provides useful context here. @NDR_Research 1/5 Image
2. The presidential cycle is more than the market randomly flipping heads more often after midterms. The combo of monetary & fiscal policy typically bottoms before midterms and accelerates thru the pre-election year. 2/5 Image
3. The @NDR_Research Monetary & Fiscal Policy Index is near a record low! The macro rationale for the post-midterm rally has not kicked in. Pres cycle needs a Powell pivot (fiscal too!).
Put differently, since 1930 U.S. has not *entered* a recession in a pre-election year. 3/5 Image
Read 5 tweets

Did Thread Reader help you today?

Support us! We are indie developers!


This site is made by just two indie developers on a laptop doing marketing, support and development! Read more about the story.

Become a Premium Member ($3/month or $30/year) and get exclusive features!

Become Premium

Don't want to be a Premium member but still want to support us?

Make a small donation by buying us coffee ($5) or help with server cost ($10)

Donate via Paypal

Or Donate anonymously using crypto!

Ethereum

0xfe58350B80634f60Fa6Dc149a72b4DFbc17D341E copy

Bitcoin

3ATGMxNzCUFzxpMCHL5sWSt4DVtS8UqXpi copy

Thank you for your support!

Follow Us on Twitter!

:(