1. @CDCgov has been told of 4 more children who died from #flu this season, bringing the 2022-23 total to 115 so far. There have been years with a higher pediatric death toll, but it's tragic to see so many kids die from flu. No word on their vaccination status. (Graph = mine)
🧵
2. @CDCgov's latest FluView report, out today, reports that #flu activity is low in most parts of the country. In the few places where it isn't low, it has declined from the previous week. It remains to be seen if flu season is effectively over or if there's more to come.
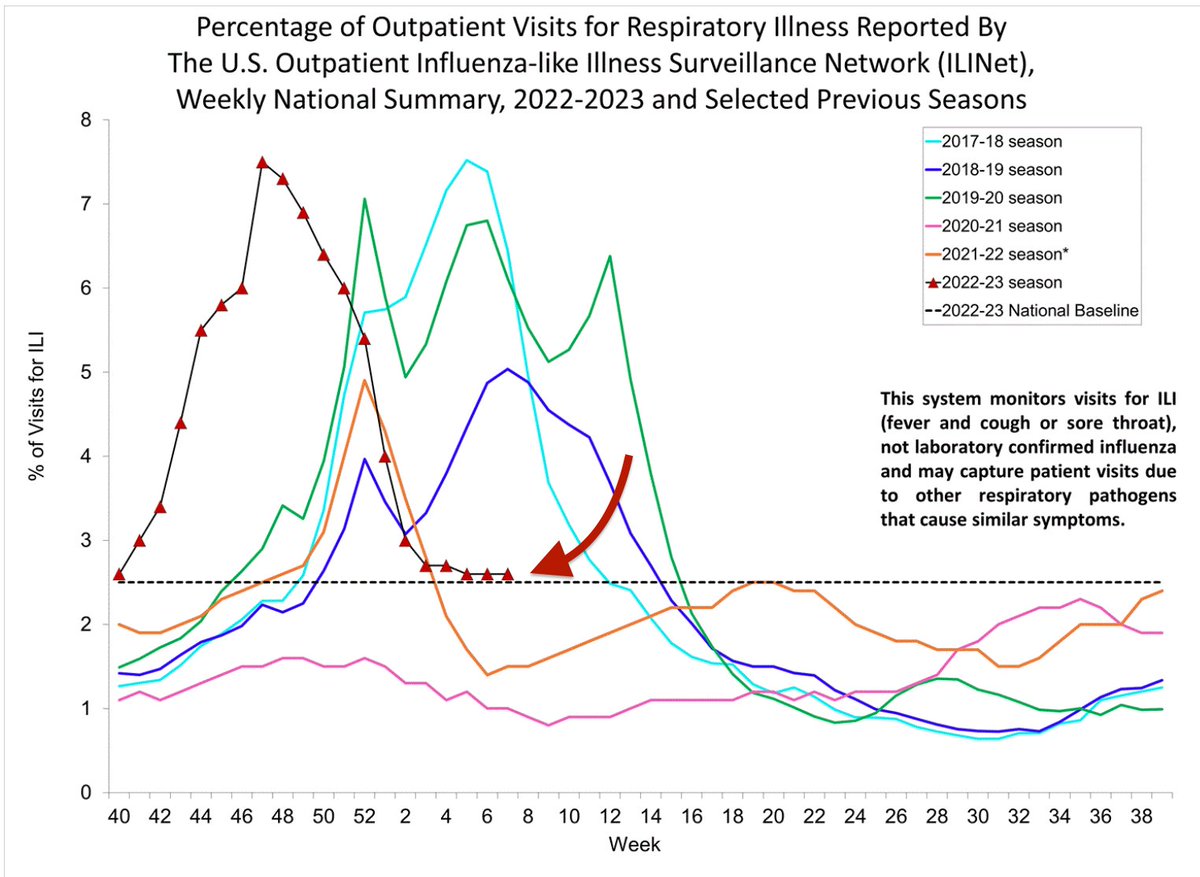
3. Oddly, though, the epi curve has not yet slipped below the epidemic threshold. Strange to see it skip along just above the threshold for 5 weeks running.
4. This season has been an #H3N2 dominant season. But where earlier in the season H3 viruses made up 75%-80% of typed viruses, now it's more like 55% of the #flu A viruses. There's been a slight uptick, percentage-wise, in flu B, but the actual numbers are small.
1. #Flu activity is at low levels now in most of the country, but the percentage of visits to health providers that are for flu-like illnesses is still limping along just above the epidemic threshold level for the 4th week in a row.
A 🧵
2. #H3N2 viruses, which have been dominant all season, have really declined. In the week ending Feb. 11, #H1N1 viruses made up the bulk of the illness-causing viruses. There's an uptick in #fluB viruses, but they make up a very small proportion of viruses so far this season.
3. @CDCgov was informed of another 5 pediatric #flu deaths last week, bringing the season total to 111. Unfortunately this number will likely continue to climb for a bit.
This graph is mine — shows how this season's pediatric flu deaths compare to previous seasons.
1. #Flu activity in most parts of the country is now low, @CDCgov reports in its latest FluView update, for the week ending Feb. 4. For the 3rd week in a row the rate of outpatient visits that are for flu-like illnesses has hovered just above the epidemic threshold.
2. That said, most of the country is reporting minimal or low activity. NYC, NM and Puerto Rico are outliers on that. You can find the FluView report here: cdc.gov/flu/weekly/ind…
3. Another 9 pediatric #flu deaths have been reported to @CDCgov, bringing the season's total to 106 so far. The days of low pediatric flu deaths are clearly over. This total is in the low end of the range of what was seen in flu seasons before Covid.
graph = mine, data ex CDC.
1. #Flu activity continues to decline across the US, though the percentage of outpatient visits for #influenza-like activity is hovering just over the epidemic threshold. There's always a chance of more flu, especially flu B, but for now the big wave is pretty much done.
A 🧵
2. #Flu outbreaks reported from long-term care facilities has dropped down considerably, a sign there's less flu circulating. Those are the folks who are most vulnerable, so this is a good thing.
3. The other highly vulnerable population is young kids. @CDCgov was notified of 6 additional pediatric #flu deaths in the week ending Jan. 28; they bring the season total to 97 so far. Sad to see pediatric flu deaths heading back towards pre-Covid levels.
(chart=mine)
1. A #flu 🧵:
Activity continued its sharp decline in the week ending Jan 21. It's barely over the epidemic threshold at this point nationally; in 6 regions it's below it. But for the fact that we've seen little #fluB activity, it would be tempting to guess flu season is over.
2. But virtually all — 99.5% — of the #flu activity so far this season has been caused by flu A. There hasn't been much flu B since the first half of the 2019-20 season. In the Before Times, it was common to see flu B in late winter, early spring. This year? Ask me in June.
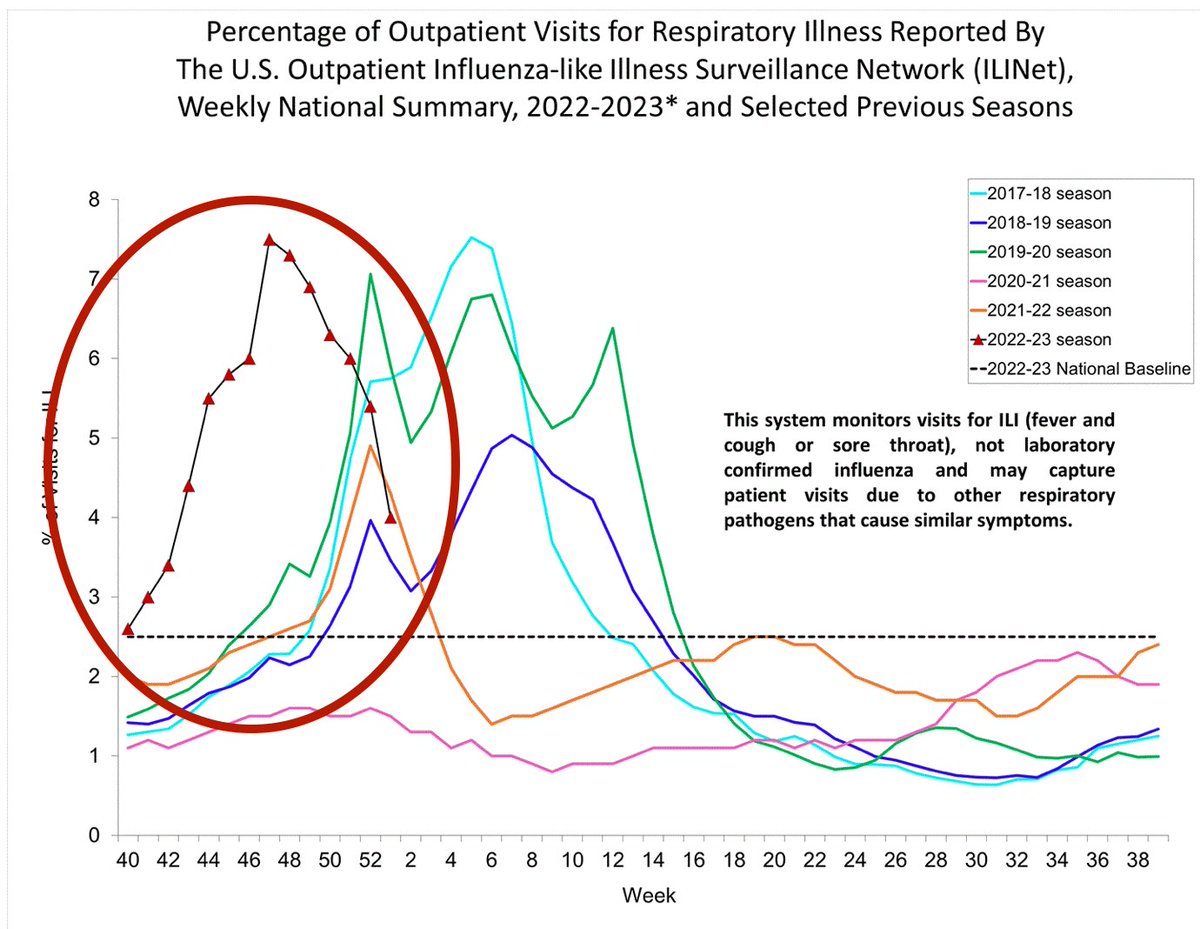
3. This #flu season took off like a bat outta hell in October, peaking Thanksgiving week. Activity reached a high apex, but the drop off has been swift. The image on the left shows #influenza-like illness the week ending Jan. 7. On the right, the week ending Jan. 21.
1. Time for a #flu 🧵 #Influenza A, which started circulating at high levels earlier this season than in any season since the 2009 #H1N1 pandemic, is declining as quickly as it climbed. In several parts of the country, doctor visits for flu-like illness are below epidemic levels.
2. It is truly remarkable to see the map of #flu-like activity show so little red in the 2nd week of Jan. It is like this year's flu season shifted forward 2 months or so.
Last week on the left. Same week in 2018, on the right, as the 2017-18 season started to take off.
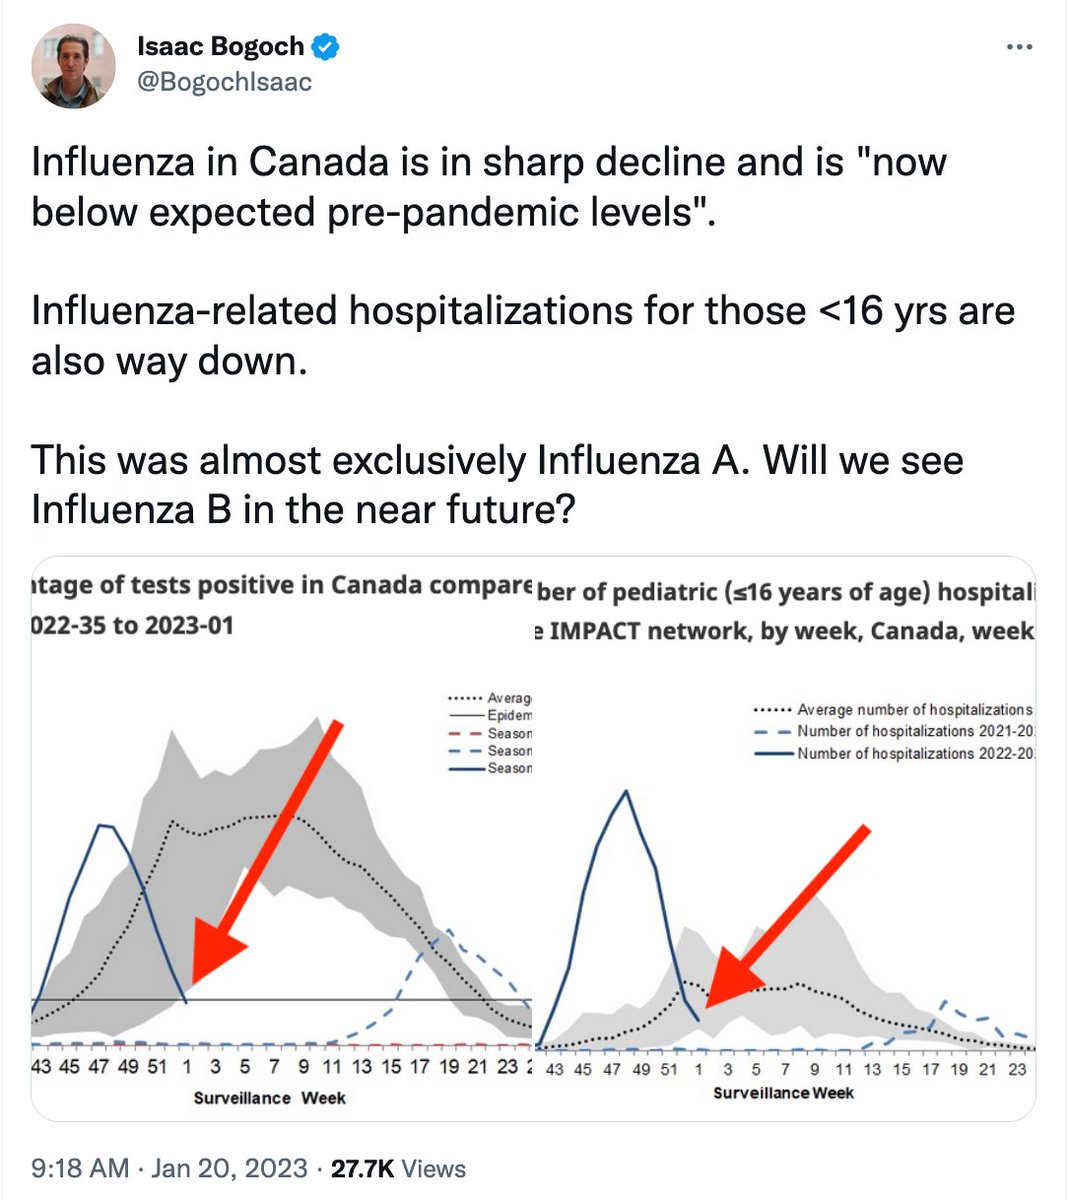
3. Canada is seeing the same phenomenon, reports @BogochIsaac, who raises a key question: Virtually all the #flu activity so far has been #influenza A. Do we have a flu B wave in store? Pre-Covid, flu B often hit late in the season, after flu A had moved through. Will it this yr?
1. A #flu 🧵
Flu activity continues to decline in most parts of the US.
Virtually all of the flu transmission so far has been influenza A, which means we could get some flu B activity later, in a smaller wave. That was not uncommon in flu years pre-Covid.
2. Then again, some years there's a single, sharp wave of flu activity and once it's done, we're done. That's what happened in 2017-2018, which was a severe flu season. (This season, so far, has not been a severe season. It has been an unusually early season.)
3. Five more kids have died from #flu, bringing the total to 79 to date. That's a shock after the first 2 years of the Covid pandemic when only 45 pediatric flu deaths were reported.
But 79 is still low compared to pre-Covid years. The big year (left) was the H1N1 pandemic.