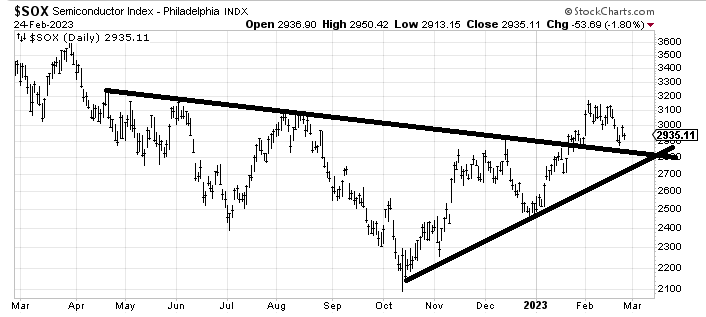
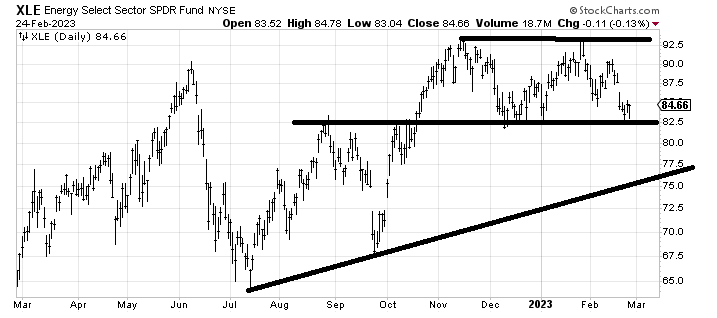
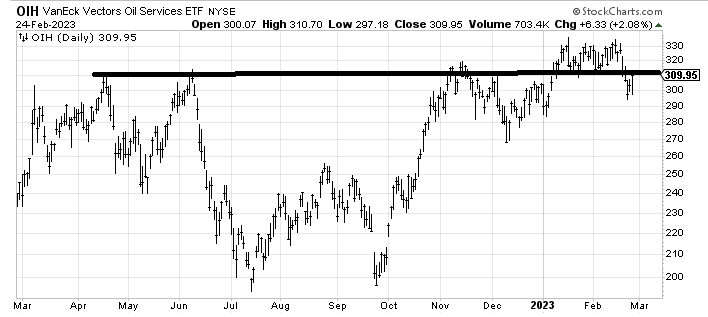
On most charts we find ourselves at the intersection of the support lines I have been drawing here for a few weeks. Of course now everyone sees them!!!
DJIA. Made its high in December and is back to support. Down on the year.
Transports.
Utes. Channel check.
SPX. The blue line is support. Because we have only had a foray under it twice & for short periods of time.
Naz
IWM. Similar to SPX's blue line only here we have had short periods over it.
QQQ. Had most volume on Friday since first days of Feb.
QQQJ. I like to watch the Juniors even though they don't trade much.
SOX
Bank Index. Consecutive green days (Thurs/Fri) for the first time in a month.
IGV
XLI.
XLE
OIH. Broke under 310. Trying to recapture it.
XLB. The action on Friday is interesting.
XLV. My beloved drugs dropped out of the channel. Sad face.
XLP.
XME. There is a lot going on here but the black lines are fan lines. (#GIK)
EEM
GLD
Bondaleros. Yield on the 10 yr.
DXY.
McClellan Summation Index.
Insiders
Citi Panic/Euphoria
HYG
The best news of the day is that Barron's discovered how crummy the market has been.
• • •
Missing some Tweet in this thread? You can try to
force a refresh
The bears will see resistance overhead. The bulls will say, if we pullback from here, won't we form (on some charts) h/s bottoms?
Reminder: this is art, not science.