*THREAD*
Whenever Black crime is brought up, usually the reflexive response is White men are school shooters, mass shooters and serial killers
We are also told that Black criminality is due to racist policies
However when we look at the data, we find different results
🧵👇
Whenever Black crime is brought up, usually the reflexive response is White men are school shooters, mass shooters and serial killers
We are also told that Black criminality is due to racist policies
However when we look at the data, we find different results
🧵👇
https://twitter.com/rude_trini/status/1629146401572810755
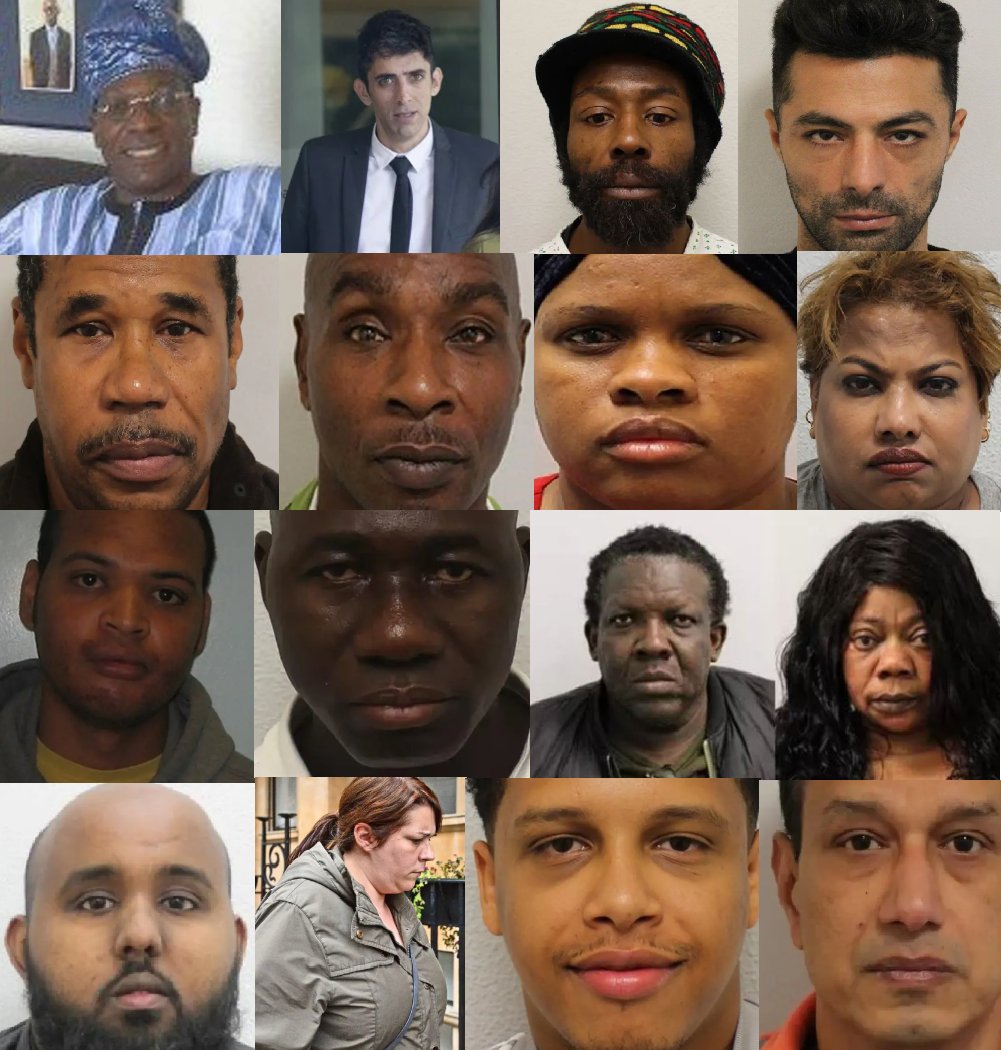
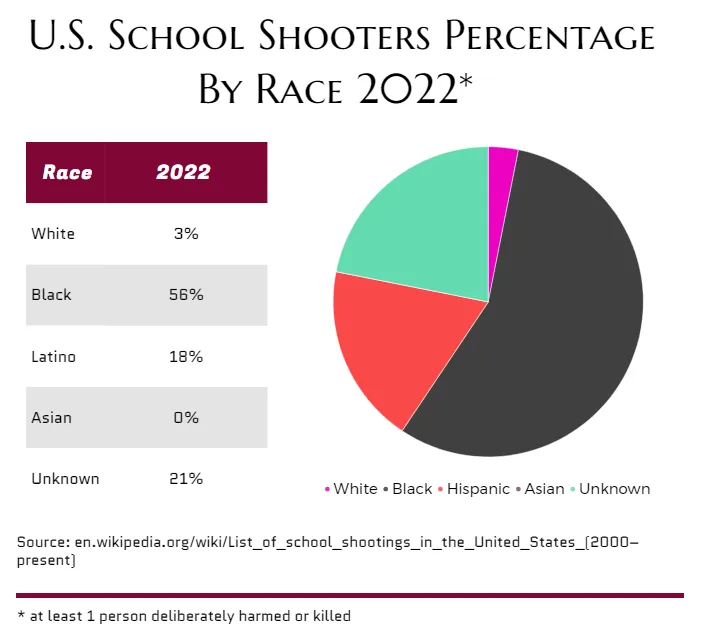
In 2022, only 3% of known school shooters were White. The majority (52%) were committed by the Black demographic
School shooting is defined as an incident on school premises where at least 1 person was deliberately harmed or killed
Source: en.wikipedia.org/wiki/List_of_s…
School shooting is defined as an incident on school premises where at least 1 person was deliberately harmed or killed
Source: en.wikipedia.org/wiki/List_of_s…
When we look at mass school shootings, where at least 5 people were harmed or killed, we find only a third were committed by White people since the turn of the century
Blacks accounted for 31.4%, despite only being 13% of the population
Blacks accounted for 31.4%, despite only being 13% of the population

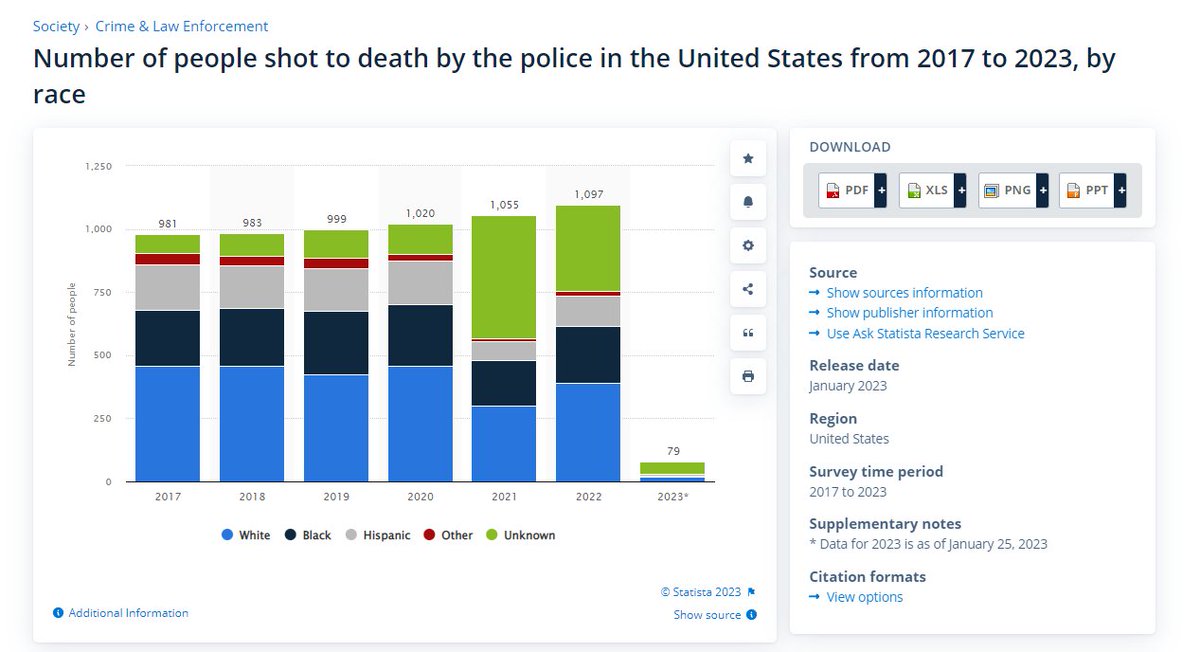
When it comes to mass public shootings since 1982, Whites account for 53% according to Statista, which still shows an underrepresentation for population size (Since 1980, Whites have fallen from 80% to 60% of the U.S. population)
statista.com/statistics/476…
statista.com/statistics/476…

Yet when we comb through recent data, we find far different results
Between 2019-2022, only 14% of mass shootings were committed by White people
2019: en.wikipedia.org/wiki/List_of_m…
2020: en.wikipedia.org/wiki/List_of_m…
2021: en.wikipedia.org/wiki/List_of_m…
2022: en.wikipedia.org/wiki/List_of_m…
Between 2019-2022, only 14% of mass shootings were committed by White people
2019: en.wikipedia.org/wiki/List_of_m…
2020: en.wikipedia.org/wiki/List_of_m…
2021: en.wikipedia.org/wiki/List_of_m…
2022: en.wikipedia.org/wiki/List_of_m…

Research from Radford University showed Blacks are disproportionately represented as serial killers in every decade since 1900 & since the turn of the century, they have been the majority of serial killers despite only making up 12–13% of the population
maamodt.asp.radford.edu/Serial%20Kille…
maamodt.asp.radford.edu/Serial%20Kille…

When the Jussie Smollett hate hoax originally broke, the media, politicians, and celebrities were quick to announce the United States as a White supremacist nation where it’s dangerous for Black men to walk the street
90% of media coverage in the U.S. focuses on White-on-Black violence, yet according to the National Crime Victimization Survey 2021, Black people are 35 times more likely to attack a White person than the other way around.
Source: bjs.ojp.gov/content/pub/pd…
Source: bjs.ojp.gov/content/pub/pd…

We also see organisations like BLM propagate the idea that Black men are disproportionately killed at the hands of White police officers, yet in between 2017–2022, 74% of all known individuals fatally shot by the police were not Black
statista.com/statistics/585…
statista.com/statistics/585…
When it comes to unarmed criminals, 6.83% of Whites are killed compared to 7.28% of Blacks, this is an insignificant difference, especially when we consider that Blacks are 2.88x more likely to be involved in violent crime
washingtonpost.com/graphics/inves…
washingtonpost.com/graphics/inves…
Further, analysis found that there were no racial differences in police shootings [1]
Another study found that Black and Hispanic officers were more likely than White officers to shoot unarmed Black individuals [2]
1: nber.org/papers/w22399
2: ric-zai-inc.com/Publications/c…
Another study found that Black and Hispanic officers were more likely than White officers to shoot unarmed Black individuals [2]
1: nber.org/papers/w22399
2: ric-zai-inc.com/Publications/c…
Last year, the FBI released data showing that the Blacks now account for 60% of homicides in the US.
This social phenomenon is most commonly blamed on historic racism, poverty, police bias, and fatherless homes
fbi.gov/how-we-can-hel…
This social phenomenon is most commonly blamed on historic racism, poverty, police bias, and fatherless homes
fbi.gov/how-we-can-hel…

Yet these stats are replicated in the UK, where 13% of London’s population is Black, yet they account for 61% of fatal stabbing perpetrators
99.9% of Black Londoners are from families who have arrived within the last 70 years as economic migrants
london.gov.uk/press-releases…
99.9% of Black Londoners are from families who have arrived within the last 70 years as economic migrants
london.gov.uk/press-releases…

Generational trauma and Jim Crow laws cannot be used to justify these numbers
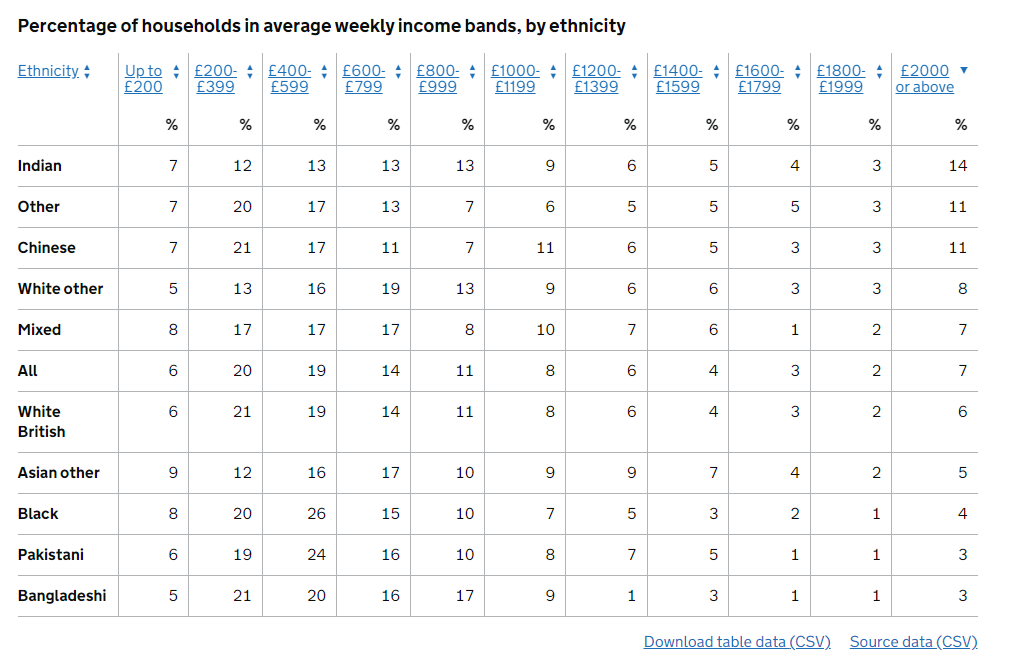
Nor can poverty as Pakistani & Bangladeshi households are below Black households regarding weekly income yet they have far lower rates of violent crime
ethnicity-facts-figures.service.gov.uk/work-pay-and-b…
Nor can poverty as Pakistani & Bangladeshi households are below Black households regarding weekly income yet they have far lower rates of violent crime
ethnicity-facts-figures.service.gov.uk/work-pay-and-b…
So what about poverty in the US?
In NYC, Latino (23%) & Asians (23%) have higher rates of poverty than Blacks (19%), yet the Black murder arrest rate was nearly 9 times higher than Asians
1: …oodorg-wp-production.s3.amazonaws.com/uploads/2022/0…
2: www1.nyc.gov/assets/nypd/do…
In NYC, Latino (23%) & Asians (23%) have higher rates of poverty than Blacks (19%), yet the Black murder arrest rate was nearly 9 times higher than Asians
1: …oodorg-wp-production.s3.amazonaws.com/uploads/2022/0…
2: www1.nyc.gov/assets/nypd/do…


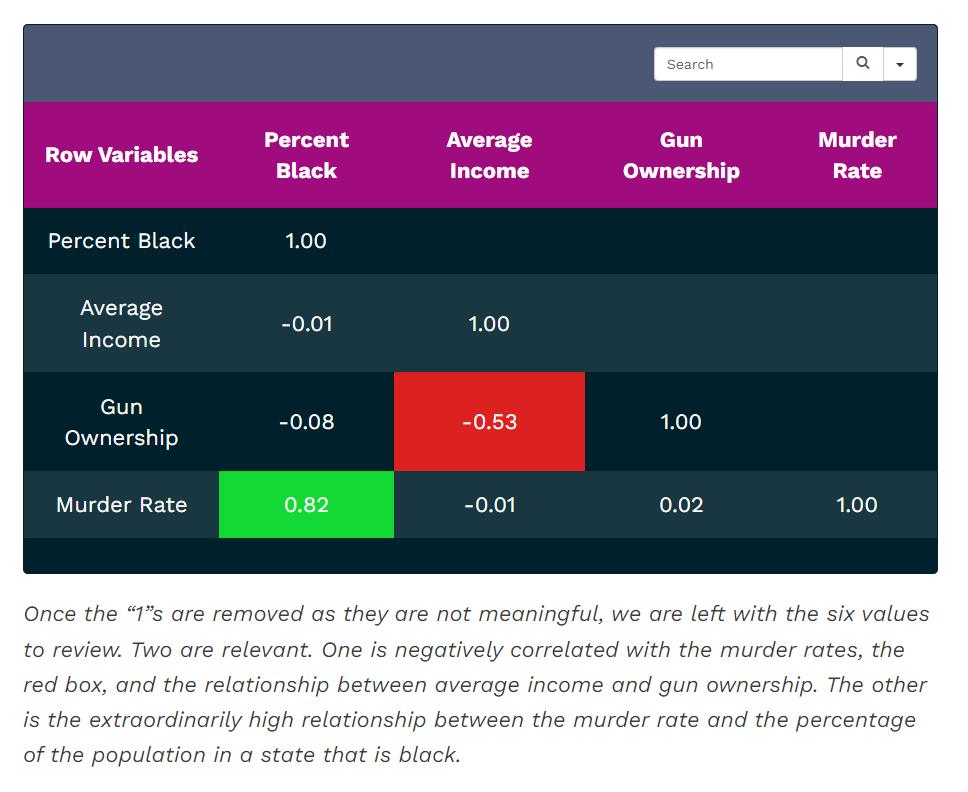
A state-by-state covariance analysis tested murder rate by avg. income, gun ownership & % of Black population
The data showed that % of Black population was emphatically the strongest predictor, with avg. income/gun ownership barely registering a blip
brightworkresearch.com/what-is-the-mo…
The data showed that % of Black population was emphatically the strongest predictor, with avg. income/gun ownership barely registering a blip
brightworkresearch.com/what-is-the-mo…
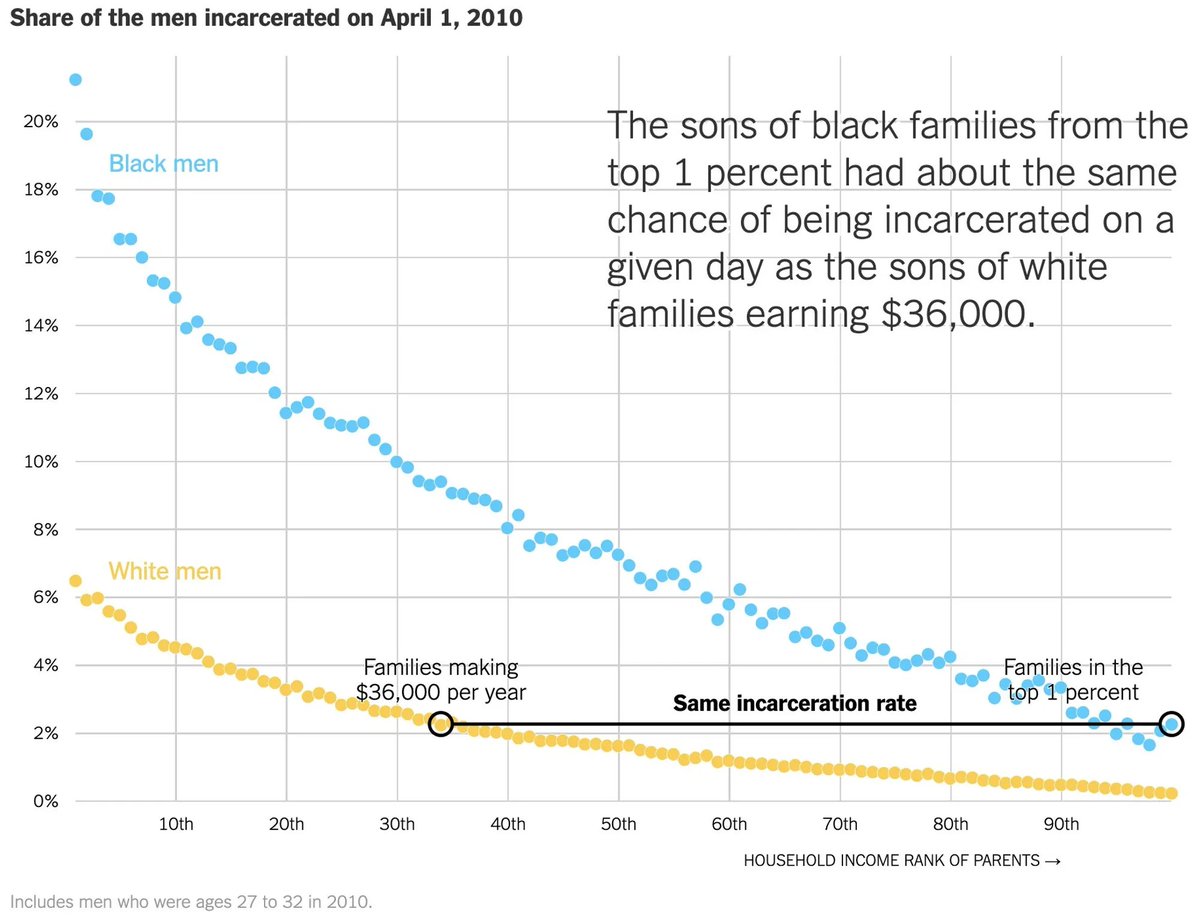
Research has shown that the sons of Black families from the top 1 percent had around the same chance of being incarcerated as the sons of a White family earning $36,000 per year
equality-of-opportunity.org/assets/documen…
equality-of-opportunity.org/assets/documen…
Many would argue this is evidence that the judiciary system is racist, yet bias often operates in the other direction. The epiphenomenon of White flight is Bronx juries, where Black criminals are acquitted for cut-&-dried cases because the jury is diverse
nytimes.com/1988/12/05/nyr…
nytimes.com/1988/12/05/nyr…

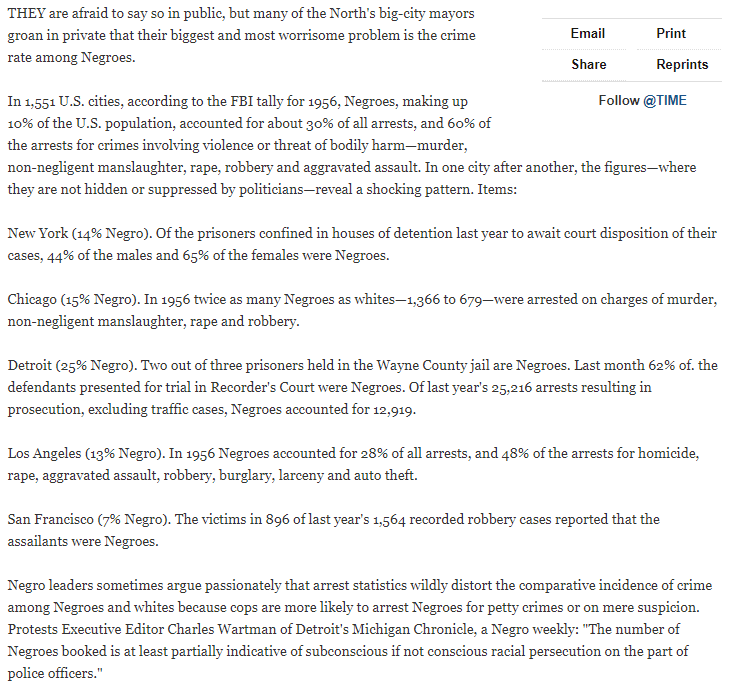
The destruction of the Black nuclear family & ‘fatherless homes’ have been cited as a main driver for Black overrepresentation in crime
According to the FBI tally for 1956, the Black population (10%) accounted for 60% of the arrests for violent crime
content.time.com/time/subscribe…
According to the FBI tally for 1956, the Black population (10%) accounted for 60% of the arrests for violent crime
content.time.com/time/subscribe…
Yet in the 1950s, the marriage rate was around the same between White and Black demographics
link.springer.com/article/10.100…
link.springer.com/article/10.100…

The Times article uses terms like “subconscious racial persecution” and speaks about “conspiracy of concealment” around Black criminality.
Despite the civil rights movement and affirmative action, 65 years later the crime rates and the excuses remain the same
Despite the civil rights movement and affirmative action, 65 years later the crime rates and the excuses remain the same
Thanks to @GhostOfMarcuse and @Klaus_Arminius for helping me source data for this thread
Read the full article here.
medium.com/@TheCompositeG…
Read the full article here.
medium.com/@TheCompositeG…
• • •
Missing some Tweet in this thread? You can try to
force a refresh