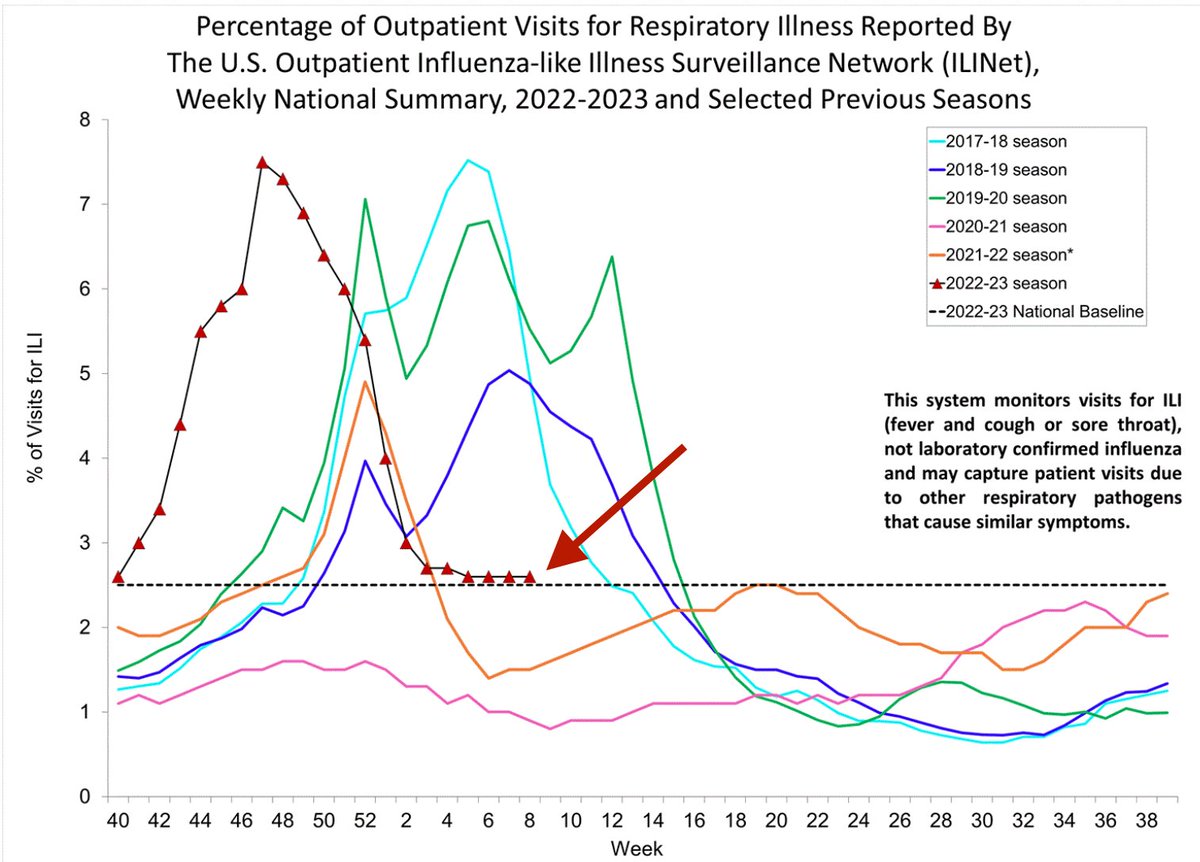
1. #Flu activity has dropped off dramatically since its peak around Thanksgiving, but this odd early season still can't seem to bring itself to an end. For the 6th week in a row it is hovering just above the epidemic threshold.
A 🧵
2. That said, rhinoviruses & human coronaviruses are causing more #influenza-like illness right now than #flu is, according to the Biofire syndromic trends. syndromictrends.com
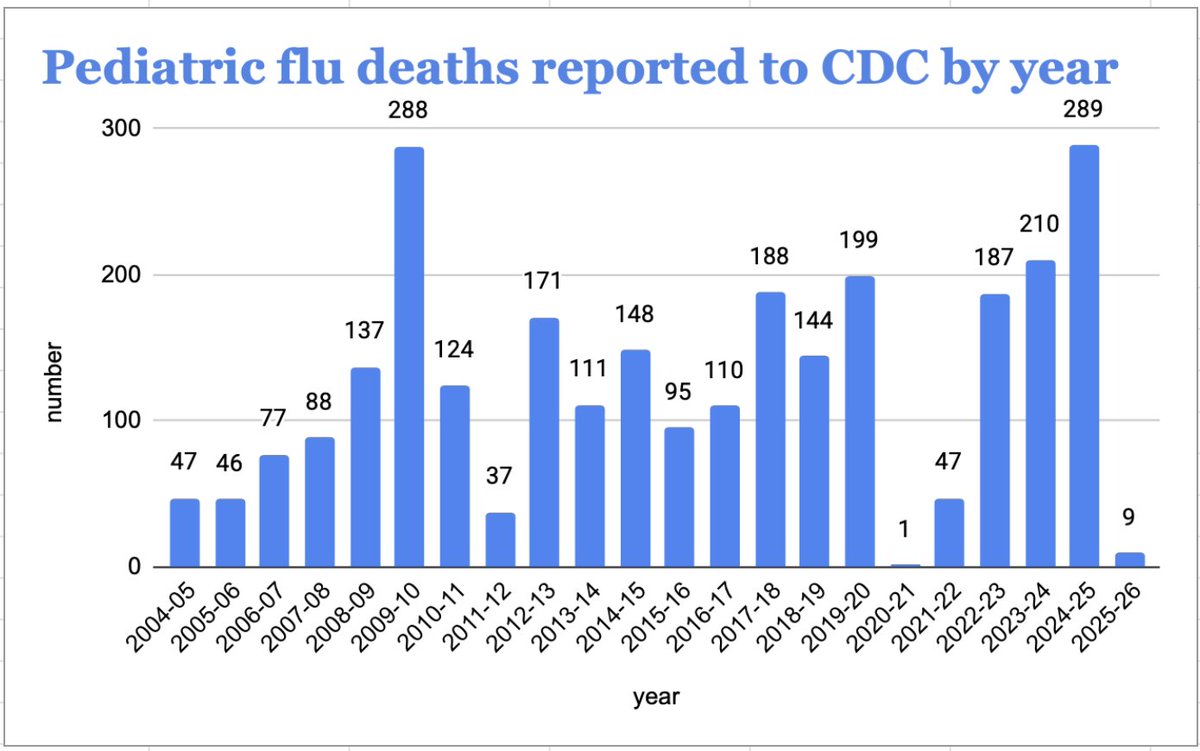
3. @CDCgov has been informed of 2 more pediatric #flu deaths; both kids died in early December. So far this season there have been 117 confirmed flu deaths in children. This graph (mine, with data from CDC) gives you a picture of how this year compares to others re: kids.
4. The burden of illness from this #flu season is on the mildish side. @CDCgov estimates 26M illnesses, 290K hospitalizations & 18K deaths. In terms of severe illness & deaths, many years have been worse.
A lot of flu doesn't necessarily = severe season. cdc.gov/flu/about/burd…
5. Very few places in the country are still reporting #flu activity, as you can see on the map on the left. On the right is the same week in the 2017-18 flu season, which was a very bad year. Flu season has wound down very early in 2022-23.
6. One last thing: Still no sign of a surge in #influenza B cases. Doesn't mean there won't be some later; we'll know when we know. There's been remarkably little #flu B this year. It's made up about 1% of all cases where viruses were subtyped. cdc.gov/flu/weekly/
• • •
Missing some Tweet in this thread? You can try to
force a refresh
1. A #flu & other respiratory bugs update:
This year's flu season was pretty much exquisitely timed to coincide with the holidays, a great way to spread respiratory illness across the various age groups. Right now there's lots of flu, lots of #RSV & #Covid is on the rise again.
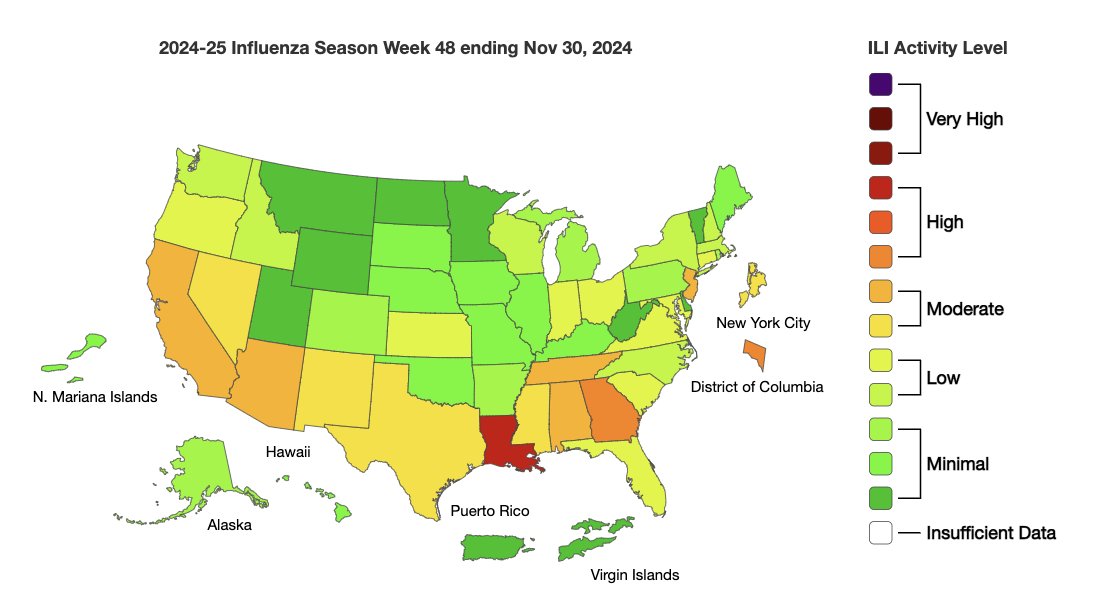
2. Check out the difference 1 month made. The map on the left shows #flu activity at the end of November, just after Thanksgiving. The map on the right shows the situation as of Dec. 28. The darker the color, the more flu-like illness making the rounds.
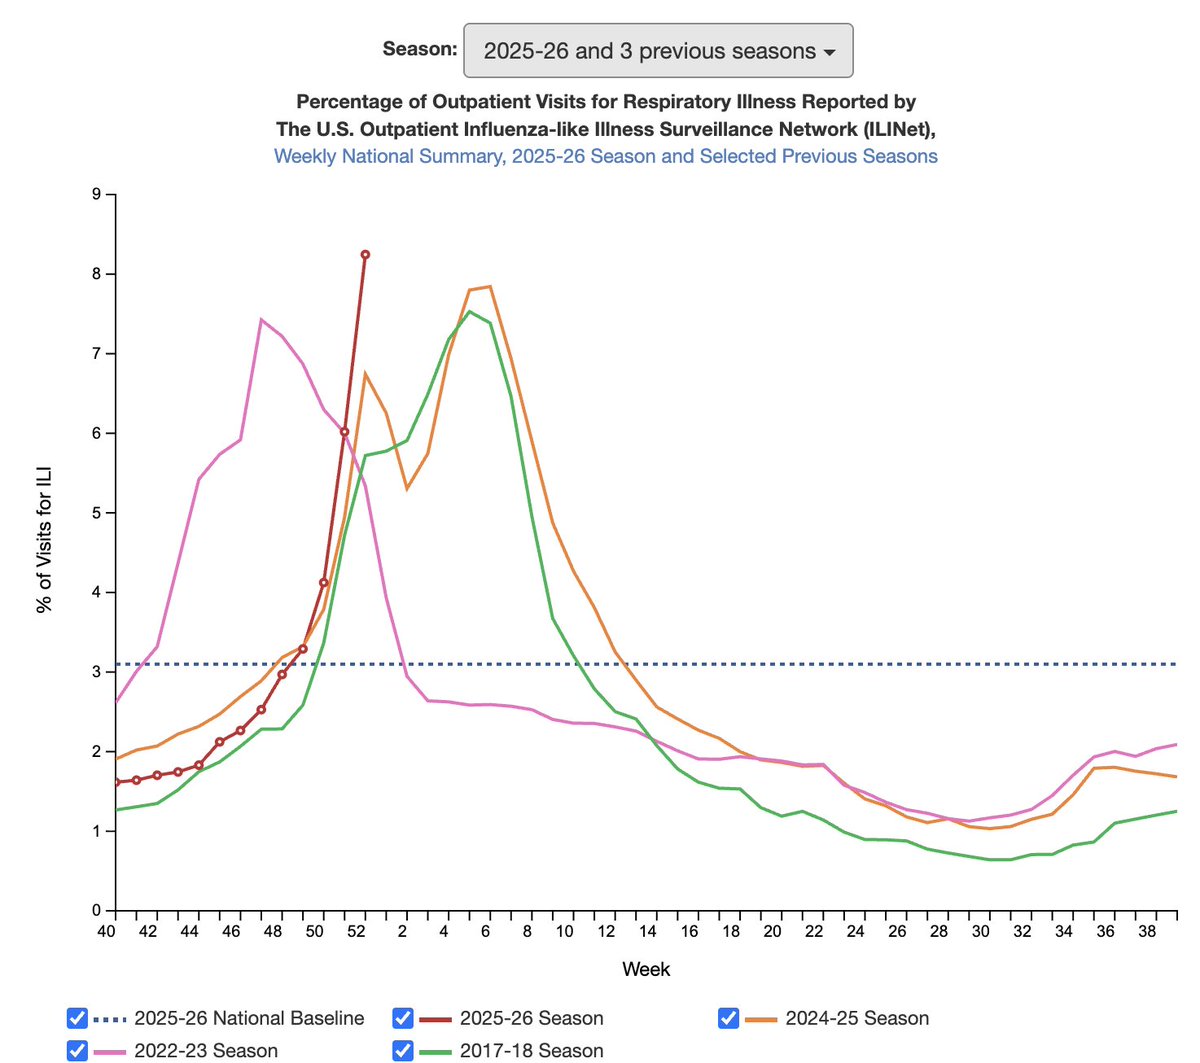
3. For the week ending 12/28, the percentage of outpatient visits for #influenza like illness (red arrow) was near the peak of activity in 2019-20, though that season (dark blue line) had 3 peaks. We're still below the peaks of 2022-23 (pink) & 2017-18. Will we have a 2nd peak? Maybe.
1. Some thoughts on #H5N1 #birdflu in cows. A 🧵
A bunch of new herds were announced by a couple of states today — Colorado and Iowa. The former reported +5 & looks like it may have another pending; It now has 18 in total, maybe 19. Iowa reported 2 more, taking it to 10.
2. To the best of my ability to keep up — and that's being challenged — I think there have been 125 herds reported in 12 states since the end of March. This graph combines @USDA's numbers from yesterday with the newly reported herds from Colorado & Iowa.
3. But @USDA threw a wrench into the works today. It updated its exceedingly wonky #H5N1 #birdflu in cows landing site. Some things work better, but the cumulative number of herds was lowered by 4 (from yday) with no explanation. USDA now says 112 herds in 12 states.
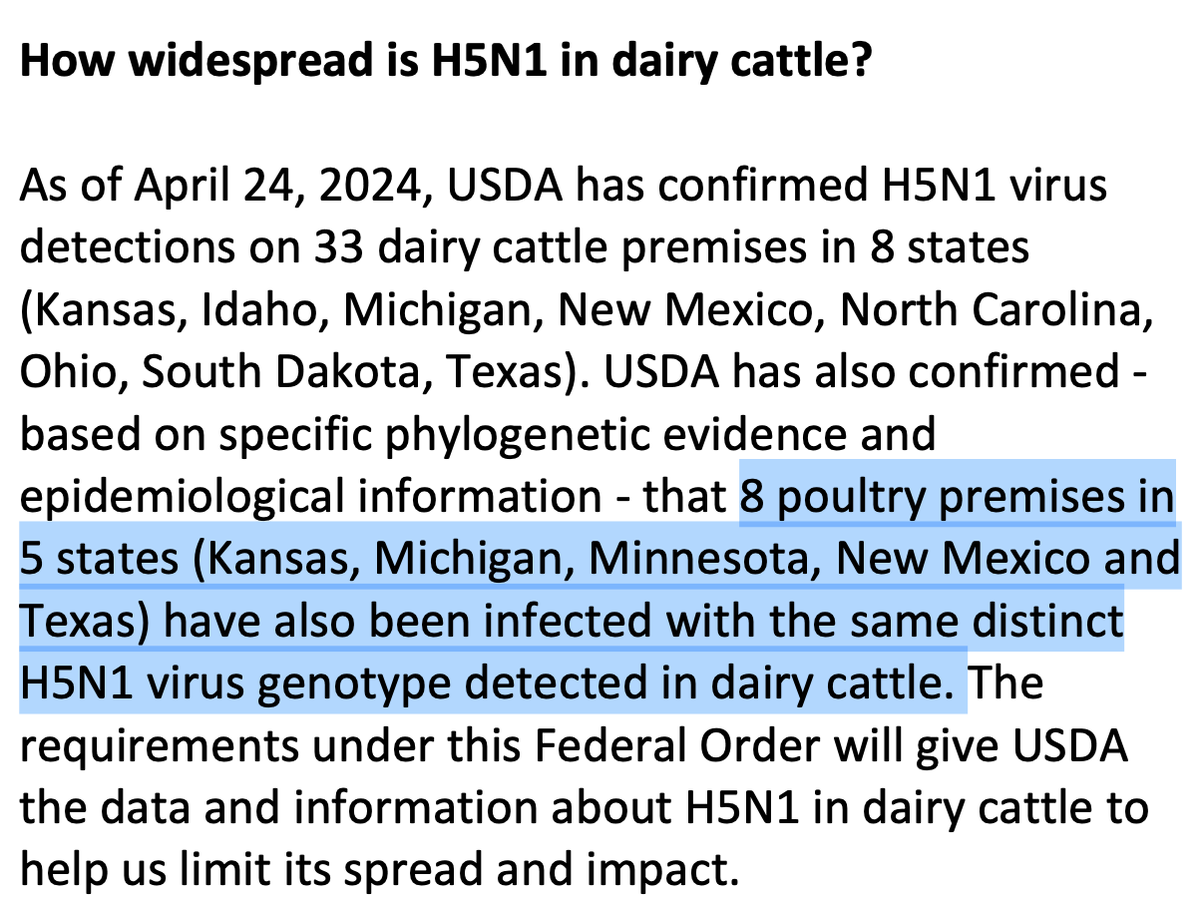
1. @USDA posted an FAQ today about the federal order restricting movement of dairy cattle infected with
#H5N1 #birdflu. Interesting information therein.
A 🧵
New to me: USDA says 8 poultry operations in 5 states have had poultry outbreaks with the virus detected in cows.
2. Minnesota hasn't reported #H5N1 #birdflu in cattle, but it has had at least 1 poultry outbreak with the cattle virus, @USDA reveals. More evidence, probably, that the virus is far more widely spread than has been realized. The FAQ is here: aphis.usda.gov/sites/default/…
3. The federal order on the movement of dairy cows goes into effect 4/29. @USDA is setting what looks like an ambitious timeline for processing of tests, especially "non-negative" tests that must then go for confirmatory testing at the USDA lab in Ames, Iowa. #H5N1 #birdflu
1. Listening to an @ASTHO - @IDSAInfo - @CSTEnews webinar on #H5N1 #birdflu in cows.
Of interest so far:
— @USDA is monitoring feral swine; no detections of H5 so far.
— in the "small number" of samples tested to date, doesn't look like cows are shedding virus thru feces.
2. @USDA Rosemary Sifford said the infections are "mostly" being seen in lactating herds.
1 herd was found to be positive despite the fact there were no clinical signs among the cows.
Sifford said USDA doesn't yet know how long infected cows shed virus.
#H5N1 #birdflu
@USDA 3. Sonja Olsen from @CDC says there've been 6 infections detected in cats on dairy farms. Not sure I've seen the exact number. #H5N1 #BirdFlu
1. A 🧵 on #flu, #Covid & #RSV (mostly flu). The
#influenza-like illness season is pretty much over. The percentage of people seeking care for ILIs is below 2.9%, that dotted line. You can catch flu at any time of the year, but chances of catching it now thru the summer are low.
2. It's not just #flu. #Covid activity now is at low levels nationally and #RSV activity has declined to the point where @CDCgov says the season is ending. Hallelujah. cdc.gov/respiratory-vi…
3. It hasn't been a particularly bad #flu season, but the estimated number of hospitalizations for flu has been pretty high — one of the highest in recent years. (red line) The 2017-18 season, which was harsh, was worse. CDC estimates there were 370K hospitalizations this year.
1. A 🧵on #flu & #Covid activity trends based on reports today from @CDCgov. Most of the data is for the week ending Feb. 3. The #influenza-like illness (ILI) season seems to have peaked at the end of Dec, with declines in flu, Covid & #RSV since then. But the season isn't over.
2. There was a bit of an uptick in #flu activity in the central & south central US. It corresponds with an increase in flu B detections there. Pre-Covid, flu B often arrived in a late season wave. We may see that again this year.
Map on left is the week ending 1/27; right is 2/3.
3. An additional 8 pediatric #flu deaths were reported to @CDCgov in the wk ending 2/3. The season's death toll in kids now stands at 74, which is awful, obviously, but not as bad as most years pre-Covid. But if there's a lot of flu B activity, this number could climb.