
For those newer to corporate debt markets, we put together a primer on basic credit concepts such as recovery rates, the capital structure “waterfall,” leverage and the basics of covenants. See the following thread for details.
1/20
1/20
First, in order to define the waterfall, the exhibit below provides a quick refresher on a general capital structure hierarchy.
2/20
2/20

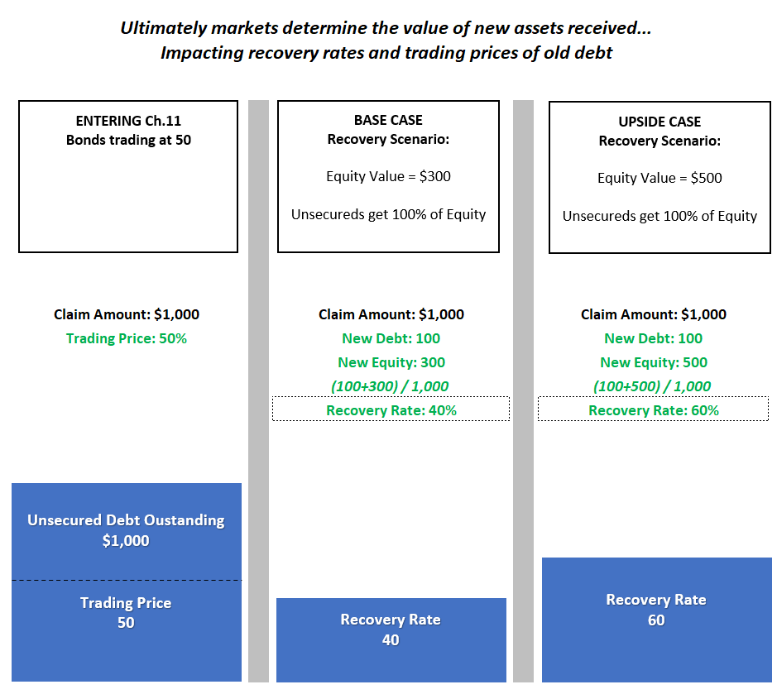
Recovery rate is the amount received in bankruptcy by a bond/loan. The recovery rate comes from new debt, cash, equity or a combination. If you are an old creditor, Recovery Rate = New Assets/Debt Claim.
3/20
3/20
The term “waterfall” comes from the “Absolute Priority” rule in the US Bankruptcy Code where junior classes of creditors cannot receive value unless all senior classes are either paid in full or vote to accept a restructuring plan. So value flows down, like a waterfall.
4/20
4/20

If there is insufficient value in the restructured company, sub tranches suffer any shortfall. While simple in theory, Absolute Priority is complex and arguments are made about what new debt & equity is worth, seniority of claims etc. Settlements are common between classes.
5/20
5/20
Below we walk through a restructuring example where new debt is worth par and the equity value equals what was determined during ch.11. This is meant to illustrate how the subordinated tranche suffers the shortfall in distributable value.
6/20
6/20
In our example, PRECo has $2.5b of debt. POSTCo (via Ch.11) is valued at $2b, can support $1.25b of debt, leaving $750mm of equity. In the waterfall, value flows down up to the $2b of distributable value. So, Sr Sub recovers 33.3% and PRECo equity gets zero.
7/20
7/20

Since the OLD Sr Unsecured and OLD Sr Sub get their recoveries mostly in new equity, they are likely to see the greatest fluctuation in recovery rates. This is because the market may value POSTCo differently than what the restructuring plan says the equity is worth.
8/20
8/20
Leverage is typically defined as “Debt / LTM EBITDA.” However, it is also viewed through each layer of the capital structure. And each layer’s leverage is the cumulative sum of all debt senior to it plus the layer being evaluated.
9/20
9/20
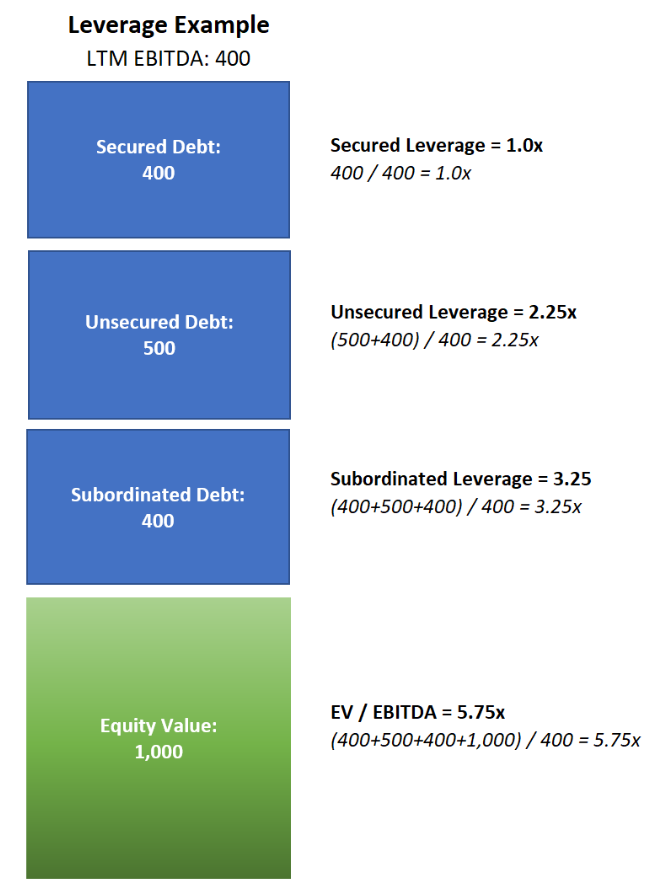
This causes different yields and trading prices within one capital structure.
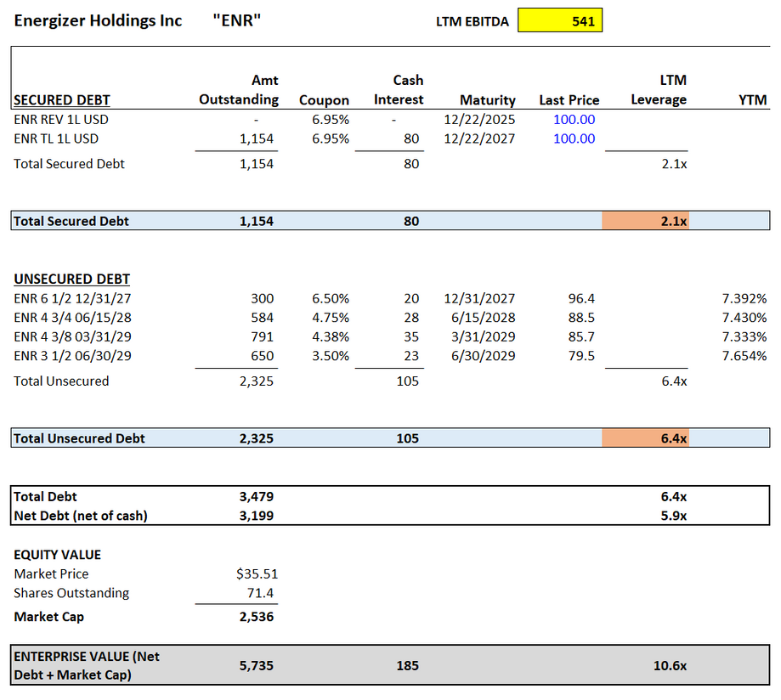
In the example below, we show how ENR has low leverage of 2.1x through 1st lien, but higher leverage through the Unsec. at 6.4x.
6.4x = (1,154 1st Lien + 2,325 Unsecured) / 541 LTM EBITDA
10/20
In the example below, we show how ENR has low leverage of 2.1x through 1st lien, but higher leverage through the Unsec. at 6.4x.
6.4x = (1,154 1st Lien + 2,325 Unsecured) / 541 LTM EBITDA
10/20
We will return to leverage, but first some notes on covenants. Covenants are highly technical, confusing and written by experienced lawyers. Covenants dictate what a company can/can’t do with leverage, allocation of cash flow and corporate actions (mergers or asset sales).
11/20
11/20
Covenants are found in lengthy documents governing each piece of debt. For a bond, this is an “Indenture” and for loans a “Credit Agreement.” As a lender, you want restrictions on a company’s ability to worsen your seniority or dilute your claim on assets & cash flow.
12/20
12/20

Covenants can be split into “Affirmative” (what a company must do) and “Negative” (what a company can’t do). Additionally, financial covenants are broken down into “Maintenance” (must stay within) and “Incurrence” (can’t go beyond post corporate action).
13/20
13/20

Covenants are negotiated prior to debt issuance, but after the fact, everything is open to legal arguments & lawsuits. This is why you see debt investors fight with each other and the company over what they can/cannot do within the capital structure post debt issuance.
14/20
14/20
Conditions in the credit market also dictate generally tighter or looser covenants. In a frothy market, companies can get away with more flexibility in their credit documents. Further, the stronger a company’s credit rating, the looser covenants tend to be (on average).
15/20
15/20
A “Cov-lite” loan generally refers to the absence of maintenance covenants. This became a regular feature of most broadly syndicated loans post-crisis, consistent with generally weaker credit protection as investors reached for yield.
16/20
16/20
Circling back to ENR, lets walk through a “layering” scenario…
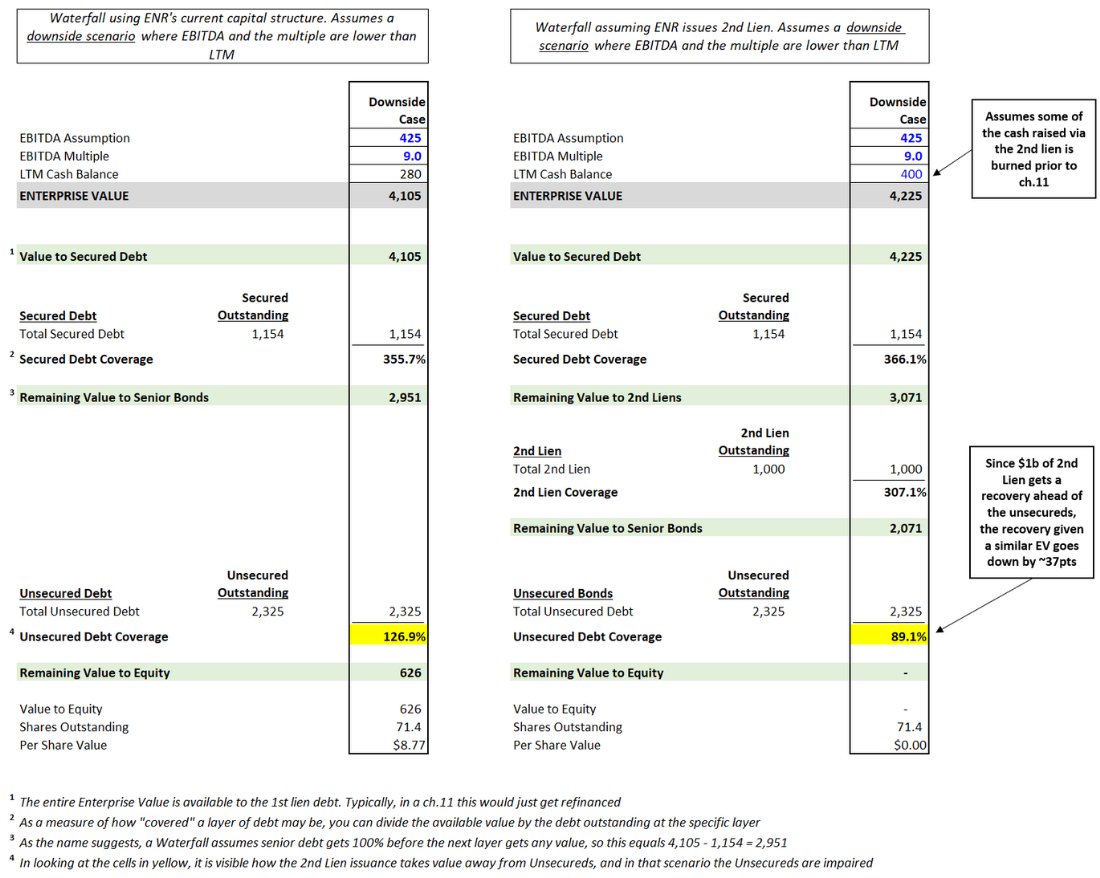
Assuming it is allowed by the covenants, we show what happens when they add 2nd lien debt. Unsecured bonds likely trade down on a situation like this b/c leverage at the unsecured level increases by ~2 turns.
17/20
Assuming it is allowed by the covenants, we show what happens when they add 2nd lien debt. Unsecured bonds likely trade down on a situation like this b/c leverage at the unsecured level increases by ~2 turns.
17/20

This is neutral for equity b/c debt increases, but so does cash, so EV is unch’d. Although, interest goes up and EPS would go down.
But, this is a negative credit event for Unsecureds b/c they get “layered”, i.e. more senior debt was layered in ahead of them.
18/20
But, this is a negative credit event for Unsecureds b/c they get “layered”, i.e. more senior debt was layered in ahead of them.
18/20
To further illustrate why this situation is negative for the unsecured bonds, we show what a recovery waterfall could look like if the business deteriorates and they have to restructure.
19/20
19/20
Leverage, recovery values via the “waterfall,” and covenant strength all matter when evaluating corporate credit. Hopefully this primer is a helpful starting point for those trying to understand and evaluate the asset class.
20/20
20/20
• • •
Missing some Tweet in this thread? You can try to
force a refresh


