🚧 CAUTION 🚧
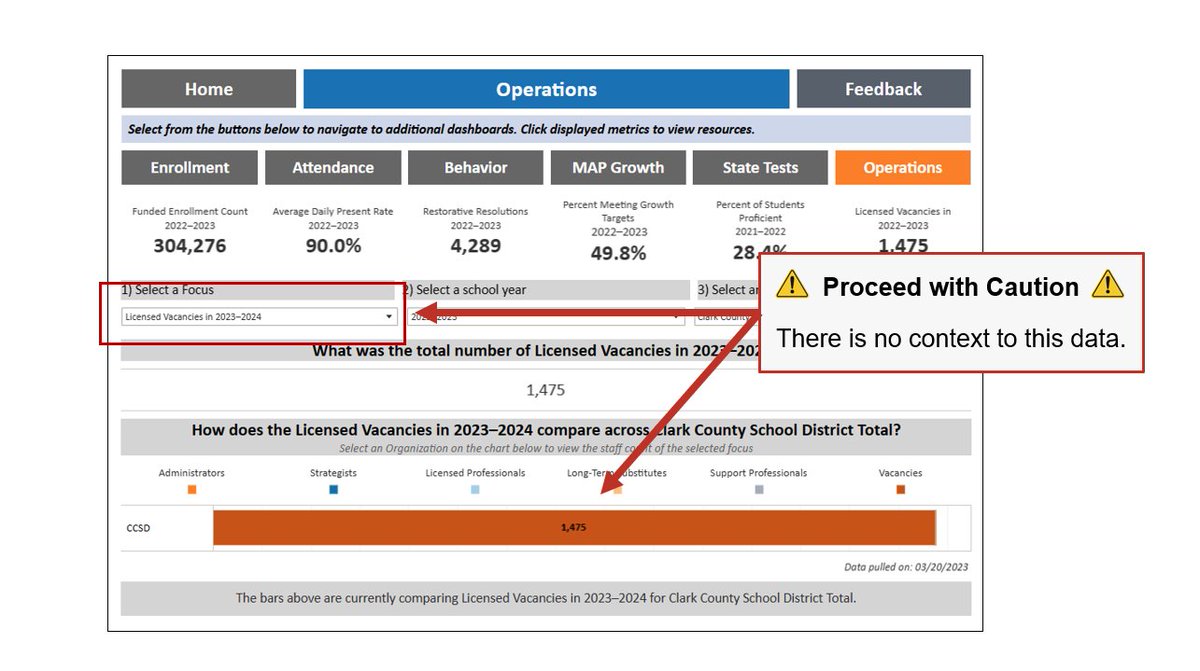
CCSD released its new transparency dashboards yesterday.
We applaud transparency, but it must be meaningful, not just numbers on a website.
Proceed with CAUTION, the data does not come with any context.
Let’s bring some context to the data. A thread 🧵
1/?
#NVed
CCSD released its new transparency dashboards yesterday.
We applaud transparency, but it must be meaningful, not just numbers on a website.
Proceed with CAUTION, the data does not come with any context.
Let’s bring some context to the data. A thread 🧵
1/?
#NVed

2/?
First, let's look at staffing, the MOST IMPORTANT issue in #NVed
The dashboard has staffing counts. That's nice.
You just can’t compare it to anything.
Not even another school year.
Let’s bring some context to this data…
First, let's look at staffing, the MOST IMPORTANT issue in #NVed
The dashboard has staffing counts. That's nice.
You just can’t compare it to anything.
Not even another school year.
Let’s bring some context to this data…

3/?
CCSD has been hemorrhaging teachers.
All the staffing gains that were made after the Great Recession have been wiped out!
CCSD has been hemorrhaging teachers.
All the staffing gains that were made after the Great Recession have been wiped out!

4/?
The bleeding has not stopped.
The number of teacher/licensed staff separation announcements since August is the most ever, except for last year’s record-breaking teacher exodus.
Almost 100 more than the next highest year and over 200 more than a typical year.
The bleeding has not stopped.
The number of teacher/licensed staff separation announcements since August is the most ever, except for last year’s record-breaking teacher exodus.
Almost 100 more than the next highest year and over 200 more than a typical year.

5/?
It’s not just teachers.
The last four years have seen the largest exodus in principals and other administrators in CCSD.
But you won’t see that in their transparency dashboard.
It’s not just teachers.
The last four years have seen the largest exodus in principals and other administrators in CCSD.
But you won’t see that in their transparency dashboard.

6/?
Here’s some more important context:
While CCSD has been bleeding teachers, last year there were more teachers in the rest of the US than at any point in the last decade.
You read that correctly but go ahead and read it again.
Here’s some more important context:
While CCSD has been bleeding teachers, last year there were more teachers in the rest of the US than at any point in the last decade.
You read that correctly but go ahead and read it again.

7/?
Data alone is not helpful without context to give it meaning
CCSD must know this, don’t they???
What is the optimal staffing level?
What’s the retention & attrition?
How does this compare to historical staffing?
That's just some of what's missing.
Let’s review some more…
Data alone is not helpful without context to give it meaning
CCSD must know this, don’t they???
What is the optimal staffing level?
What’s the retention & attrition?
How does this compare to historical staffing?
That's just some of what's missing.
Let’s review some more…

8/?
Next up, advanced math coursework
Last year 26% of 8th graders were enrolled in advanced math coursework.
But you don’t have any context of their actual performance.
Let’s add some context…
Next up, advanced math coursework
Last year 26% of 8th graders were enrolled in advanced math coursework.
But you don’t have any context of their actual performance.
Let’s add some context…

9/?
CCSD had the highest enrollment in middle school advanced math coursework in years
CONTEXT:
Math proficiency rates have been going DOWN
In 2018, 30% of 8th graders were proficient in Math
In 2022, less than 20% were proficient
Despite higher advanced math course enrollment
CCSD had the highest enrollment in middle school advanced math coursework in years
CONTEXT:
Math proficiency rates have been going DOWN
In 2018, 30% of 8th graders were proficient in Math
In 2022, less than 20% were proficient
Despite higher advanced math course enrollment

10/?
Now an even higher rate of 8th graders are in advanced math courses (26.9%)
Yet only 11.9% of 8th graders are projected to be proficient based on the latest benchmark assessments
This is what happens when district leadership drives out thousands of experienced teachers!
Now an even higher rate of 8th graders are in advanced math courses (26.9%)
Yet only 11.9% of 8th graders are projected to be proficient based on the latest benchmark assessments
This is what happens when district leadership drives out thousands of experienced teachers!

11/?
Wow!
Over 64,000 students in high school advanced coursework.
But you don’t get any information about their actual performance.
Let’s look at some performance data…
Wow!
Over 64,000 students in high school advanced coursework.
But you don’t get any information about their actual performance.
Let’s look at some performance data…

12/?
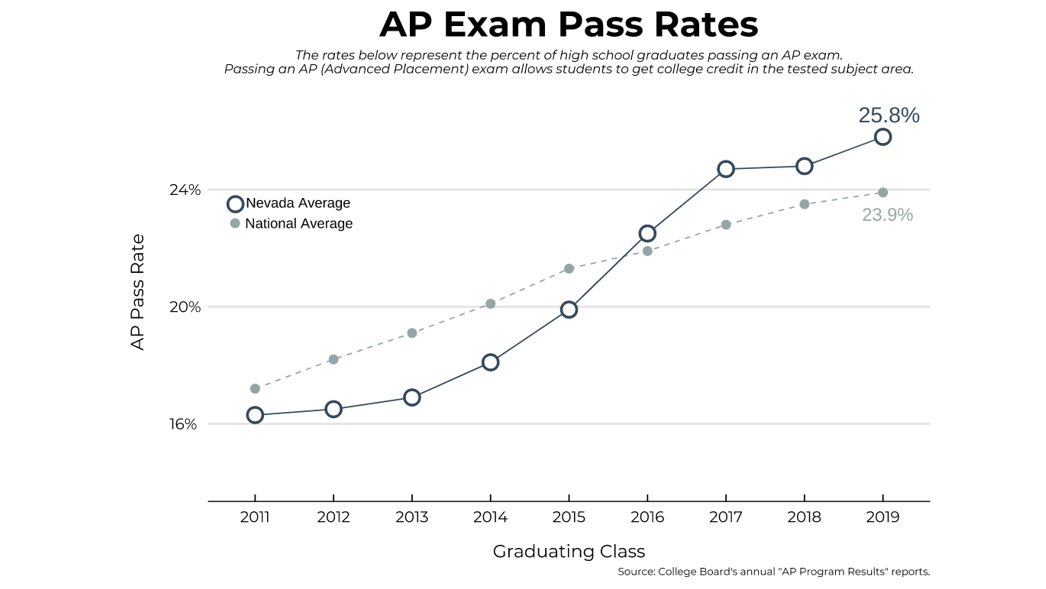
Nevada once trailed the national average in % of graduates passing an AP exam.
In 2017, CCSD was named the AP District of the Year, and led Nevada to exceed the national average in grads passing an AP exam.
What has happened since then…
Nevada once trailed the national average in % of graduates passing an AP exam.
In 2017, CCSD was named the AP District of the Year, and led Nevada to exceed the national average in grads passing an AP exam.
What has happened since then…

13/?
Graduates passing AP exams have plummeted & are significantly below the national avg
Jara’s Focus 2024:
“CCSD is committed to providing more classes that align to students’ goals & interests and will work diligently to increase participation in Advanced Placement…” 🤷♂️
Graduates passing AP exams have plummeted & are significantly below the national avg
Jara’s Focus 2024:
“CCSD is committed to providing more classes that align to students’ goals & interests and will work diligently to increase participation in Advanced Placement…” 🤷♂️

14/?
Even the enrollment data doesn’t tell the whole story without some context.
Let’s look at the context…
Even the enrollment data doesn’t tell the whole story without some context.
Let’s look at the context…

15/?
Not only have thousands of experienced teachers and administrators left CCSD,
Tens of thousands of parents have been pulling their children out of CCSD.
But that’s not true everywhere…
Not only have thousands of experienced teachers and administrators left CCSD,
Tens of thousands of parents have been pulling their children out of CCSD.
But that’s not true everywhere…

16/?
While enrollment in CCSD has dropped by over 10,000 students over the last 10 years (Over 20,000 from peak enrollment),
Enrollment in the rest of Nevada continues to rise.
While enrollment in CCSD has dropped by over 10,000 students over the last 10 years (Over 20,000 from peak enrollment),
Enrollment in the rest of Nevada continues to rise.

17/?
Here is a single cohort of students moving from 1st grade in 2015-2016 to 8th grade this year.
CCSD has lost over 2,000 kids from that single cohort.
The kids were there and now they are gone.
The rest of the state has gained over 3,600 students!
Here is a single cohort of students moving from 1st grade in 2015-2016 to 8th grade this year.
CCSD has lost over 2,000 kids from that single cohort.
The kids were there and now they are gone.
The rest of the state has gained over 3,600 students!

18/?
Despite CCSD’s plummeting student enrollment, Clark County’s population of school-aged children continues to rise.
Don’t bother to look for any of this context in the transparency dashboards; you won’t find it.
Despite CCSD’s plummeting student enrollment, Clark County’s population of school-aged children continues to rise.
Don’t bother to look for any of this context in the transparency dashboards; you won’t find it.

19/?
Wow! We can see how many teaching/licensed positions CCSD needs for next year.
We just can’t see how many they need right now, or at any point in the past to give this number any context at all.
Let’s bring some context to this data…
Wow! We can see how many teaching/licensed positions CCSD needs for next year.
We just can’t see how many they need right now, or at any point in the past to give this number any context at all.
Let’s bring some context to this data…

20/?
CCSD started this school year with the MOST teacher vacancies it’s EVER started with
At no point during this year did the number of vacancies drop below 1,000
Today it is at 1,501
A year ago, it was at 1,462
It’s NOT getting better
CCSD started this school year with the MOST teacher vacancies it’s EVER started with
At no point during this year did the number of vacancies drop below 1,000
Today it is at 1,501
A year ago, it was at 1,462
It’s NOT getting better

21/21
The dashboards are the latest in administrative theatrics that will have no impact on improving education
No matter the intentions of District leadership,
the outcomes are consistently ineffective
Our children don’t need good intentions, they need effective leadership!
The dashboards are the latest in administrative theatrics that will have no impact on improving education
No matter the intentions of District leadership,
the outcomes are consistently ineffective
Our children don’t need good intentions, they need effective leadership!

• • •
Missing some Tweet in this thread? You can try to
force a refresh


