Erika Morris Profile picture
Mar 27, 2023 22 tweets 12 min read Read on X
After such a long wait the #WPL2023final didn’t fail to deliver, overall the tournament has been a great success and certainly captured new fans. Mumbai Indians took the trophy but were they statistically the best team? Lets talk a look..
First up is the teams batting averages and this graph shows the tournament average and the difference to the team’s average pre-tournament. No surprise MI batters actually managed to outperform their career averages by 15.16, GG disappointed in #WPL2023 at 1.27 below their avg Image
T20 is all about strike rate so which team took this accolade? It is actually the big hitting runs up DP who stuck at 116 across #WPL2023 , increasing their pre-tournament rate by a huge 16! WPL was a batters dream as all teams increased their pre tournament strike rates Image
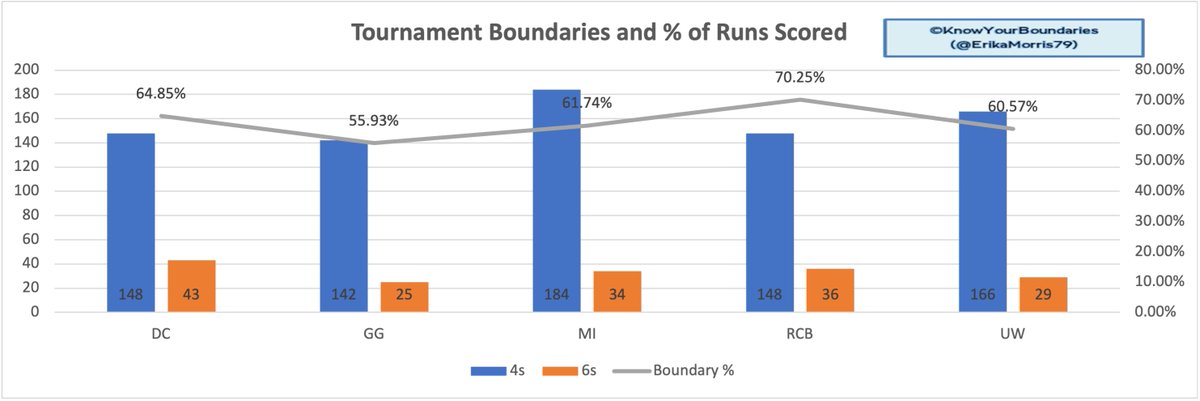
Who were the intent merchants of #WPL2023 by clearing the ropes the most times? Shockingly RCB take this with 70% of their runs scored coming from boundaries courtesy of the big hitting Devine and Kasat. GG prop the table up at just 55%, they may need to rethink for 2024 Image
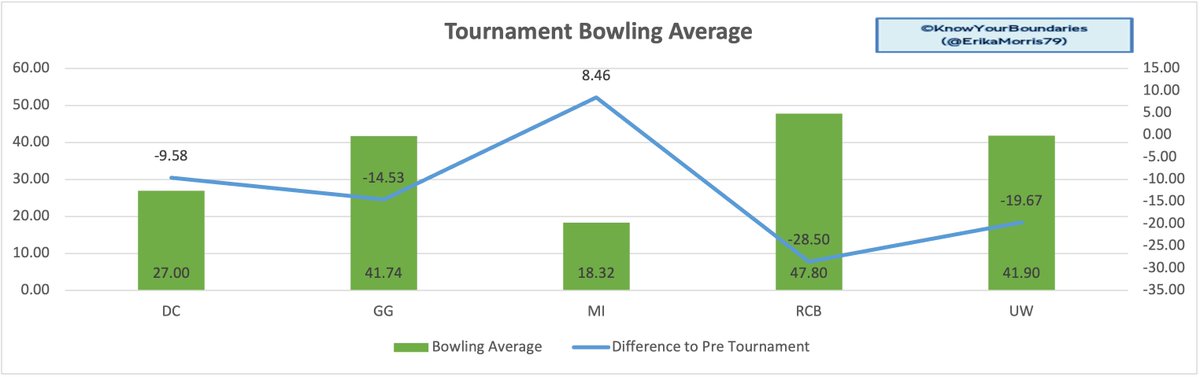
We all know that bowlers are players who win you tournaments and MI have proven this yet again with their dominant bowling in #WPL2023. They top the bowling average table at just 18.32 and are the only team to improve their overall average in the tournament. Image
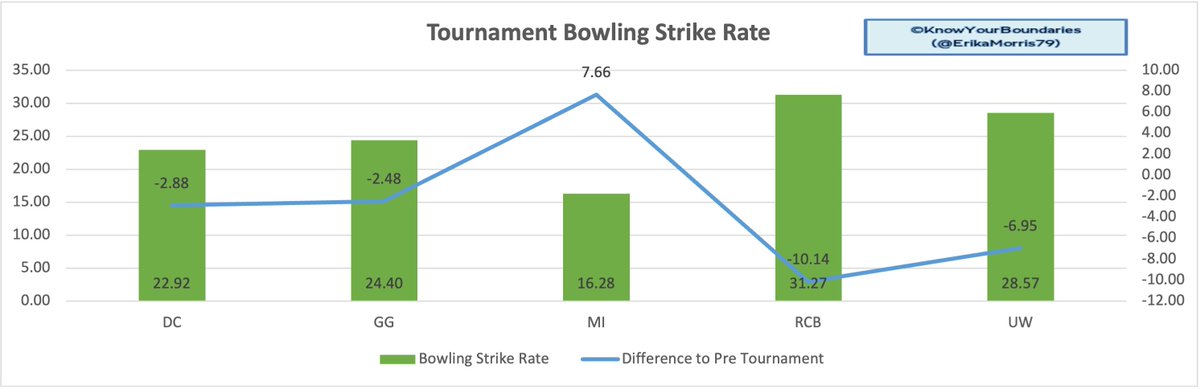
Average is one angle to review but which team took wickets more frequently? Yet again this accolade goes to MI with their bowlers taking a wicket every 16 balls. Despite getting to the eliminator UW are only the 4th best bowling team, too much reliance on Ecclestone maybe? Image
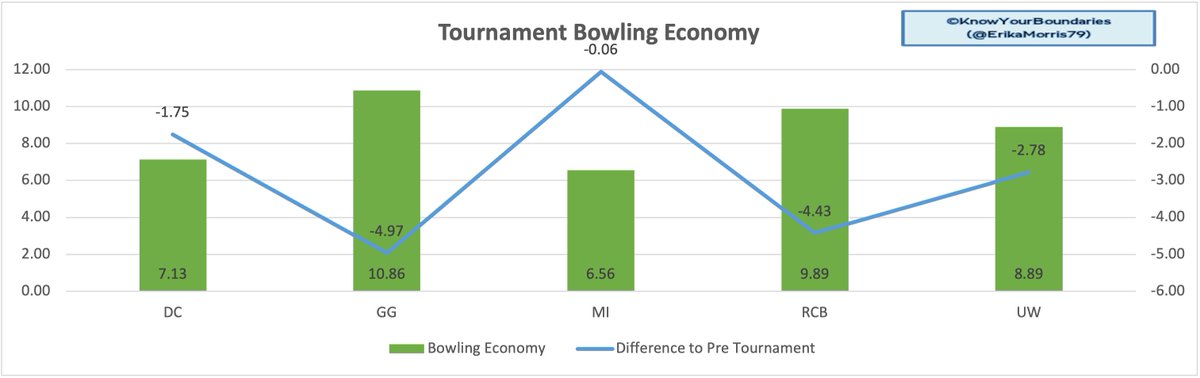
What about the best #WPL2023 bowling economy? It’s the feared attack of Wong, Matthews, Sciver-Brunt and Isaqhue who yet again take this accolade with miserly economy of just 6.56. On the other hand GG were the most expensive at 10.86, they have to address this weakness Image
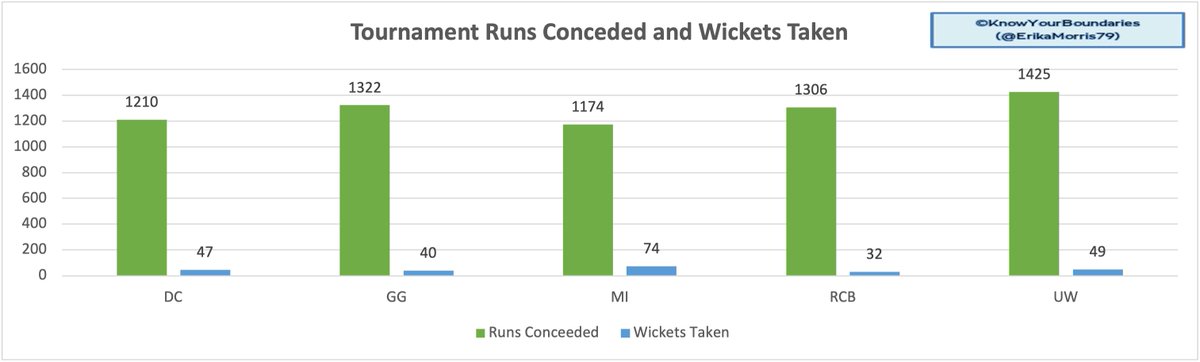
Averages and econ are one thing but its bowling the opposition out for less that wins you a T20 game. MI conceded the least runs at just 1174 and of course took the most wickets with 74 in total. RCB took the fewest wickets at 32 and UW conceded the most runs in #WPL2023 Image
So who is statistically the best performing team in #WPL2023? Well this heat map ranks teams in 3 batting & 5 bowling aspects and drum roll.. its our winners MI who are statistically the best team with runners up DC in second place. GG foot the table and may want to rethink Image
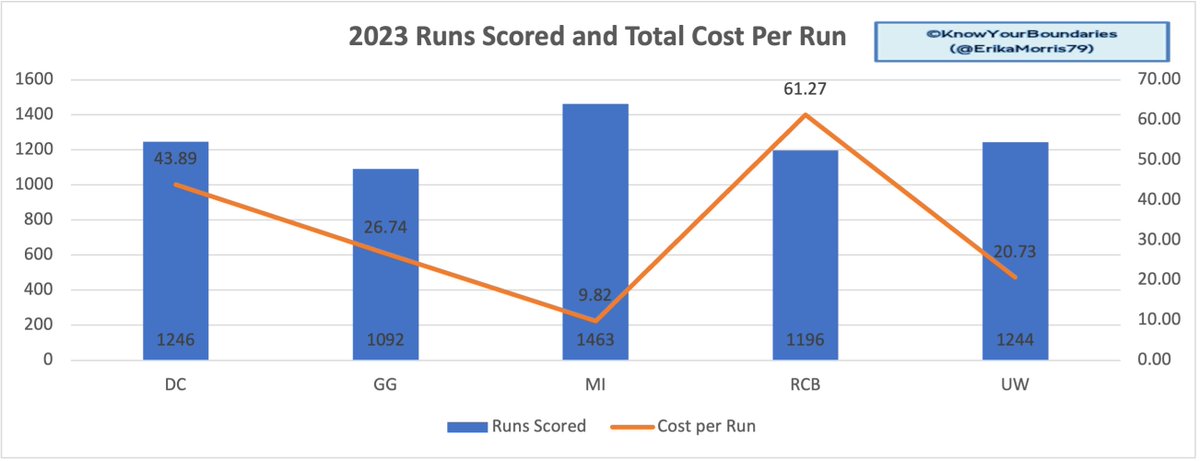
How did #WPL2023 teams auction strategy translate into performance? This chart shows the total number of runs each team scored and the average cost per run based on their auction spend. We can see that MI really got value for their money whereas RCB may look to rebuild in 2024 Image
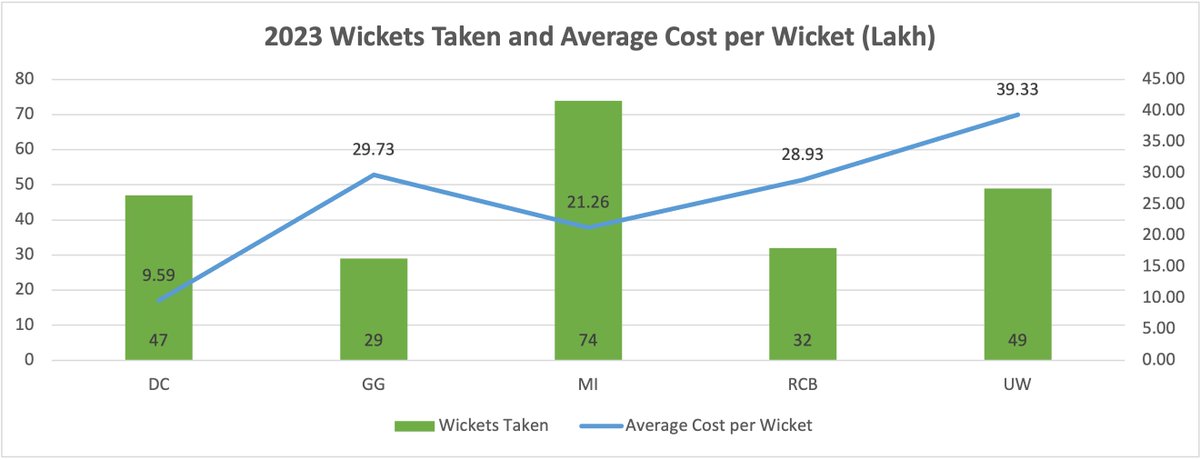
We already saw earlier that winners MI took the most wickets across #WPL2023 but which team ended up with the lowest cost per wicker? It was actually DC way out ahead at just 9.59Lakh per wicket, MI are some way behind in second at 21.26. UW however spent 39.33 per wicket! Image
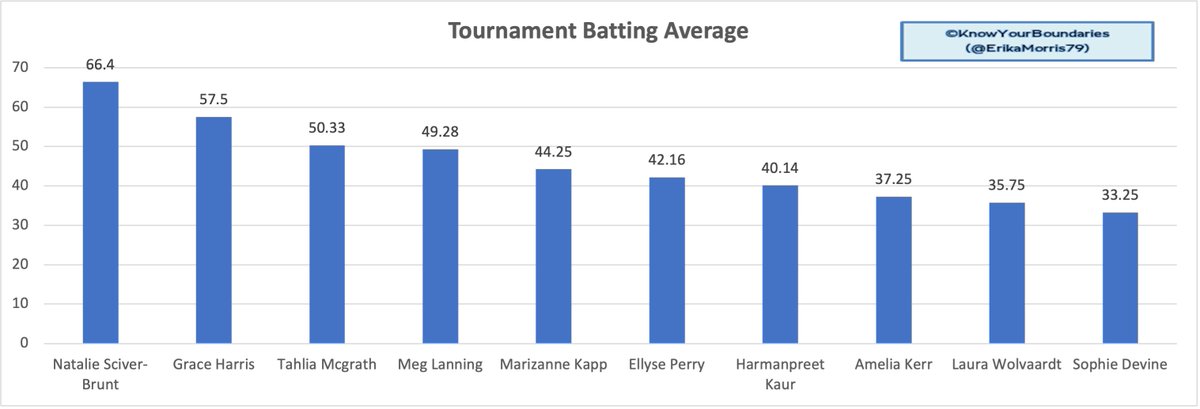
Let’s take a look at some individuals who have shone in #WPL2023 . Looking at batting average (and taking out one game players) and it’s MI’ Nat Sciver-Brunt who just sneaks the top spot at 66.4 with big hitting Harris behind at 57.5 Harmanpreet is the only Indian in the top 10 Image
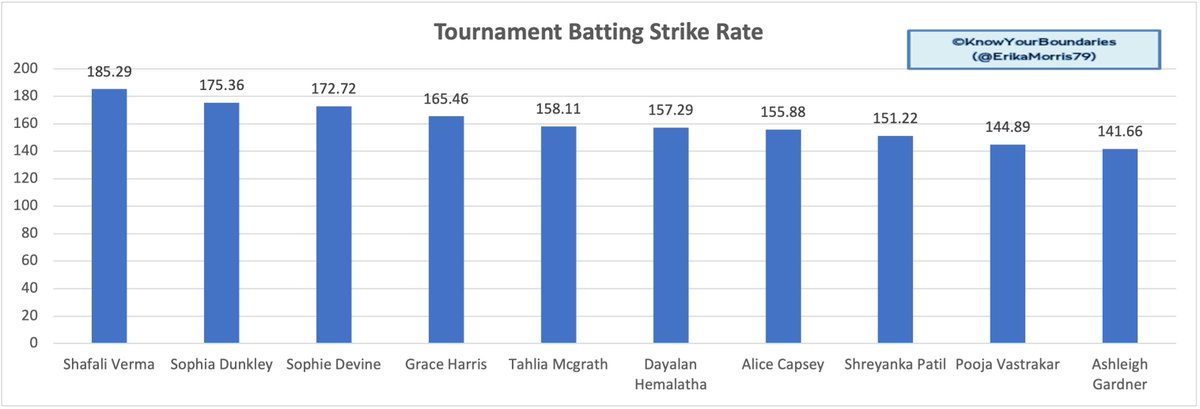
Who are the big hitters of #WPL2023? No surprise here but it is the big hitter Shefali Verma who takes this title with a Strike rate of 185.29, ahead of Dunkley at 175. This time there are 4 Indians in Verma, Hemalatha, Patil and Vastrakar in the top 10, the future looks bright! Image
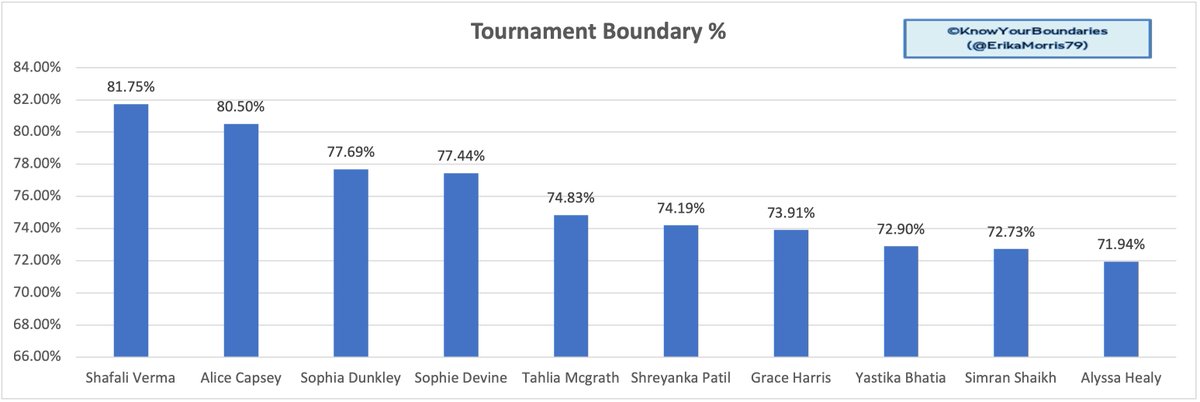
It will be of no surprise that it is the teenage power hitter Verma is also the leading player in terms of boundary % with 81.75% of her runs scored coming from boundaries, closely followed by Capsey at 80%. Dunkley, Devine and McGrath conclude the top 5 Image
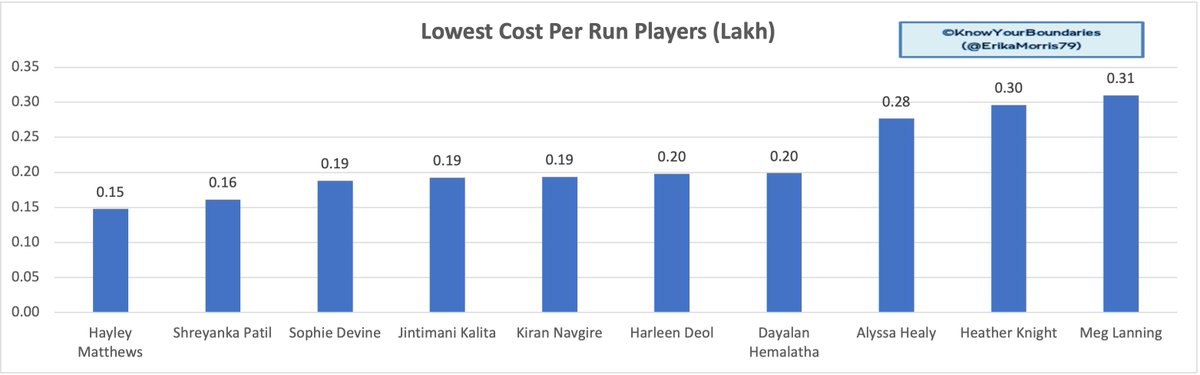
Which of our #WPL2023 batters were the best value based on the cost per run dimension? This time is the buy and player of the season Hayley Matthews at just 0.15 Lakh per run, how MI got her at just 40Lakh I will never know! Surprisingly there are 3 RCB players in the top 10 Image
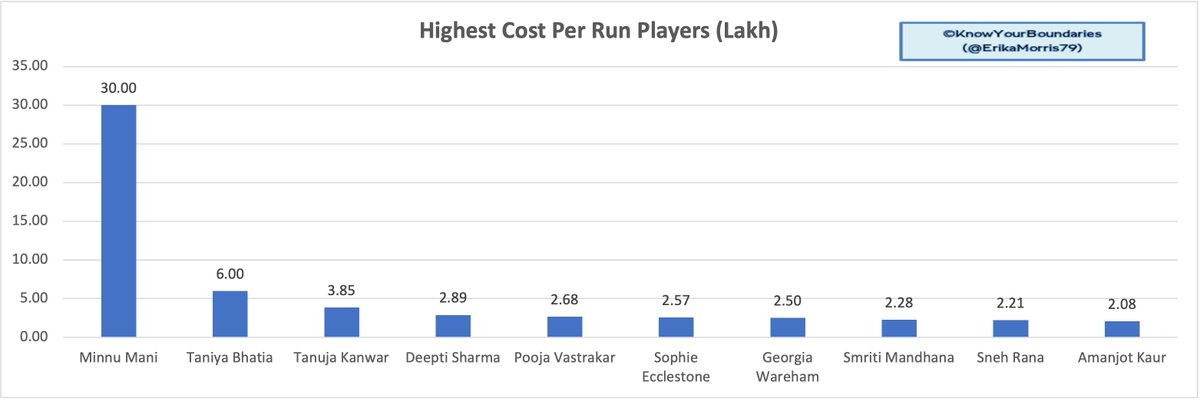
And on the flip side who didn’t quite live up to their price tag and teams might be looking for a refund? Way out ahead here is Minnu Mani with just 1 run in 2 innings making her cost per run a huge 30Lakh. I am sure she will be looking to improve on this next year Image
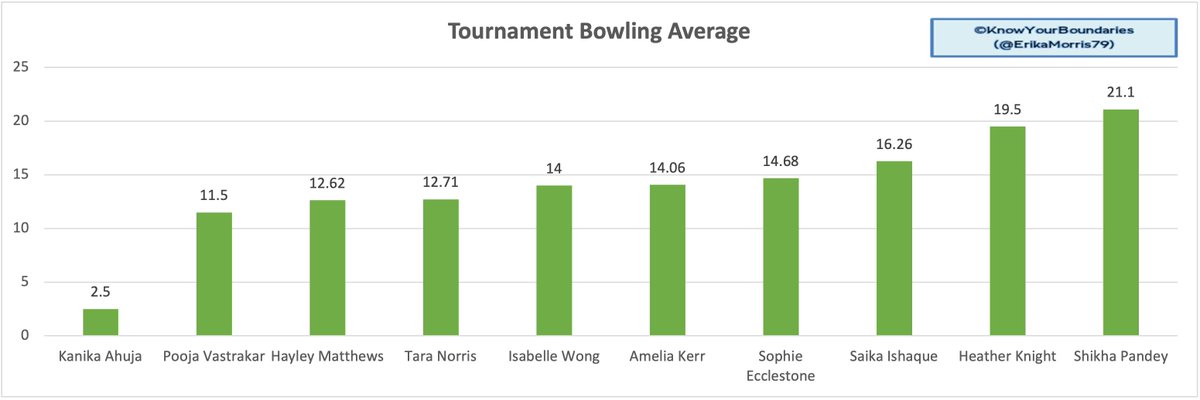
Taking a step back to the bowlers for a few minutes and who concedes the least runs between the wickets they take? This goes to young RCB spinner Ahuja at just 2.5 runs per wicket, #WPL2023 leading wicker take Matthews is in third at 12.62 Image
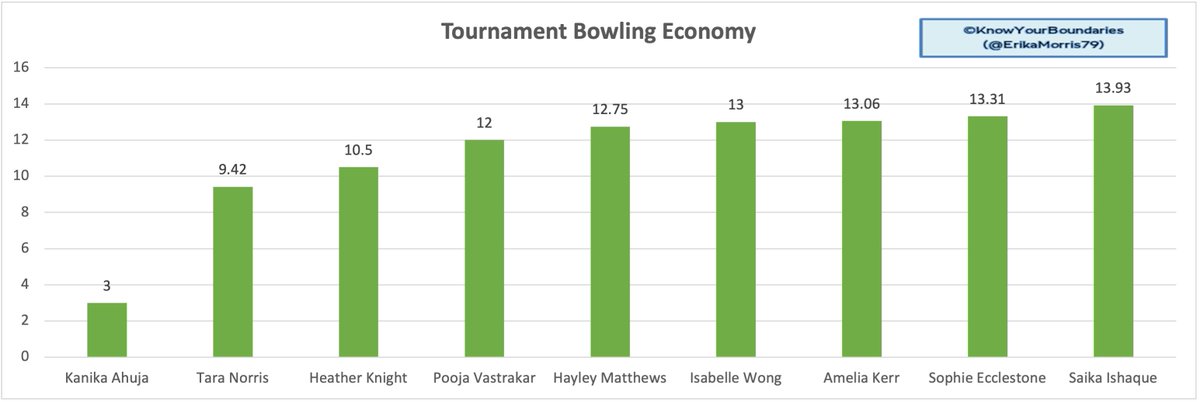
Who was the bowler in #WPL2023 who gave away the least runs? Yet again this goes to Ahuja at just runs per over. DC’s associate player Norris comes in second at just 9.42, should she have played more games? No surprise that MI players dominate this list with 5 in the top 10 Image
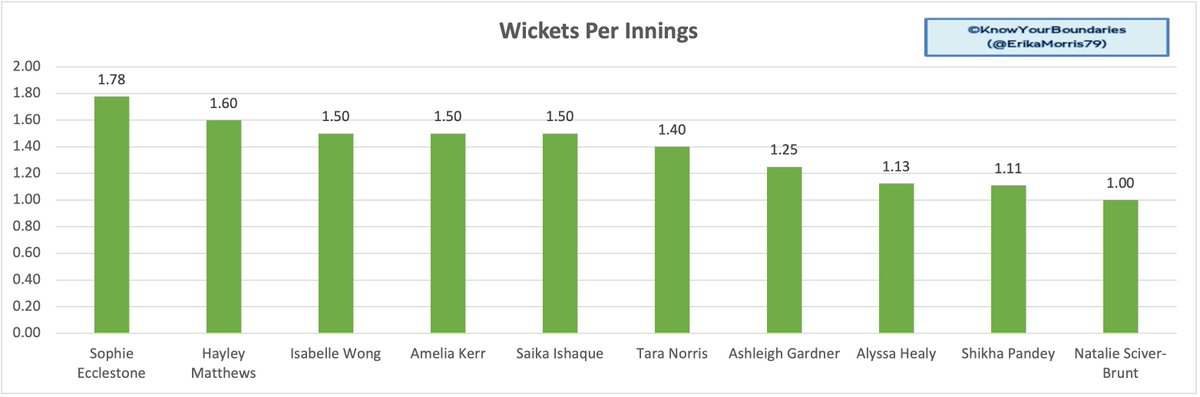
Our next graph looks at the average wickets per innings. UPWarriorz Ecclestone takes this at 1.78 wickets per innings, she really did prop up their bowling. The next 4 places are dominated by MI players in Matthews, the impressive & consistent Wong, Kerr and breakout star Ishaque Image
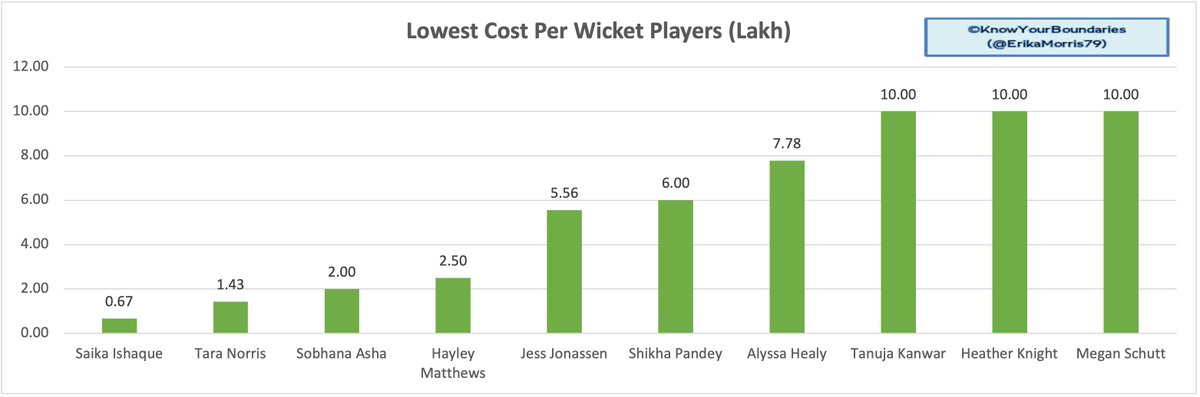
Which of our #WPL2023 bowlers has proven the best value for money for their teams? No surprise it is the young star from MI Saika Ishaque at just 0.67 Lakh per wicket. Norris is again in second at 1.43 and yet again another RCB player in Sobhana Asha in third. Image
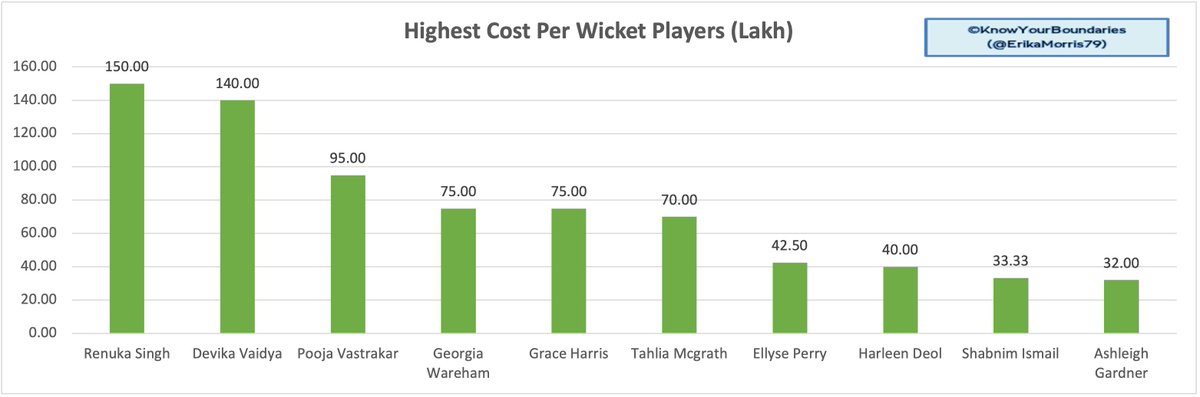
On the flip side who hasn’t quite lived up to their value? I don’t think anyone would have expected Renuka Singh to be top of this list at 150Lakh per wicket with Vaidya and Vastrakar in second and third. Franchises may expect more from their big name signings next year Image
Thank you for taking the time to read the quick walkthrough of the key stats from the inaugural #WPL2023, I think it’s safe to say it was a success and I for one am already looking forward to season 2. Now it is the mens turn in #IPL2023

• • •

Missing some Tweet in this thread? You can try to force a refresh
 

Keep Current with Erika Morris

Erika Morris Profile picture

Stay in touch and get notified when new unrolls are available from this author!

Read all threads

This Thread may be Removed Anytime!

PDF

Twitter may remove this content at anytime! Save it as PDF for later use!

Try unrolling a thread yourself!

how to unroll video
  1. Follow @ThreadReaderApp to mention us!

  2. From a Twitter thread mention us with a keyword "unroll"
@threadreaderapp unroll

Practice here first or read more on our help page!

More from @ErikaMorris79

May 27
After a somewhat one sided #IPLFinal that saw KKR become 3 time champions, but were they statistically the best team? Lets talk a look at what has been a superb #IPL2024 where records have been broken time and time again
First up is the teams batting averages. This graph shows the tournament average and the difference to the team’s avg pre-tournament. KKR top this with an average 6.78 higher than their career, infact only GT, MI and RCB were lower #IPLfinal Image
T20 is all about strike rate so which team took this accolade? #IPL2024 was an absolute batters dream as every team other than GT increased their strike rate, with eventual winners KKR adding over 27 to their pre tournament average Image
Read 49 tweets
Mar 17
With the excitement for the #IPL2024 building I’ve been looking into the data and seeing what insights it tells us. If you don’t like IPL & data I suggest you look away now  for those that do buckle up as it’s a long ride.
Firstly a few of the parameters I used #WPL2024
For all players their career T20 figures were used, those who haven’t played aren’t displayed
Team battings averages - the figures for batters, wicket keepers and all-rounders have been used
Teams bowling averages - the figures for bowlers and all-rounders have been used #IPL2024
Let’s start with looking at the makeup of each franchise. There seems to be a growing focus on all-rounder’s, 43.48% of the PBKS squad are ALR. RR however have 42% of their squad as bowlers, are they going with the ‘batters win you games, bowlers win you tournaments’ approach? Image
Read 41 tweets
Dec 11, 2023
With the #BCCI finally releasing the #iplauction2024 list I’ve done a little analysis to see what trends the data is showing us. The first part of this thread is auction data analysis and the 2nd part my view of what each time should be targeting for #IPL2024 . Buckle up..
Firstly let’s see what each of the 10 franchises look like going into the #iplauction2024 . KKR are almost having to build a brand new team with just 13 players and 12 slots left to fill. On the other end of the scale SRH, RCB, CSK and LSG have just 6 and may play tactically. Image
What about the much converted overseas slots? With a total of 119 overseas players registered there are only 30 slots available across the teams, DC, KKR and MI have 4 each with GT, LSG and PBKS needing just 2 overseas to complement their team #iplauction2024 Image
Read 31 tweets
Oct 1, 2023
With the excitement for the #CWC2023 building I’ve been looking into the data and seeing what insights it tells us. If you don’t like T20 & data look away now as it’s a long ride. Firstly detail of a few of the data parameters I used to do this.
For all players their career ODI figures were used, those who haven’t played aren’t displayed
Team battings averages - the figures for batters, wicket keepers and all-rounders have been used
Teams bowling averages - the figures for bowlers and all-rounders have been used
Let’s start with looking at the team makeup. Everyone loves all-rounders, 40% of the AUS, NED and NZ squad are ALR. On the flip side 40% of the SL squad are bowlers, are they going with the ‘batters win you games, bowlers win you tournaments’ approach? #CWC2023 Image
Read 35 tweets
Jul 30, 2023
With the start of #thehundred just around the corner I’ve taken my usual look through the data and what it’s telling us. This thread is for the Womes comp, my thread for the mens can be found in the last tweet.
Firstly detail of a few of the data parameters I used to do this
For all players their career T20 figures were used, those who haven’t played aren’t displayed
Team battings averages - the figures for batters, wicket keepers and all-rounders have been used
Teams bowling averages - the figures for bowlers and all-rounders have been used
Let’s start with looking at the makeup of each team. There is a growing focus on all-rounders, 40% of the Rockets and Invincible are ALR! Fire have 60% of their squad as bowlers, are they going with the ‘batters win you games, bowlers win you tournaments’ approach? Image
Read 36 tweets
May 14, 2023
With the latest season of the #Blast23 starting soon I’ve been looking into the data and seeing what insights it tells us. If you don’t like T20 & data look away now as it’s a long ride. Firstly detail of a few of the data parameters I used to do this.
For all players their career T20 figures were used, those who haven’t played aren’t displayed
Team battings averages - the figures for batters, wicket keepers and all-rounders have been used
Teams bowling averages - the figures for bowlers and all-rounders have been used #Blast23
One other important factor to call out is the stats are based on the whole squad, including those named as partial replacements for players who will go off on international duty. Hence there will be teams who have more players than others. #Blast23
Read 57 tweets

Did Thread Reader help you today?

Support us! We are indie developers!


This site is made by just two indie developers on a laptop doing marketing, support and development! Read more about the story.

Become a Premium Member ($3/month or $30/year) and get exclusive features!

Become Premium

Don't want to be a Premium member but still want to support us?

Make a small donation by buying us coffee ($5) or help with server cost ($10)

Donate via Paypal

Or Donate anonymously using crypto!

Ethereum

0xfe58350B80634f60Fa6Dc149a72b4DFbc17D341E copy

Bitcoin

3ATGMxNzCUFzxpMCHL5sWSt4DVtS8UqXpi copy

Thank you for your support!

Follow Us!

:(