The last three years have presented significant changes to operation of transit systems. Significant shifts in demand patterns. In some areas, busier buses than ever before. Budget pressures.
A deep dive into @MiWayHelps, #Mississauga's transit system. #misspoli #transit
A deep dive into @MiWayHelps, #Mississauga's transit system. #misspoli #transit
In this first of two threads, we will take a overall look at MiWay comparing 2022 demand vs 2019, current service levels, how demand patterns shifted and the importance of informed budget and policy decisions. In a second thread, we will look deeper at individual MiWay routes.
The analysis is based on Automated Passenger Counter (APC) data obtained from MiWay. In the several times I have requested this data staff have always provided the data requested (and sometimes more) in a useable way at a reasonable cost which is appreciated.
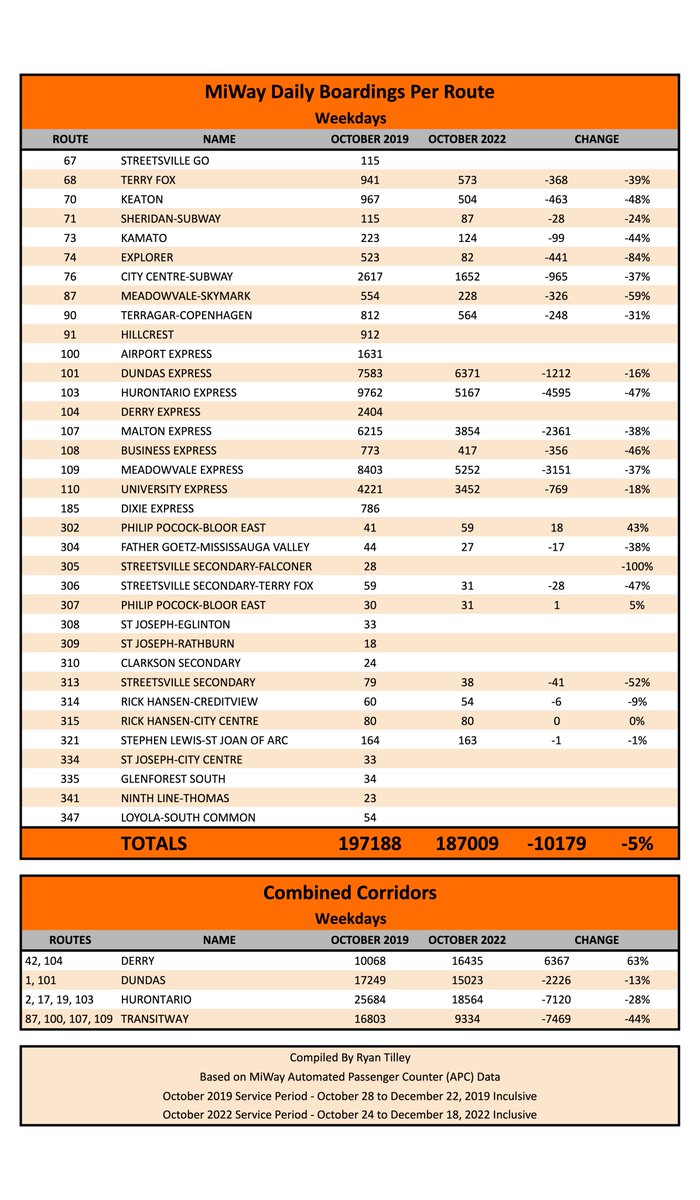
The Oct 2022 service period was compared to the Oct 2019 service period. The Oct service period runs 8 weeks from the last week of Oct to just before the Dec holidays and was chosen since Nov and Dec 2022 ridership met or exceeded that of 2019, providing a good basis to compare.
Starting off with a overview of some key metrics comparing the October 2022 service period to that of October 2019. One important note to highlight is we discuss boardings, which are unlinked trips and not linear to revenue rides - one ride with a transfer is 2 boardings. 

Looking at total system boardings for the October 2022 service period, weekdays were 5% below 2019, while weekends far exceeded 2019 levels, with Saturday boardings increasing 15% and Sundays 18% over 2019 levels. Weekdays almost there, but a far busier system on weekends.
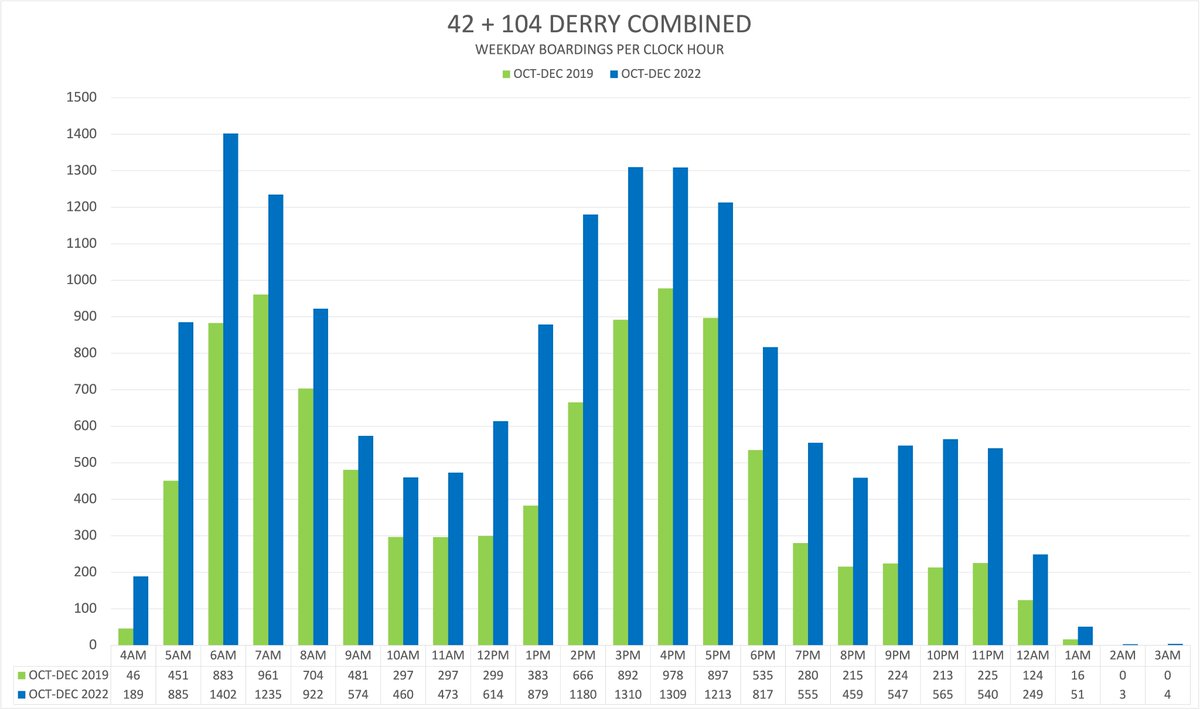
Viewing boardings by clock hour reveals some of the shifting demand patterns, especially on weekdays. Boardings during AM and PM rush hours are still below 2019 levels with the biggest drop in the 7AM and 8AM hours, while early AM and evening boardings exceeding 2019 levels.

However on Saturdays and Sundays, where boardings have far exceeded 2019 levels, demand is higher across the entire service day however early morning and evening show the greatest relative increases in demand.


Demand has also changed by location with some areas being very busy and others not so much. A look at top stops with changes in weekday total activity (boardings + alightings combined). Green noting top 500 stops for activity increase, Red top 500 for activity decrease.

Looking at the stops in green, routes like Derry, Dixie, Tomken, Kennedy, McLaughlin, Mavis have much higher demand than in 2019. Specific areas seeing higher demand include Heartland, Malton, McLaughlin and Mavis in the south end of Brampton and Eglinton west of Erin Mills Pkwy.
On the other hand, stops in red show areas where demand decreased significantly - residential areas on the west side like Park Royal, Churchill Meadows, Meadowvale and Lisgar. Demand is also lower on Hurontario, Bloor, parts of Lakeshore and around the Airport Corporate Centre.
The shifting patterns mean for the past 2 years MiWay has re-allocated resources from routes with lower demand to routes experiencing higher demand. The elephant in the room is that after 2 years of doing it there's not a lot of places left to re-allocate from.
Despite all the reallocation, closed door reports (overcrowding) are up significantly, with 1985 closed door reports during the October 2022 service period compared to 1135 in 2019 (+75%). Closed doors mean full buses bypass stops and customers have to wait for the next one.
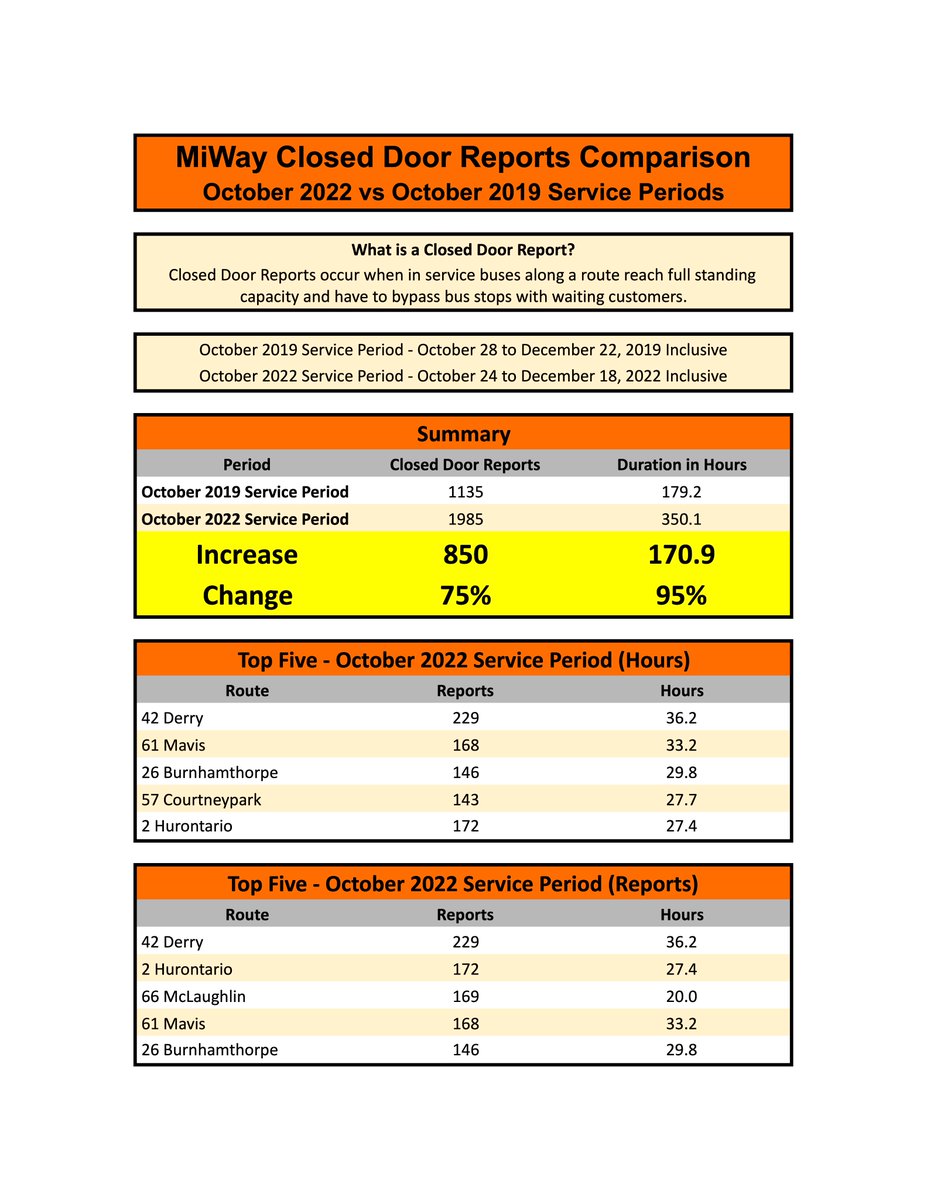
Even looking at most of January 2023 (month, not service period) and comparing to the same period in January 2020, closed door reports still showed a significant 84% increase from 403 to 741. A transit system that is clearly struggling to meet the demand on the street.

No scheduled service hour growth in '23 means managing overcrowding will be hard. There isn't much left to reallocate without having further detrimental impact on frequency or connectivity - "painful choices" as MiWay director Geoff Marinoff put it during his budget presentation.
On the subject of scheduled service hours, with no growth since 2019 surely MiWay is just operating at 2019 scheduled service hours and reallocating resources?
Absolutely not, MiWay is actually running far below 2019 levels no matter what way you slice it or look at it.
Absolutely not, MiWay is actually running far below 2019 levels no matter what way you slice it or look at it.
Compared to 2019, Oct 2022 service period weekday scheduled hours were 11% lower despite demand down only 5%, and Saturday hours were down 9% despite demand up by 15%. Sundays are the only day that hours were almost at 2019 levels, even though demand was up 18% compared to 2019.

These differences are after adjusting the 2019 'baseline' to include approved reductions for budget savings. Even factoring in service increases during the January and February 2023 service periods there's still less scheduled service provided no matter what way you slice it.
Operating less scheduled service than the comparable 2019 periods with service hour growth in 2023 is at odds with others that are adding service hours in 2023:
Brampton - 84,000
Hamilton - 49,000
Waterloo - 42,000
Mississauga - zero in 2023, a paltry 15,000 projected for 2024.
Brampton - 84,000
Hamilton - 49,000
Waterloo - 42,000
Mississauga - zero in 2023, a paltry 15,000 projected for 2024.
So how did MiWay get to a point where they're operating less service hours than the 2019 baseline despite demand nearing or exceeding 2019 levels? In the 2022 budget, MiWay staff projected the need for 30,000 added service hours in 2023 anticipating the demand growth.
When 2023 budget time came the request for additional hours was removed by staff, presumably to help contain budget increases at the request of council due to cost pressures. This is understandable as staff are bound by council direction on budget issues.
Despite staff warning about challenges, no councillor requested a report back on possibly adding service hours and costs, instead requesting and approving free child & expanded $1 senior fares that will cost $1.8M a year. How many service hours could have been added for $1.8M?
Council needs to be more cognizant of these budget and policy choices moving forward, and staff need to consider improving the level of information presented to council so they can make informed policy and budget choices, particularly when it comes to transit and service levels.
Would council have approved the 2023 budget as tabled had they known that MiWay is actually running below 2019 scheduled service hour levels? That despite this demand meets or exceeds 2019 levels especially on weekends? That closed doors have almost doubled vs 2019? Probably not.
With current trends and no service hour growth riders & operators will have to face more crowded buses and more service level cuts in some areas of the system. A key issue for the '24 budget is what investment is truly needed - the projected 15k hours will likely be insufficient.
List of stops with highest changes in weekday total stop activity (boardings + alightings)
drive.google.com/file/d/1ZI5rrw…
October-December 2022 closed door reports list
drive.google.com/file/d/1HS2IF1…
January 2023 closed door reports list
drive.google.com/file/d/1IhCDMZ…
drive.google.com/file/d/1ZI5rrw…
October-December 2022 closed door reports list
drive.google.com/file/d/1HS2IF1…
January 2023 closed door reports list
drive.google.com/file/d/1IhCDMZ…
Check out the supplementary thread for a in-depth look at MiWay routes:
https://twitter.com/rtilley94/status/1640688729743413249?s=20
• • •
Missing some Tweet in this thread? You can try to
force a refresh