Thread on Market Structure, Market Structure Shifts, and the Difference Between Displacement vs. Inducement🧵
♥️&🔁
♥️&🔁

Market Structure is the current orderflow of the market represented in a series of either higher lows & higher highs if bullish, or series of lower highs and lower lows if bearish. An uptrend is bullish orderflow while a downtrend is bearish orderflow.
Market Structure can show different orderflow depending on what timeframe you're looking at so for an example, market structure on the M1-M5 timeframe may be bullish but within H1 timeframe, the HTF may show that market structure is bearish.
For position & swing traders, they will be looking at the H4, D, W, M for market structure to build their trade setup and may use M15/H1 or higher for execution.
For day trading, I like to look at M5/M15 & H1 timeframe for market structure to build my trade setup, while looking at D/W/M market structure for daily & weekly bias, and M1-M5 for execution.
Now that you guys have a basic understanding of market structure we will now discuss what market structure shift, market structure breaks, and what break of structures are. People may use these 3 terms MSS/MSB/BOS interchangeably but I will discuss how I use them.
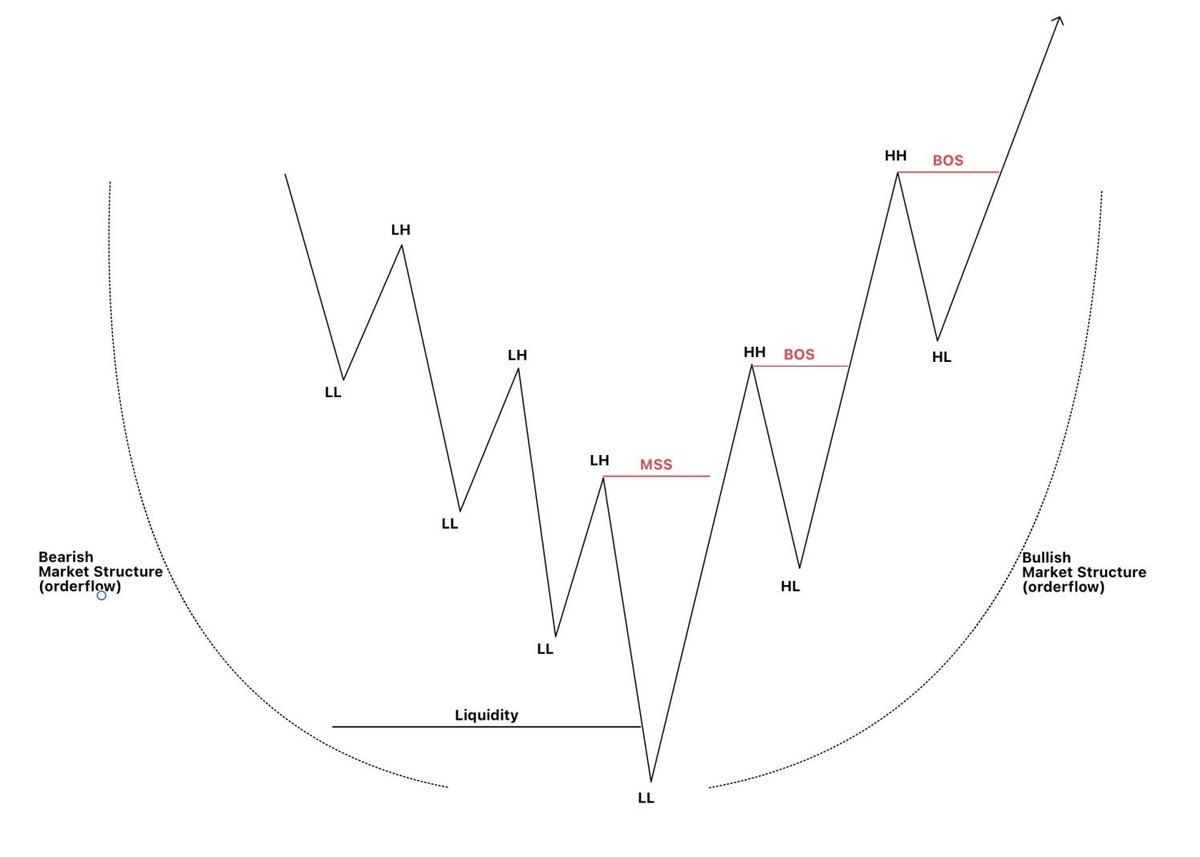
Starting with MSS, the definition is in the name. Before a bullish MSS occurs, the orderflow in the beginning is bearish with lower highs and lower lows being formed then the bullish MSS occurs when LIQUIDITY is taken out, then it makes a higher high instead of a lower high. 


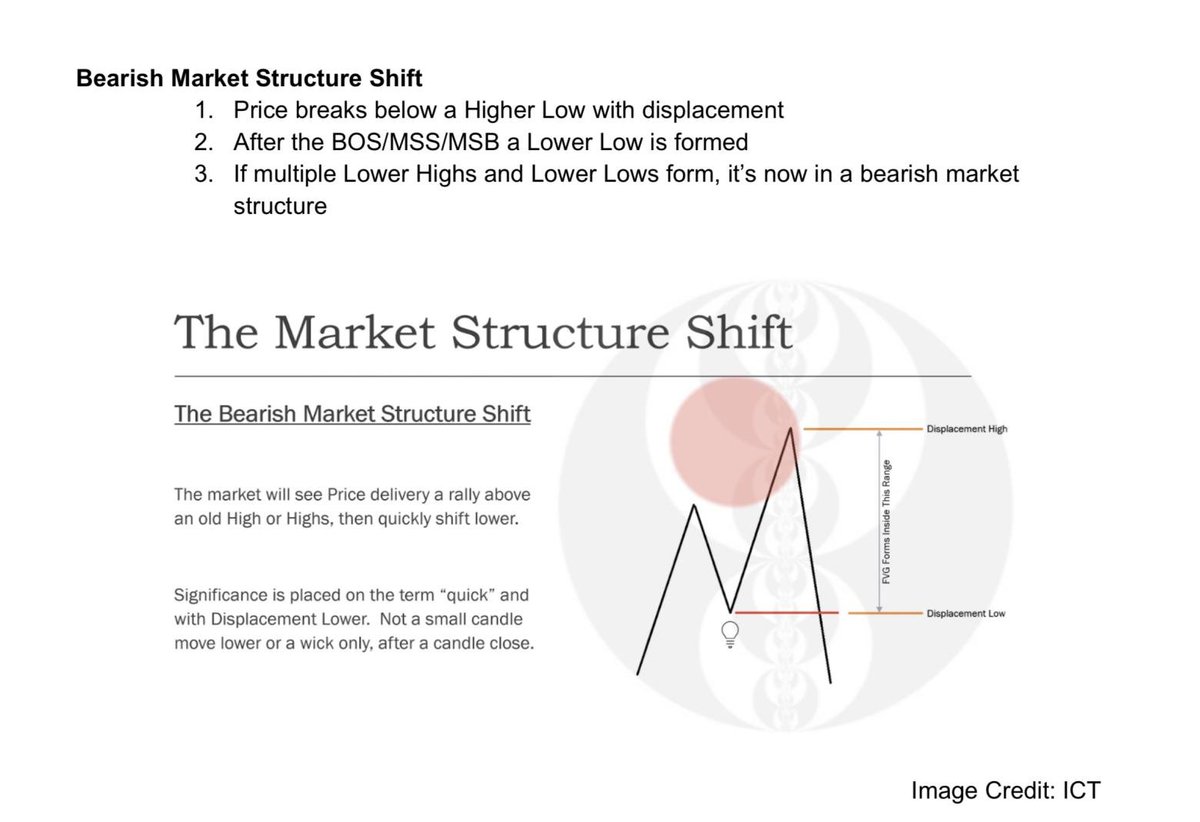
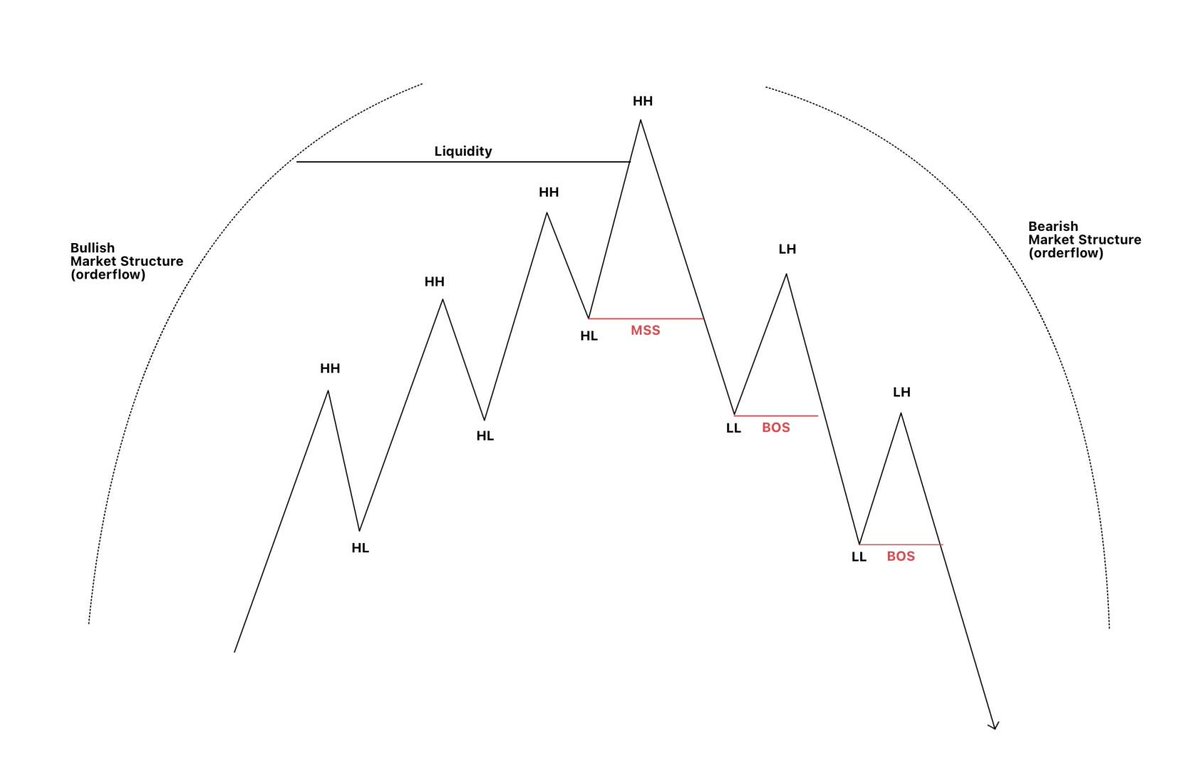
Before a bearish MSS occurs, in the beginning the orderflow has to be bullish with higher highs and higher lows being formed then the bearish MSS occurs when LIQUIDITY is taken out, then it makes a lower low instead of a higher low. 


Market Structure Shifts are INSIGNIFICANT when LIQUIDITY hasn't been taken out. It's raid on liquidity first, then mss, then you can look for entry for price to go towards your next draw on liquidity. For me the only difference between MSS & MSB is MSS is for LTF & MSB is for HTF
For me, Break of structure (BOS) happens after a MSS when a higher high or lower low is made. Again, people may use MSS/MSB/BOS as the same meaning but for me they each mean something different. 


Not only does there need to be a liquidity raid for MSS/MSB to occur, there has to be displacement when price makes a higher high or lower low.
If its a bullish MSS, you will see an aggressive move through that lower high to make a higher high and for bearish MSS you will see an aggressive move through that higher low to make a lower low.
How do you know if it's an aggressive move or not?
Simple. Look for a Fair Value Gap to form. If there isn't a fair value gap then the move isn't aggressive enough for me to consider it a high probability setup.
Simple. Look for a Fair Value Gap to form. If there isn't a fair value gap then the move isn't aggressive enough for me to consider it a high probability setup.
Also with displacement, you want to see the body of the candles close above the lower high or below the higher low. This improves the probability that it is a real MSS/MSB. So look for an FVG to form and where body of candle closes to decide if it's a MSS or not. Good Ex. of MSS: 

When looking for a MSS up, If it keeps wicking off the lower high and doesn't close above it then it's likely inducement meaning price is taking out internal liquidity (that lower high) before going lower to take out sellside liquidity.
When looking for a MSS down, if it keeps wicking off the higher low and doesn't close below it then it's likely inducement meaning price is taking out internal liquidity (that higher low) before going higher to take out buyside liquidity.
When you don't have a clear bias or draw on liquidity look at market structure and wait for displacement to tell you where it's going to go next.
If this thread helped, please like and retweet for more educational threads & content and for others to see. Thank you!
Sign up here to join my trading community: launchpass.com/dangstrat/gold
More educational threads & content below:
https://twitter.com/Dangstrat/status/1640060127016284161?s=20
• • •
Missing some Tweet in this thread? You can try to
force a refresh

 Read on Twitter


