Part II of the Basics of PV loops: preload, coupling, afterload, ventricular dysfunction, and valvular disorders.
Big thanks to the team who helped put this together: @jayamj94 & @PSullivan000, with guest editor @RyanTedfordMD.
If you missed Part I, check it out ⬇️
Big thanks to the team who helped put this together: @jayamj94 & @PSullivan000, with guest editor @RyanTedfordMD.
If you missed Part I, check it out ⬇️
https://twitter.com/AHajduczok/status/1583429179915132935
- Preload is the stretching of cardiac myocytes prior to contraction (related to sarcomere length); it's measurable surrogate: ventricular end-diastolic pressure/volume.
- Δ in preload affect SV (width of PV loop), by the Frank-Starling mechanism. As preload ⬆️, SV (EDV-ESV) ⬆️.
- Δ in preload affect SV (width of PV loop), by the Frank-Starling mechanism. As preload ⬆️, SV (EDV-ESV) ⬆️.


When venous return to the heart is increased, the end-diastolic pressure and volume of the ventricles are increased, which stretches the sarcomeres, increasing their preload. In contrast, hypovolemia (i.e. hemorrhage) leads to less filling and shorter sarcomeres (reduced preload)

Remember, from PV Loops Part I, the way to assess ESPVR (and overall contractility) is to alter preload? This is done with IVC occlusion of varying degrees, which decreases preload and generates the slope of the ESPVR line.
So how this is relevant in assessing RV-PA coupling?
So how this is relevant in assessing RV-PA coupling?
https://twitter.com/AHajduczok/status/1583429251503919104
But first, what is coupling?
- RV-PA coupling refers to the relationship between RV contractility and RV afterload. Contractility is the load-independent or intrinsic RV function. The RV and PA are “coupled” in that RV contractility should “match” the afterload.
- RV-PA coupling refers to the relationship between RV contractility and RV afterload. Contractility is the load-independent or intrinsic RV function. The RV and PA are “coupled” in that RV contractility should “match” the afterload.
If RV afterload were to increase, the RV contractility should similarly increase (ie, through RV hypertrophy and adaptation to load), so that RV function is maintained and RV-PA coupling remains preserved. onlinecjc.ca/article/S0828-….
Two parameters quantify this coupling: Ees (end-systolic elastance) and Ea (pulmonary effective arterial elastance)
Now let's review how this is clinically relevant in assessing ventriculo-arterial coupling (for left side) or RV-PA coupling (for right side)
Now let's review how this is clinically relevant in assessing ventriculo-arterial coupling (for left side) or RV-PA coupling (for right side)
Ees is the slope of the end-systolic pressure volume relationship (ESPVR), and represents load-independent contractility.
Ea, is a measure of ventricular afterload and is calculated as the ratio of end-systolic pressure and stroke volume. (@RyanTedfordMD: sciencedirect.com/science/articl…)
Ea, is a measure of ventricular afterload and is calculated as the ratio of end-systolic pressure and stroke volume. (@RyanTedfordMD: sciencedirect.com/science/articl…)

Here, RV PV loops derive end-systolic elastance (Ees) from the slope of the peak of the loops with Δ in venous return, & arterial elastance (Ea) from the ratio of RV end-systolic pressure and SV. The ratio (Ees/Ea) quantifies RV-PA coupling. cdleycom.com @PSullivan000
Now to afterload.
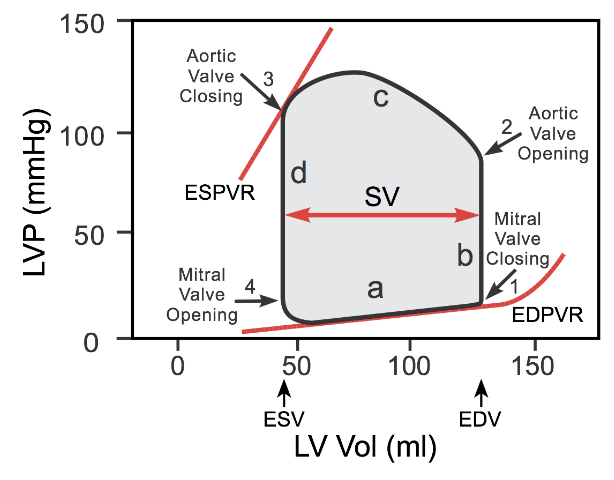
- Afterload is the load the heart must overcome to eject blood during ventricular contraction
- An ⬆️ in afterload (aortic pressure) = ⬆️ LV pressure needed for the aortic valve to open during isovolumetric contraction. This results in a taller PV loop.
- Afterload is the load the heart must overcome to eject blood during ventricular contraction
- An ⬆️ in afterload (aortic pressure) = ⬆️ LV pressure needed for the aortic valve to open during isovolumetric contraction. This results in a taller PV loop.

Higher afterload = smaller stroke volume and an ⬆️ in end-systolic volume (red loop). SV decreases because ⬆️ afterload reduces the velocity of muscle fiber shortening/the velocity at which the blood is ejected. A reduced SV at the same end-diastolic volume results in reduced EF.
Let's look at how we measure afterload with PV loops:
- Prolonged handgrip maneuver is used to ⬆️ afterload
- One can monitor acute diastolic response (EDPVR) to confirm whether a pt has HFpEF or used to monitor for efficacy of ventricular unloading w/ MCS. (🎥: W. Cornwell, UC)
- Prolonged handgrip maneuver is used to ⬆️ afterload
- One can monitor acute diastolic response (EDPVR) to confirm whether a pt has HFpEF or used to monitor for efficacy of ventricular unloading w/ MCS. (🎥: W. Cornwell, UC)
Now that we discussed the basics of PV loops and some effects of changes in afterload, preload, coupling and cardiac contractility, let’s talk about some cardiac pathologies and their effects of PV loops...
Ventricular Systolic Dysfunction:
LV systolic dysfunction is characterized by ⬇️ ability of the LV to contract, also known as loss of inotropy. Decreased LV contractility results in decreased SV. Acutely, this leads to ⬆️ preload (an ⬆️ LVEDP can be deleterious over time).
LV systolic dysfunction is characterized by ⬇️ ability of the LV to contract, also known as loss of inotropy. Decreased LV contractility results in decreased SV. Acutely, this leads to ⬆️ preload (an ⬆️ LVEDP can be deleterious over time).

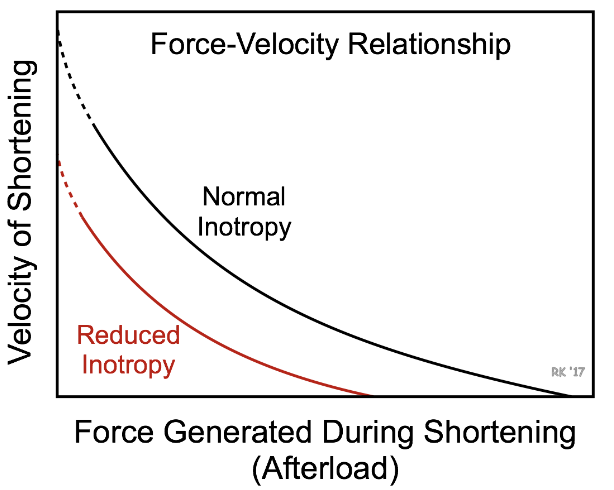
The ⬆️ in preload does not fully compensate for loss of SV from decreased inotropy and overall SV is still ⬇️. Decreased inotropy is shown by a ⬇️ ESPVR slope, and an ⬆️ end systolic volume. As SV decreases and end diastolic volume increases, the ejection fraction greatly ⬇️ ⬇️.

Ventricular diastolic dysfunction is characterized by impaired ventricular filling. ⬇️ ventricular filling ⬇️ preload and SV. ⬇️ ventricular compliance ⬆️ the slope of EDPVR.

Here is a real-life example of HFpEF (LV Loops) from Houston Methodist team (@hfdocbhimaraj, @SNagueh):
Note the difference in EDPVR slope in the HFpEF vs non-HFpEF patient. nature.com/articles/s4159…
Note the difference in EDPVR slope in the HFpEF vs non-HFpEF patient. nature.com/articles/s4159…
https://twitter.com/PSullivan000/status/1505887690499280899
Another ex. using RV PV loops in HFpEF pts from the Leipzig Heart Center Team: pubmed.ncbi.nlm.nih.gov/29449367/
Transient preload reduction was used to extrapolate the RV end-systolic elastance and diastolic stiffness constant.
@KP_Kresoja @KP_Rommel @PhilippLurz @RoschSeb @thiele_holger
Transient preload reduction was used to extrapolate the RV end-systolic elastance and diastolic stiffness constant.
@KP_Kresoja @KP_Rommel @PhilippLurz @RoschSeb @thiele_holger

Last but not least, valvular disorders...
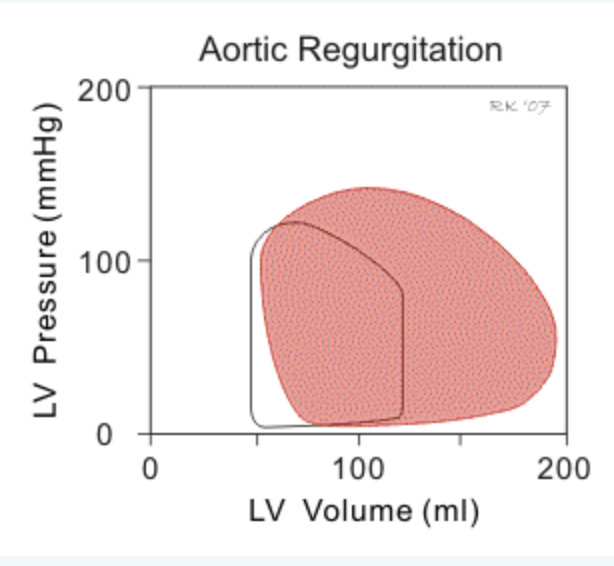
1. Aortic regurgitation
2. Aortic stenosis
3. Mitral stenosis
4. Mitral regurgitation
1. Aortic regurgitation
2. Aortic stenosis
3. Mitral stenosis
4. Mitral regurgitation

1. Aortic regurgitation
- lack of iso-volumetric relaxation (no vertical line btwn AV closure and MV opening)
- loop shifts right (⬆️ in LV end diastolic volume) as regurgitant blood flows into the LV through diastole
- in chronic AI the LV dilates (remodels) and ⬆️ LV compliance
- lack of iso-volumetric relaxation (no vertical line btwn AV closure and MV opening)
- loop shifts right (⬆️ in LV end diastolic volume) as regurgitant blood flows into the LV through diastole
- in chronic AI the LV dilates (remodels) and ⬆️ LV compliance
2. Aortic stenosis
- higher LV pressure is require for AV opening; increasing peak systolic pressure.
- ⬆️ in afterload also results from increased LV wall stress
- result is decreased SV and increased end-systolic volume
- in chronic AS, LV hypertrophy -> ⬆️ LVEDP, ⬇️ LVEDV
- higher LV pressure is require for AV opening; increasing peak systolic pressure.
- ⬆️ in afterload also results from increased LV wall stress
- result is decreased SV and increased end-systolic volume
- in chronic AS, LV hypertrophy -> ⬆️ LVEDP, ⬇️ LVEDV

Here are two nice papers that highlight the use of PV loops in TAVR patients
1) jacc.org/doi/10.1016/j.… (figure below) @drnvanmieghem
2)jacc.org/doi/10.1016/j.… @Fredrickwelt @StavrosDrakos @MikeYin19
1) jacc.org/doi/10.1016/j.… (figure below) @drnvanmieghem
2)jacc.org/doi/10.1016/j.… @Fredrickwelt @StavrosDrakos @MikeYin19

3. Mitral stenosis
- impaired in LV filling -> ⬇️ preload and SV (narrower loop).
- decrease in aortic pressure results in a slight decrease in afterload resulting in a slight decrease in ventricular end systolic volume, but overall stroke volume still decreases.
- impaired in LV filling -> ⬇️ preload and SV (narrower loop).
- decrease in aortic pressure results in a slight decrease in afterload resulting in a slight decrease in ventricular end systolic volume, but overall stroke volume still decreases.

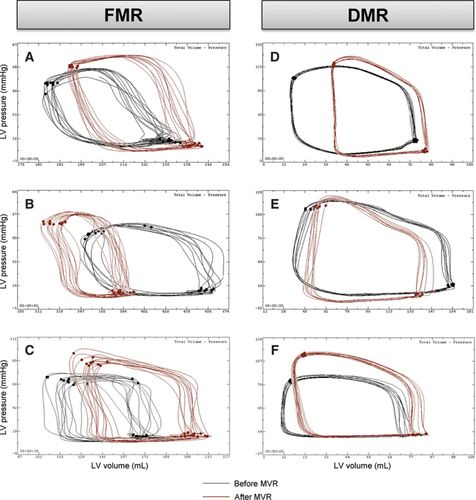
4. Mitral regurgitation
- no true isovolumetric contraction or relaxation, as seen by trapezoid-shaped loops, since blood continues to flow through mitral valve back into the LA (⬆️ LA pressure)
- LV afterload ⬇️ (and EF% ⬆️) due to less outflow resistance & LVESV can be lower
- no true isovolumetric contraction or relaxation, as seen by trapezoid-shaped loops, since blood continues to flow through mitral valve back into the LA (⬆️ LA pressure)
- LV afterload ⬇️ (and EF% ⬆️) due to less outflow resistance & LVESV can be lower

- one benefit of real-time PV loop hemodynamic monitoring is an operator can see these isovolumetric phases return immediately during an intervention, such as with the MitraClip(R) procedure.
ahajournals.org/doi/full/10.11…
ahajournals.org/doi/full/10.11…
Thanks for joining us on part II of our journey to better understand PV loops (and for a more advanced understanding of hemodynamics and the cardiac cycle).
Stay tuned for Part III on PV loops of specific disease states, cardiogenic shock, devices and drugs #hemodynamics
Stay tuned for Part III on PV loops of specific disease states, cardiogenic shock, devices and drugs #hemodynamics
Tag your friends who also love hemodynamics/PV loops. We'll start with a few:
@IRajapreyar @YevgeniyBr @PSullivan000 @rachkataria @vbluml @Abraham_Jacob @Babar_Basir @Brian_Houston12 @AndrewJSauer @BurkhoffMd @BrenerMickey @MarkBelkinMD @RRVdpool and of course...@RyanTedfordMD.
@IRajapreyar @YevgeniyBr @PSullivan000 @rachkataria @vbluml @Abraham_Jacob @Babar_Basir @Brian_Houston12 @AndrewJSauer @BurkhoffMd @BrenerMickey @MarkBelkinMD @RRVdpool and of course...@RyanTedfordMD.
• • •
Missing some Tweet in this thread? You can try to
force a refresh