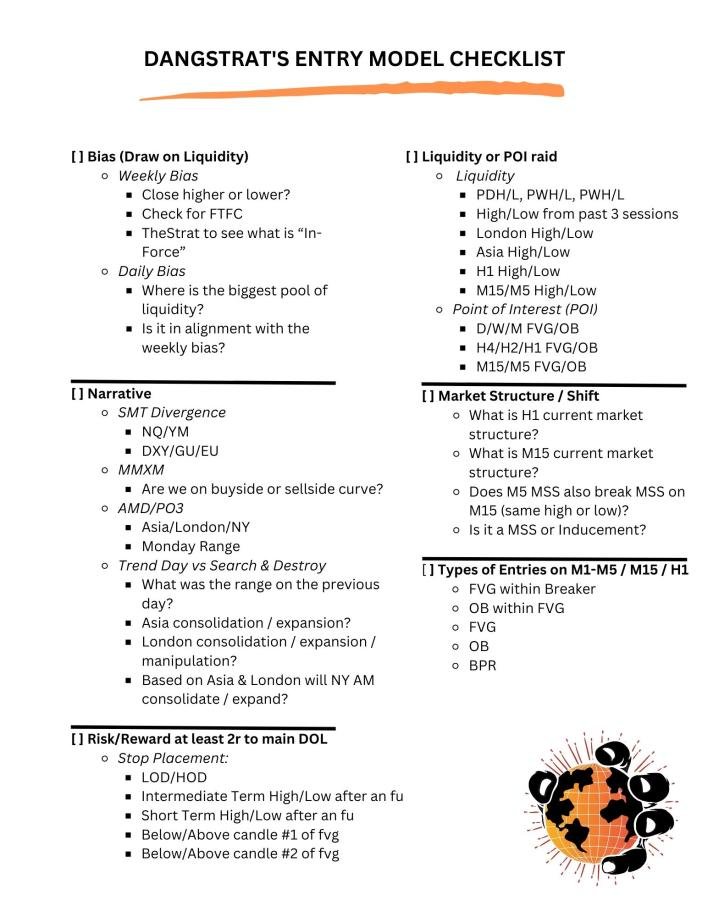
Thread on External vs. Internal Liquidity, Dealing Ranges, and how to find the Draw on Liquidity🧵
♥️&🔁
♥️&🔁

External & Internal Range Liquidity will depend on what type of trader you are because each type of trader's dealing range will be different based on the timeframe that you are looking at.
For me as a day trader, my external range liquidity is usually the previous day's high & low, Intraday high & low, or the session high and low from Asia, London, or New York. The timeframe that im looking at is M5/M15/H1 to find external & internal liquidity.
Here is an example of PDH & PDL being used as external liquidity which would be the dealing range. Once external liquidity is taken out, you now have a new dealing range. All of the highs & lows in-between external liquidity is internal liquidity. 

For swing/position traders they will be using HTF charts such as the D/W/M charts to find their external & internal liquidity. This is the current HTF dealing range that we're in for $ES. 

Now that you understand external & internal liquidity & dealing ranges we will now discuss how to find the Draw on Liquidity (DOL).
The DOL is the most important part of a setup. Not raid on liquidity, not market structure or MSS, not entry models, it is the DOL that is the most important. None of it matters without the DOL because a setup is not a setup if you dont know where price is going to go.
When you know the DOL, then raid on liquidity, market structure & MSS become valid, and then it will give you multiple entries along the way with the Market Maker Buy/Sell Models. (Thread on MMXM coming in the future).
As a day trader, my DOL is typically PWH/L, PDH/L, or session H/L from Asia, London, or New York paired with EQH/L with a Low Resistance Liquidity Run (LRLR) condition. EQH/L are large pools of liquidity so institutions will always draw towards those levels to take out retail.
You will notice that the DOL is the same levels for external range liquidity and that is because price moves from one end of the external range to the other. If price takes out external liquidity and keeps moving in that direction it's moving towards external liquidity on HTF.
For indices we dont get inside bars often on the daily chart. An inside bar is when the high and low of the candle stays within the previous candle. 

All of the yellow candles are inside bars so because we know that inside days dont happen often on $ES we can expect the previous day's high or low to get taken out for our Draw on Liquidity as day traders. 

Now all we have to do is use market structure & the intraday templates to determine if it's going to be PDH getting taken out or PDL getting taken out next.
Intraday Templates Thread
https://twitter.com/Dangstrat/status/1637848935938109442?s=20
Market Structure Thread
https://twitter.com/Dangstrat/status/1640750954524934165?s=20
$NQ The day of the most previous FOMC (March 22, 2023) the DOL was these EQH at old daily highs. These EQH are internal BSL on HTF charts for swing/position traders. 

$NQ While those EQH is Internal BSL for swing/position traders, for day traders the PDH/L is our external range liquidity. Price took out PDH first but there was no MSS yet to downside until those EQH got swept since that was the main HTF DOL. 


Once price took out external buyside liquidity for day traders, we now look for where the next DOL could be. You can see we have EQL & LRLR condition to PDL so now we wait for MSS to target PDL. Entry short would have been the M5 FVG IOFED and this was a clean 2r setup to PDL DOL 

If this thread helped, please like and retweet for more educational content and for others to see! Thank you.
Here is my Linktree for links to become a lifetime or gold member of my Discord: linktr.ee/dangstrat
If this thread brought value to you and you want to buy me lunch, you can do it here by purchasing my Trading Journal Template!
win-win for everyone🤝
dangstratify.gumroad.com/l/hqpkb
win-win for everyone🤝
dangstratify.gumroad.com/l/hqpkb
• • •
Missing some Tweet in this thread? You can try to
force a refresh

 Read on Twitter


