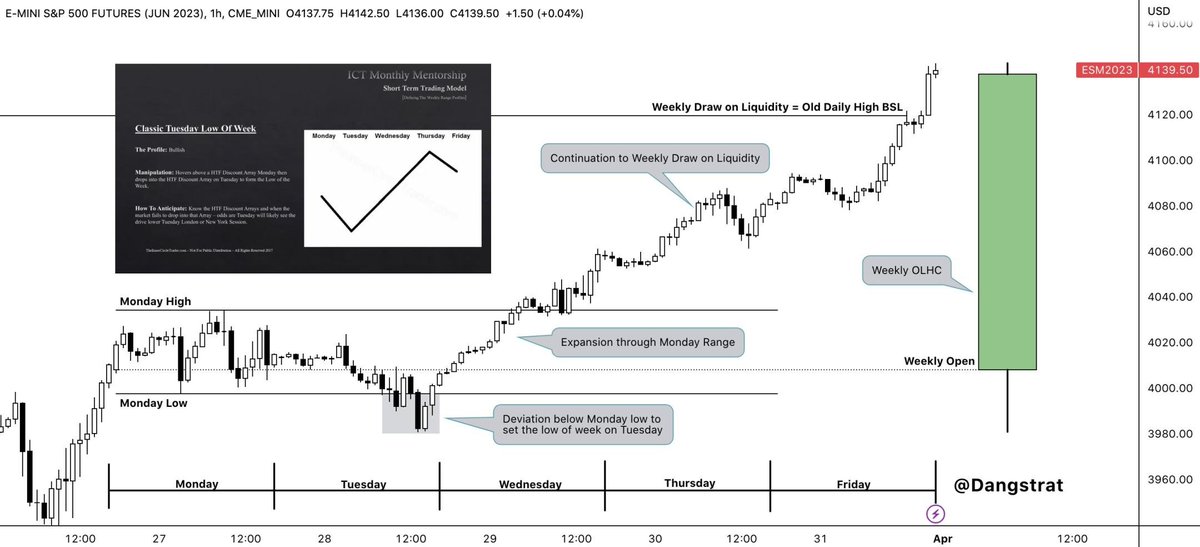
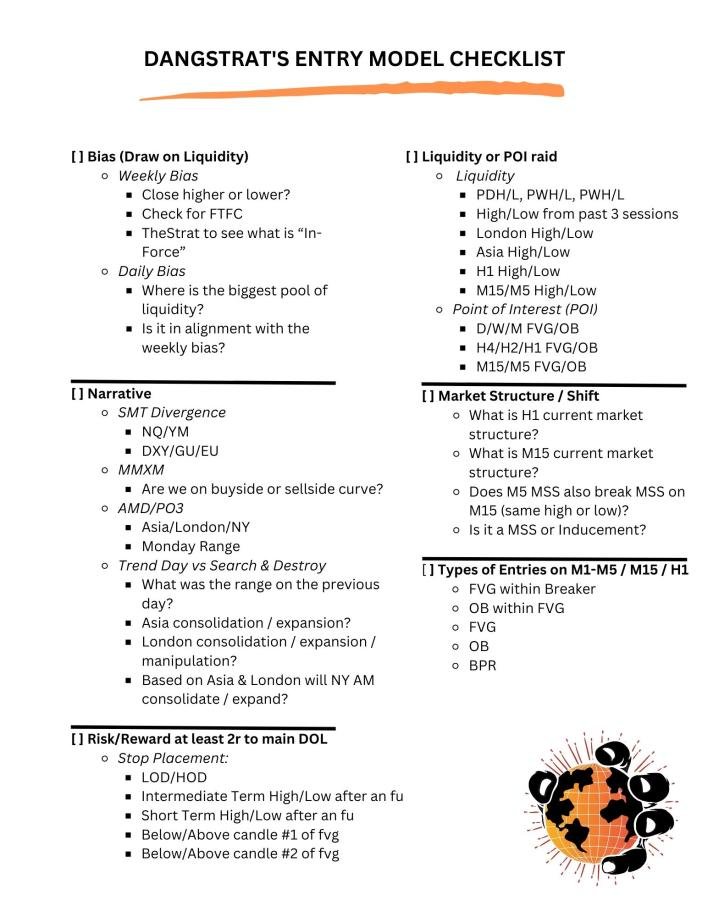
Thread on LRLR vs HRLR🧵
LRLR = Low Resistance Liquidity Run
HRLR = High Resistance Liquidity Run
♥️&🔁
LRLR = Low Resistance Liquidity Run
HRLR = High Resistance Liquidity Run
♥️&🔁

As a trader you want to be trading when there is LRLR conditions because during LRLR conditions price will cleanly deliver to your target a lot quicker than HRLR conditions. If you're in a trade a lot longer than expected it is most likely because you are in HRLR conditions.
A LRLR will have clean highs or lows and for this example it means there's a large pool of liquidity resting above the Clean Highs/EQHs. This is where retail traders are placing their stops and smart money will look to take out these stops. 

Another way you can look at LRLR is if there are EQH/Ls & multiple highs/lows lined up in a row (Trendline Liquidity). #TheStrat traders call Pivot Machine Gun (PMG). It's called PMG because the algorithm spools higher like a machine gun triggering stop losses to get taken out. 

So in this example, after SSL got raided, you're looking to go long inside of the FVG within the BPR to target the EQH. This is LRLR conditions. 

When you have EQH/L, any PD arrays in-between where price is currently at to the EQH/L will have a low probability of holding.
Smart money will target the largest liquidity pool which will be the EQH/EQL so price will either go through the PD array, or consolidate at the PD array then continue in the direction of the EQH/L.
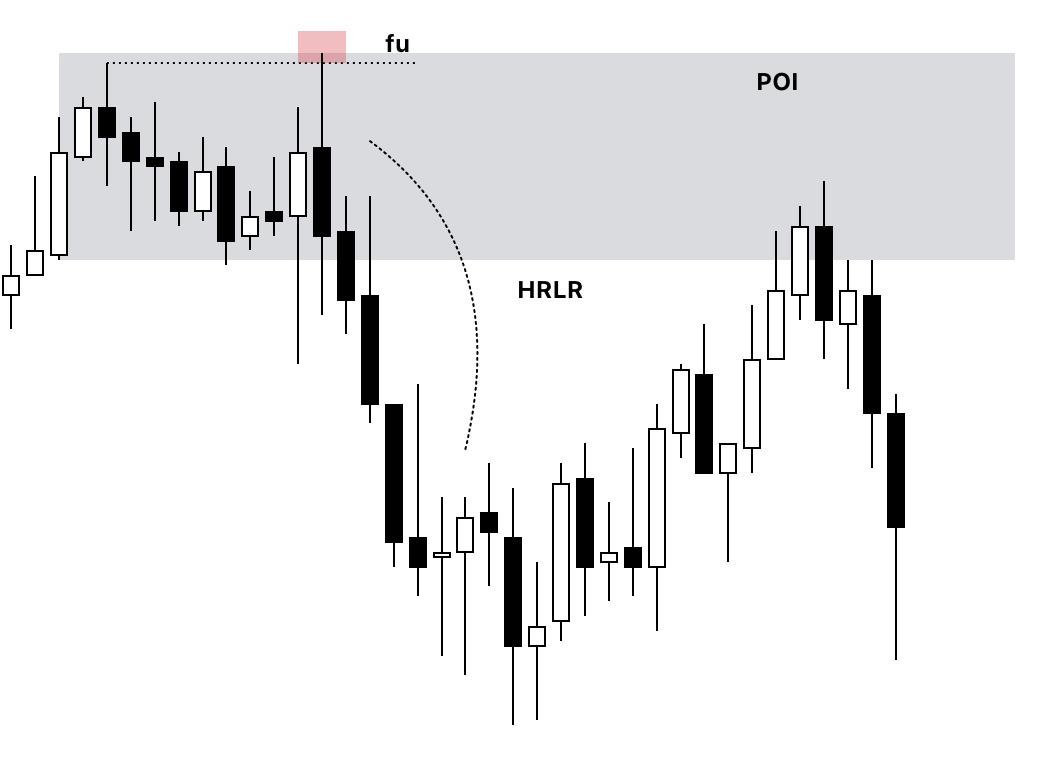
Now we will look at an example of HRLR. Typically with HRLR conditions there will be a stop hunt (fu) on buyside or sellside liquidity. Once there's a stop hunt it will leave a Point of Interest (POI) / PD array which is typically an orderblock or fair value gap. 

Because there's a stop hunt (fu) which leaves a POI, the POI will act as resistance which will make it a HRLR condition. So in this example, instead of going long at the lows to target the high formed from (fu), I'd rather wait for price to reject off the POI to look for shorts. 

1st pic below is M15 timeframe, 2nd pic below is H1 timeframe. You will see a M15 fu raid on BSL which leaves an H1 bearish orderblock making it HRLR. After the fu raid price went lower and when it retraced back up it rejected the orderblock then started to take out internal SSL. 


HRLR conditions can also happen when indices ( $ES $NQ $YM ) is not in sync with each other or when it's not in moving inversely to $DXY (dollar). $GU & $EU are suppose to move inversely w/ $DXY as well so if they're moving together it is HRLR conditions.
Here is my Linktree to become a Lifetime or Gold Member! Join our Discord Community to grow as traders, share trade ideas, and see price action how I see it. Sign up for Lifetime Membership to get my trade signals. linktr.ee/dangstrat
If you want to improve your discipline & trading edge you can purchase my Trading Journal Template to easily track all of your trades! dangstratify.gumroad.com/l/hqpkb
I spend hours just to make one thread so if this thread helped, please like and retweet for more educational content and for others to see! Thank you🧡
• • •
Missing some Tweet in this thread? You can try to
force a refresh

 Read on Twitter


