Before I discuss the different ways on how to use a FVG, I will go over the anatomy of the FVG, what it is, and why it forms.
There are two types of Fair Value Gaps (FVG).
BISI = Buyside Imbalance Sellside Inefficiency
SIBI = Sellside Imbalance Buyside Inefficiency
There are two types of Fair Value Gaps (FVG).
BISI = Buyside Imbalance Sellside Inefficiency
SIBI = Sellside Imbalance Buyside Inefficiency
A Bullish FVG is a BISI . A FVG is made up of 3 consecutive candlesticks. In a BISI, it starts with the high of candle #1 which will be the FVG low and ends with the low of candle #3 which is the FVG High. 

A Bullish FVG gets created when the low of candle #3 doesn't overlap the high of candle #1. This happens when there is a displacement in price from candle #2. 

It is called a Buyside Imbalance Sellside Inefficiency (BISI) because during candle number 2 there is only buyside offered to the market so there's a Buyside Imbalance and because there's no sellside being offered there's a Sellside Inefficiency. 

A Bearish FVG is a SIBI. A SIBI starts at the low of candle #1 which is the FVG High and ends with the high of candle #3 which is the FVG Low. A Bearish FVG is created when the high of candle #3 doesn't overlap the low of candle #1. This happens from the displacement of candle #2 

It is called a Sellside Imbalance Buyside Inefficiency (SIBI) because during candle #2 there was only sellside offered to the market so there's a Sellside Imbalance and because there is no buyside being offered there's a Buyside Inefficiency. 

It's the color of candle #2 that determines if the FVG is a BISI or a SIBI.
BISI FVGs will have an up-close candle for candle #2. Candles #1 or #3 color doesn't matter.
SIBI FVGs will have a down-close candle for candle #2. Candles #1 or #3 color doesn't matter.

BISI FVGs will have an up-close candle for candle #2. Candles #1 or #3 color doesn't matter.
SIBI FVGs will have a down-close candle for candle #2. Candles #1 or #3 color doesn't matter.


Now that you understand what a Fair Value Gap is, I will now discuss the 3 different ways on how I use the FVG:
1. Entry Model
2. Draw On Liquidity
3. Point of Interest (POI) / PD Array
1. Entry Model
2. Draw On Liquidity
3. Point of Interest (POI) / PD Array
1st Way: I use the FVG as an Entry Model but this FVG is only valid if there has been a raid on liquidity or POI & a market structure shift. You need both a raid + mss before an entry on the FVG. The FVG is typically created from displacement when mss occurred. BISI vs SIBI ex: 


For my entry model I stay on the M15 TF or below to look for the FVG. Typically my entries are inside of FVGs on M1-M5 timeframe after a HTF + LTF raid, and M5/M15 MSS.
2nd Way: I use the FVG as a Draw on Liquidity. Algorithm draws price towards liquidity & imbalances in the market based on time. HTF FVGs will act as a magnet so price can get rebalanced. BISIs will be the DOL for short positions & SIBIs will be the DOL for long positions. 


If you're using the FVG as a DOL look at the HTF, preferably M15 or higher. The higher it is the more significant it is. A randon FVG on the M1 timeframe shouldn't be used as a DOL unless there is other confluence backing it up as in there's a key high/low near it for DOL as well
If you're using the FVG as the DOL and you may see multiple FVGs like this in a row then it means you need to move up and look at higher timeframes because all of these FVGs on LTF is 1 FVG on a HTF. 

Pic #1 has multiple FVGs in the range on M5 so it's a BISI since you dont have any down-close candles in this range. Move up to M30 TF and you'll see it's a single FVG. Price doesn't have to completely fill the FVG. It could just test the high for BISI & low for SIBI then reverse 


3rd Way: I use the FVG as a HTF Point of Interest / PD array where price could potentially reverse if there is a market structure shift after raiding the FVG. Wait for price to reach the FVG as a POI / PD Array (raid) then look for a MSS before entering the trade. 


Other helpful things to know about FVGs are: ICT's Paint Brush Analogy, IOFED, & Consequent Encroachment.
ICT Paint Brush Analogy:
https://twitter.com/Dangstrat/status/1640671637707059202?s=20
IOFED = Institutional Order Flow Entry Drill
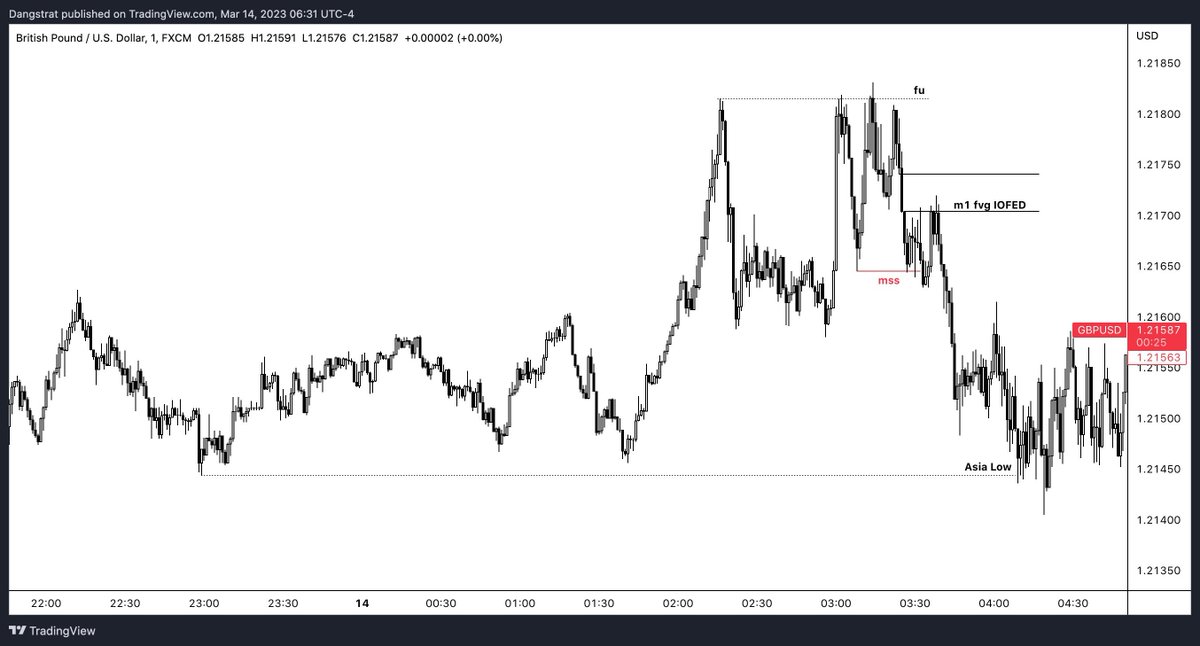
After a raid + mss, when price retraces back into a FVG and immediately rejects and starts moving aggressively towards the DOL that means it's a IOFED because smart money is using that FVG as an entry long or short.
IOFED examples:


After a raid + mss, when price retraces back into a FVG and immediately rejects and starts moving aggressively towards the DOL that means it's a IOFED because smart money is using that FVG as an entry long or short.
IOFED examples:


Consequent Encroachment (CE) is the midpoint of the FVG from the FVG low to FVG high. FVGs do not have to completely fill. A lot of the times price will wick/reverse off the low/high or CE of the FVG. CE can also be used to measure 50% point of breaker blocks and long wicks. 


Here is my Linktree to become a Lifetime or Gold Member! Join our Discord Community to grow as traders, share trade ideas, and see price action how I see it. Sign up for Lifetime Membership to get my trade signals. linktr.ee/dangstrat
If you want to improve your discipline & trading edge you can purchase my Trading Journal Template to easily track all of your trades! dangstratify.gumroad.com/l/hqpkb
I spend hours just to make one thread so if this thread helped, please like and retweet for more educational content and for others to see! Thank you🧡
• • •
Missing some Tweet in this thread? You can try to
force a refresh

 Read on Twitter


