Sunil Gurjar, CFTe Profile picture
Apr 22, 2023 โ€ข 8 tweets โ€ข 5 min read โ€ข Read on X
๐€ ๐๐จ๐ฌ๐ข๐ญ๐ข๐จ๐ง๐š๐ฅ ๐“๐ซ๐š๐๐ข๐ง๐  ๐’๐ญ๐ซ๐š๐ญ๐ž๐ ๐ฒ ๐ฐ๐ก๐ข๐œ๐ก ๐–๐จ๐ซ๐ค๐ฌ ๐š๐ง๐ ๐Œ๐š๐ค๐ž๐ฌ ๐Œ๐จ๐ง๐ž๐ฒ ๐Ÿ๐จ๐ซ ๐ฆ๐ž!

A Master Thread with "๐‚๐š๐ฌ๐ž ๐’๐ญ๐ฎ๐๐ข๐ž๐ฌ"!๐Ÿงต๐Ÿ‘‡
Case Study (1)

Below mentioned chart is the daily chart of Ambuja Cement showing how it performed after the entry was taken and where we would have taken exit.

Do read the exit rule written in the image.
In this example I am using 50 DEMA as a exit rule. ImageImage
Case Study (2)

Below given chart is the daily chart of granules india and forming up bullish continuation pattern.

A strong Breakout occurred which signified strong bullishness and we would have place our stop loss just below tight buildup price action. Image
Case Study(3)

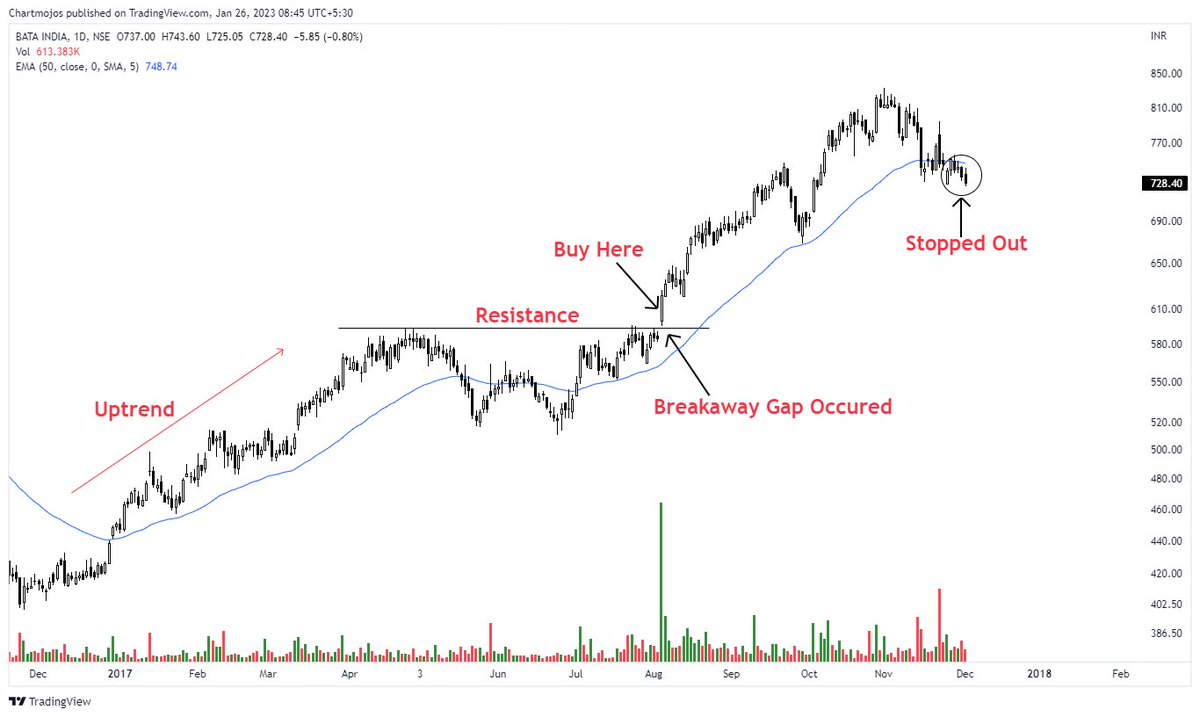
The graphic below is the daily chart of bata india showing C&H Continuation pattern which happened with breakaway gap.

I have also mentioned where we will take entry and put our stop loss and get stopped out.

Do read exit rule given in the 1st case study image. Image
Case Study (4)

Below given chart is the daily chart of Bharat Electronic, forming up symmetrical pattern.

A strong BO Candle occurred which signified strong upside and mentioned the place where would have placed our SL and gotten stopped out.

Here, I have used ATR as SL. Image
Case Study (5)

The graphic below is the daily chart of JKLAKSHMI showing trend reversal pattern which happened with strong BO candle.

I have also mentioned where we will take entry and put our stop loss and get stopped out.

Do read exit rule given in the 1st case study image. Image
That's the wrap here!

Remember you can use stop loss in the form of price action based or ATR based.

Do consider volume as well while using this positional trading strategy.
If you found the thread helpful than do spread the word.

๐ƒ๐จ "๐‘๐ž๐ญ๐ฐ๐ž๐ž๐ญ" ๐ญ๐ก๐ž ๐Ÿ๐ข๐ซ๐ฌ๐ญ ๐ญ๐ฐ๐ž๐ž๐ญ.

Happy Reading!

@chartmojo @caniravkaria @jitendrajain @PAlearner @KommawarSwapnil @Puretechnicals9 @BeyondTrading07 @nakulvibhor @PatilBankNifty @Abhishekkar_

โ€ข โ€ข โ€ข

Missing some Tweet in this thread? You can try to force a refresh
ใ€€

Keep Current with Sunil Gurjar, CFTe

Sunil Gurjar, CFTe Profile picture

Stay in touch and get notified when new unrolls are available from this author!

Read all threads

This Thread may be Removed Anytime!

PDF

Twitter may remove this content at anytime! Save it as PDF for later use!

Try unrolling a thread yourself!

how to unroll video
  1. Follow @ThreadReaderApp to mention us!

  2. From a Twitter thread mention us with a keyword "unroll"
@threadreaderapp unroll

Practice here first or read more on our help page!

More from @sunilgurjar01

Oct 26
๐๐จ๐ฅ๐ฅ๐ข๐ง๐ ๐ž๐ซ ๐๐š๐ง๐ ๐’๐ช๐ฎ๐ž๐ž๐ณ๐ž ๐๐ซ๐ž๐š๐ค๐จ๐ฎ๐ญ: ๐๐ซ๐ž๐š๐ค๐จ๐ฎ๐ญ ๐‹๐จ๐š๐๐ข๐ง๐ !๐Ÿ“Š๐Ÿ”–

๐…๐ซ๐ž๐ž ๐“๐ž๐ฅ๐ž๐ ๐ซ๐š๐ฆ ๐Ÿ‘‡


๐€ ๐Œ๐ž๐ ๐š [ ๐“๐ก๐ซ๐ž๐š๐ ] ๐Ÿงต

1- CUMMINSIND t.me/financewithsunโ€ฆImage
2- JAYNECOIND Image
3- VMM Image
Read 8 tweets
Oct 4
๐–๐‡๐„๐ ๐ˆ ๐’๐“๐€๐‘๐“๐„๐ƒ, ๐ˆ ๐–๐€๐’ ๐‚๐Ž๐๐…๐”๐’๐„๐ƒ ๐€๐๐ƒ ๐…๐‘๐”๐’๐“๐‘๐€๐“๐„๐ƒ ๐๐˜ ๐‡๐Ž๐– ๐“๐‡๐„ ๐’๐”๐๐„๐‘๐“๐‘๐„๐๐ƒ ๐€๐‹๐–๐€๐˜๐’ ๐†๐€๐•๐„ ๐Œ๐„ ๐‹๐€๐“๐„ ๐Ž๐‘ ๐…๐€๐‹๐’๐„ ๐’๐ˆ๐†๐๐€๐‹๐’

๐๐Ž๐– ๐ˆ ๐Š๐๐Ž๐– ๐๐„๐“๐“๐„๐‘.
๐ˆ ๐Œ๐€๐ƒ๐„ ๐€ ๐’๐ˆ๐Œ๐๐‹๐„ ๐’๐”๐๐„๐‘๐“๐‘๐„๐๐ƒ ๐†๐”๐ˆ๐ƒ๐„ ๐…๐Ž๐‘ ๐˜๐Ž๐” ๐Ÿšฆ

๐€ ๐“๐‡๐‘๐„๐€๐ƒ ๐Ÿงต๐ŸงตImage
1. Supertrend Indicator ๐Ÿ‘‰ A line on the chart that shows the market trend.

Green line below price = Uptrend (Buy).

Red line above price = Downtrend (Sell).

๐Ÿ‘‰ Quick way to see if the market is going up or down. Image
2.upertrend Indicator = A line on the chart that moves with price.

Made using ATR (volatility) ร— multiplier.

Price above line โ†’ Uptrend (Buy).

Price below line โ†’ Downtrend (Sell).

๐Ÿ‘‰ Works like support & resistance to guide entry and exit. Image
Read 6 tweets
Oct 2
๐–๐‡๐„๐ ๐ˆ ๐’๐“๐€๐‘๐“๐„๐ƒ, ๐“๐‡๐„ ๐Œ๐€๐‚๐ƒ ๐…๐„๐‹๐“ ๐“๐Ž๐Ž ๐‚๐Ž๐Œ๐๐‹๐ˆ๐‚๐€๐“๐„๐ƒ โ€” ๐‹๐ˆ๐๐„๐’, ๐‡๐ˆ๐’๐“๐Ž๐†๐‘๐€๐Œ๐’, ๐‚๐‘๐Ž๐’๐’๐Ž๐•๐„๐‘๐’. ๐€๐‹๐‹ ๐‚๐Ž๐๐…๐”๐’๐ˆ๐๐†.

๐๐Ž๐– ๐ˆ ๐”๐๐ƒ๐„๐‘๐’๐“๐€๐๐ƒ ๐ˆ๐“ ๐‚๐‹๐„๐€๐‘๐‹๐˜.
๐‡๐„๐‘๐„โ€™๐’ ๐€ ๐’๐ˆ๐Œ๐๐‹๐„, ๐๐‘๐Ž๐…๐„๐’๐’๐ˆ๐Ž๐๐€๐‹ ๐†๐”๐ˆ๐ƒ๐„ ๐“๐Ž ๐“๐‡๐„ ๐Œ๐€๐‚๐ƒ ๐ˆ๐๐ƒ๐ˆ๐‚๐€๐“๐Ž๐‘ ๐Ÿ“Š

๐€ ๐“๐‡๐‘๐„๐€๐ƒ ๐Ÿงต๐ŸงตImage
2. MACD

MACD indicator is used to identify trends, potential reversals and momentum in a given asset.

MACD consists of three main parts:

- The MACD line

- The Signal line

- The Histograms Image
2.1 What *MACD* Histogram MACD Histogram shows the difference between the MACD line and the signal line.

MACD line = Short-term EMA โ€“ Long-term EMA

Signal line = 9-day average of MACD line

Histogram = MACD line โ€“ Signal line
Read 8 tweets
Sep 28
WHEN I STARTED, I WAS ALWAYS CONFUSED AND FRUSTRATED BY HOW MOST SUPPLY AND DEMAND ZONES I CHOSE FAILED

NOW I KNOW BETTER, I MADE A SIMPLE SUPPLY AND DEMAND GUIDE FOR YOU

A THREAD๐Ÿงต๐Ÿงต Image
1.*Supply Zone (๐Ÿ“‰)*
A supply zone is a price area where selling pressure is stronger than buying pressure. It usually forms after a sharp move downward, showing where big sellers (institutions, smart money, or large traders) entered the market.

๐Ÿ”น When price revisits this zone, sellers often re-enter with fresh orders.
๐Ÿ”น The excess supply creates resistance, making it hard for price to break higher.
๐Ÿ”น As a result, price may slow down, consolidate, or reverse downward from this area.

*Key Characteristics of a Supply Zone* :

Found near previous swing highs or after strong bearish moves.

Formed by clusters of sell orders left behind by institutions.

Acts like a โ€œresistance wallโ€ where price struggles to advance.Image
2. *Demand Zone* *(๐Ÿ“ˆ)*
A demand zone is an area on the chart where buyers are more aggressive than sellers. This imbalance creates upward pressure on price.

๐Ÿ”น When price drops into this zone, buyers step in with strong buy orders.
๐Ÿ”น As a result, price often struggles to move lower and may bounce or reverse upward.
๐Ÿ”น Demand zones are usually formed after a sharp rally, showing where big institutions or smart money entered the market.Image
Read 6 tweets
Sep 14
Top 10 Multiyear Breakout Stocks!๐Ÿš€๐Ÿš€

Ready for Blast.๐Ÿ’ฅ

๐…๐ซ๐ž๐ž ๐“๐ž๐ฅ๐ž๐ ๐ซ๐š๐ฆ!๐Ÿ‘‡


A Mega Thread.๐Ÿ“Š๐Ÿงต

1- JAYNECOIND t.me/financewithsunโ€ฆImage
2- GMDCLTD

CMP- 569 Image
3- RAMCOIND

CMP- 363 Image
Read 14 tweets
Jun 14
๐“๐จ๐ฉ ๐Ÿ“ ๐–๐ž๐ž๐ค๐ฅ๐ฒ ๐„๐– ๐’๐ญ๐จ๐œ๐ค๐ฌ!๐Ÿ“Š

A Mega Thread ๐Ÿงต๐Ÿ‘‡

(Bookmark it)๐ŸŽฏ

1-JUBLINGREA Image
2-360ONE Image
3-NAZARA Image
Read 7 tweets

Did Thread Reader help you today?

Support us! We are indie developers!


This site is made by just two indie developers on a laptop doing marketing, support and development! Read more about the story.

Become a Premium Member ($3/month or $30/year) and get exclusive features!

Become Premium

Don't want to be a Premium member but still want to support us?

Make a small donation by buying us coffee ($5) or help with server cost ($10)

Donate via Paypal

Or Donate anonymously using crypto!

Ethereum

0xfe58350B80634f60Fa6Dc149a72b4DFbc17D341E copy

Bitcoin

3ATGMxNzCUFzxpMCHL5sWSt4DVtS8UqXpi copy

Thank you for your support!

Follow Us!

:(