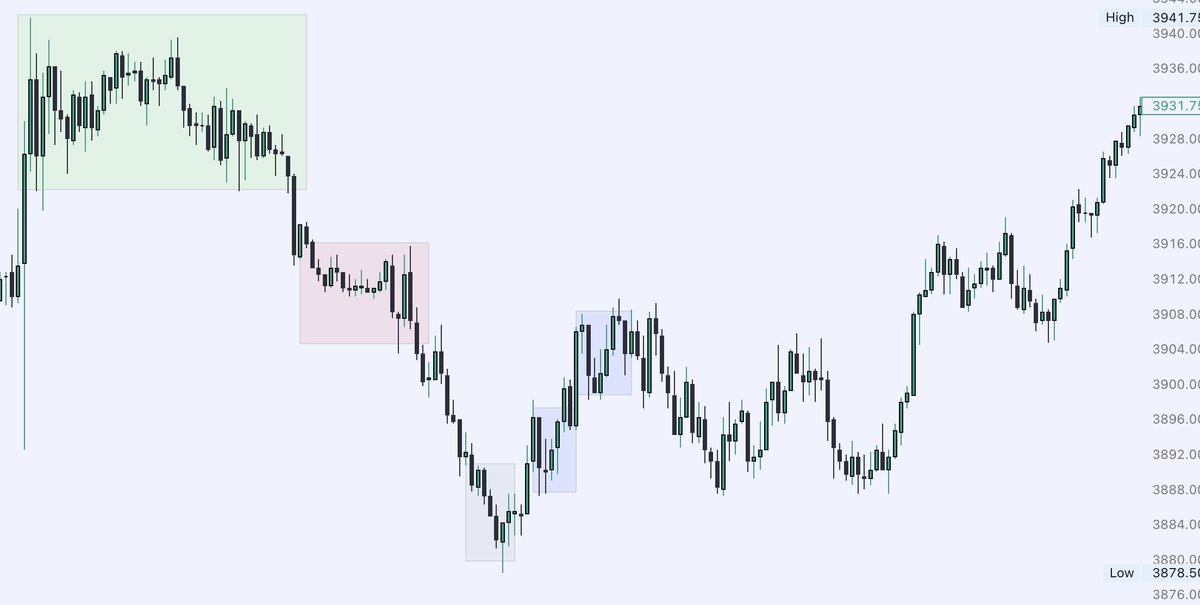
HOW TO FIND THE DRAW ON LIQUIDITY 🧲 #ICT
this mini thread will go over the key basics to understanding where the market is likely to go (1/3)
Key components to DOL
- Equal Highs (eqh)
- Support Levels
- Resistance levels
[ $ES 1H]
this mini thread will go over the key basics to understanding where the market is likely to go (1/3)
Key components to DOL
- Equal Highs (eqh)
- Support Levels
- Resistance levels
[ $ES 1H]

First off, for anyone new to ICT / SMC
the DOL is simply HTF highs & lows,
The first thing you should be asking your self before trading is "Where is the market drawing to"
take this for example 👇
Price takes the low & as you would expect, price began to reverse. (2/3)

the DOL is simply HTF highs & lows,
The first thing you should be asking your self before trading is "Where is the market drawing to"
take this for example 👇
Price takes the low & as you would expect, price began to reverse. (2/3)


Not always will price go from A - B
Usually a short term swing low / high or EQH / EQH will be created in the process
if you automatically assume your bullish after SSL gets taken you're most likely going to lose a trade

Usually a short term swing low / high or EQH / EQH will be created in the process
if you automatically assume your bullish after SSL gets taken you're most likely going to lose a trade


Your draw on liquidity doesn't even have to be a side of liquidity, it could be any imbalance like..
FVG, OB, VI, Liquidity Void
Chart below is $ES [Weekly]
FVG, OB, VI, Liquidity Void
Chart below is $ES [Weekly]

To summarize this thread:
Your main focus should be figuring out WHERE DOL rest and WHEN will we get there 😉
if you take enough notes you will notice there is specific times when price will rush towards the liquidity
FEEL FREE TO DM ME ANYTHING I ALWAYS READ IT
Your main focus should be figuring out WHERE DOL rest and WHEN will we get there 😉
if you take enough notes you will notice there is specific times when price will rush towards the liquidity
FEEL FREE TO DM ME ANYTHING I ALWAYS READ IT
FORGOT TO ADD
I do have a server for anyone to join! If you want more tips / questions JOIN
not the biggest server one of the best i promise you 🤞
discord.gg/QFmUz6ja3A

I do have a server for anyone to join! If you want more tips / questions JOIN
not the biggest server one of the best i promise you 🤞
discord.gg/QFmUz6ja3A


• • •
Missing some Tweet in this thread? You can try to
force a refresh

 Read on Twitter


