Game of Trades Profile picture
Apr 28 12 tweets 3 min read Twitter logo Read on Twitter
Speculators are extremely short on the SP500

Similar to 2020, 2015, 2011 and 2007

A short thread 🧵
2/ Net positioning in the futures market is often a good contrarian indicator

But there's a crucial caveat often overlooked by investors Image
3/ Bulls point out that high levels of net short positioning successfully predicted market bottoms in:

- 2020
- 2015
- 2011 Image
4/ However, similar net short levels also preceded the 2007 top

Which eventually led to the Financial Crisis Image
5/ Extreme short positioning isn't always a reliable contrarian indicator

The key difference lies in the monetary policy environment
6/ In 2011 and 2015, a steep 10y-2y yield curve signaled easy monetary policy

An accommodative Fed combined with net short positioning, marked market bottoms in both cases Image
7/ In 2020, massive stimulus flooded the system with liquidity

Which caught short positions off guard following C19
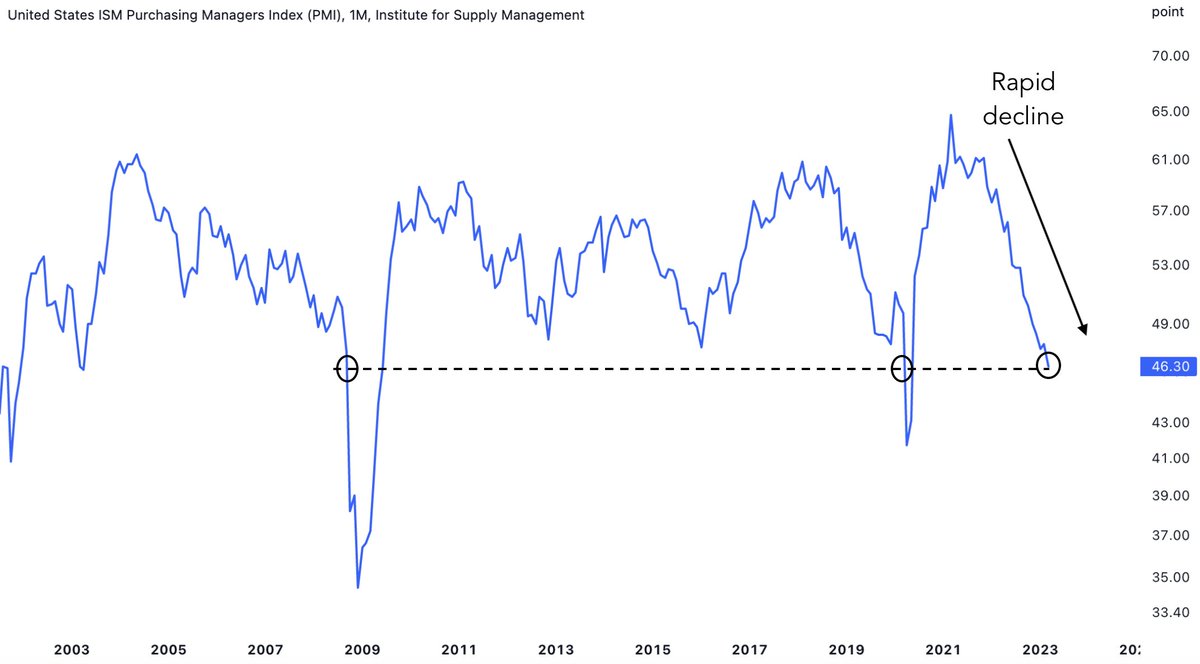
8/ In contrast, in 2007, the Fed was tightening monetary policy with rate hikes

Causing the 10y-2y yield curve to invert and leading to a recession and rapid market decline Image
9/ High net short positioning during easy monetary policy increases the likelihood of a market bottom

But when it occurs amid tight monetary policy, shorts often prove accurate
10/ Since 2022, the Fed has been aggressively hiking rates, and the 10y-2y yield curve is the most inverted since the 1980s

This suggests that speculators may be making the right call by going short Image
11/ Investors must consider the monetary policy context when interpreting net short positioning

As of now, the Fed's policy indicates that caution is warranted for those betting on a quick market rebound
12/ Thanks for reading!

If you found this thread valuable, please ❤️ and 🔁 the first tweet below

And follow @GameofTrades_ for more market insights, finance and investment strategies

• • •

Missing some Tweet in this thread? You can try to force a refresh
 

Keep Current with Game of Trades

Game of Trades Profile picture

Stay in touch and get notified when new unrolls are available from this author!

Read all threads

This Thread may be Removed Anytime!

PDF

Twitter may remove this content at anytime! Save it as PDF for later use!

Try unrolling a thread yourself!

how to unroll video
  1. Follow @ThreadReaderApp to mention us!

  2. From a Twitter thread mention us with a keyword "unroll"
@threadreaderapp unroll

Practice here first or read more on our help page!

More from @GameofTrades_

Apr 24
Tech insiders are offloading their stocks during this rally

A 🧵 on their track record and reason for selling
2/ The recent market rally has largely been fueled by the Technology sector (XLK) Image
3/ Apple, comprising over 7% of the S&P 500, has surged more than 35% since the beginning of 2023 Image
Read 13 tweets
Apr 21
Smart money is using this SP500 rally to go short

History shows they time the markets well

A thread 🧵
2/ "Smart money" refers to capital flows by experienced and well-informed individuals

They've timed major market tops and are now betting on the downside again

Let’s explore what this means for the market 👇 Image
3/ The put/call ratio is typically a good contrarian indicator

However, the OEX put/call ratio represents more sophisticated traders adept at timing the market

Extreme readings often coincide with market turning points
Read 15 tweets
Apr 19
Recently we’ve seen:

1. Largest outflow in bank deposits since 1970

2. Highest level of cash stored in Money Market Funds ever

3. Least attractive stock market relative to cash since 2000

A thread 🧵
2/ Bank deposits have been declining as investors are withdrawing their money from the banking system at an unprecedented rate

This has accelerated since SVB defaulted Image
3/ Despite SVB's collapse, the S&P 500 rose 10%, seemingly ignoring financial crisis risks

However, banking conditions continue to deteriorate Image
Read 15 tweets
Apr 17
US Manufacturing Activity is now contracting

80 years of data suggests that this is bad for stocks

A thread 🧵 Image
2/ ISM Manufacturing PMI – a widely used economic activity index

Came in below expectations last week at 46.3

We haven’t seen these levels since the US economy was shut down in 2020 and during the Financial Crisis in 2008 Image
3/ PMI Explained:

> 50 = Expansion in manufacturing

48 = Breakeven zone (stayed above this during 2009-2019 bull run)

< 48 = Contraction in manufacturing Image
Read 17 tweets
Apr 13
Bitcoin has risen by 50% following the collapse of Silicon Valley Bank

Many believe this means Bitcoin is a safe haven

It’s not

A thread 🧵
2/ Bitcoin sold off in full-blow risk-off mode when the bank run news broke

It surged once regulators guaranteed SVB's and Signature Bank's deposits

This hesitation in hedging bank run risks casts doubt on Bitcoin as a safe haven Image
3/ Bitcoin is vulnerable to recessionary risks like banking crises, as shown by its price action during the crisis

When regulators backstopped SVB, Bitcoin shifted focus to liquidity Image
Read 16 tweets
Apr 11
Since 1979, this signal has accurately predicted a rise in unemployment and a fall in the stock market

History suggests worse times ahead

A thread 🧵
2/ The market has been pricing in a Fed pivot

Investors expect stocks to melt up, anticipating an accommodative Fed

But it’s too late for a Fed pivot to prevent further economic decline
3/ Since SVB’s collapse, the 2-year minus 3-month Treasury yield saw its deepest inversion since the 1970s

Indicating that the bond market expects the Fed to ⬇️ rates in the next 2 years relative to current rates
Read 15 tweets

Did Thread Reader help you today?

Support us! We are indie developers!


This site is made by just two indie developers on a laptop doing marketing, support and development! Read more about the story.

Become a Premium Member ($3/month or $30/year) and get exclusive features!

Become Premium

Don't want to be a Premium member but still want to support us?

Make a small donation by buying us coffee ($5) or help with server cost ($10)

Donate via Paypal

Or Donate anonymously using crypto!

Ethereum

0xfe58350B80634f60Fa6Dc149a72b4DFbc17D341E copy

Bitcoin

3ATGMxNzCUFzxpMCHL5sWSt4DVtS8UqXpi copy

Thank you for your support!

Follow Us on Twitter!

:(