Just a remarkable jobs report on virtually all the metrics that should matter, especially if you look through the details. Gonna try to thread all my thoughts in one place this time around.
The Prime-Age 25-54 Employment Rate adjusts for 1) aging and 2) changes in participation.
It reached a new cyclical high, highest in 22yrs.
Biden has already seen 10 months at 80%+
For comparison:
Trump: 7 months
Obama: 0 months
GWB: 18 months
Clinton: 56 months
It reached a new cyclical high, highest in 22yrs.
Biden has already seen 10 months at 80%+
For comparison:
Trump: 7 months
Obama: 0 months
GWB: 18 months
Clinton: 56 months

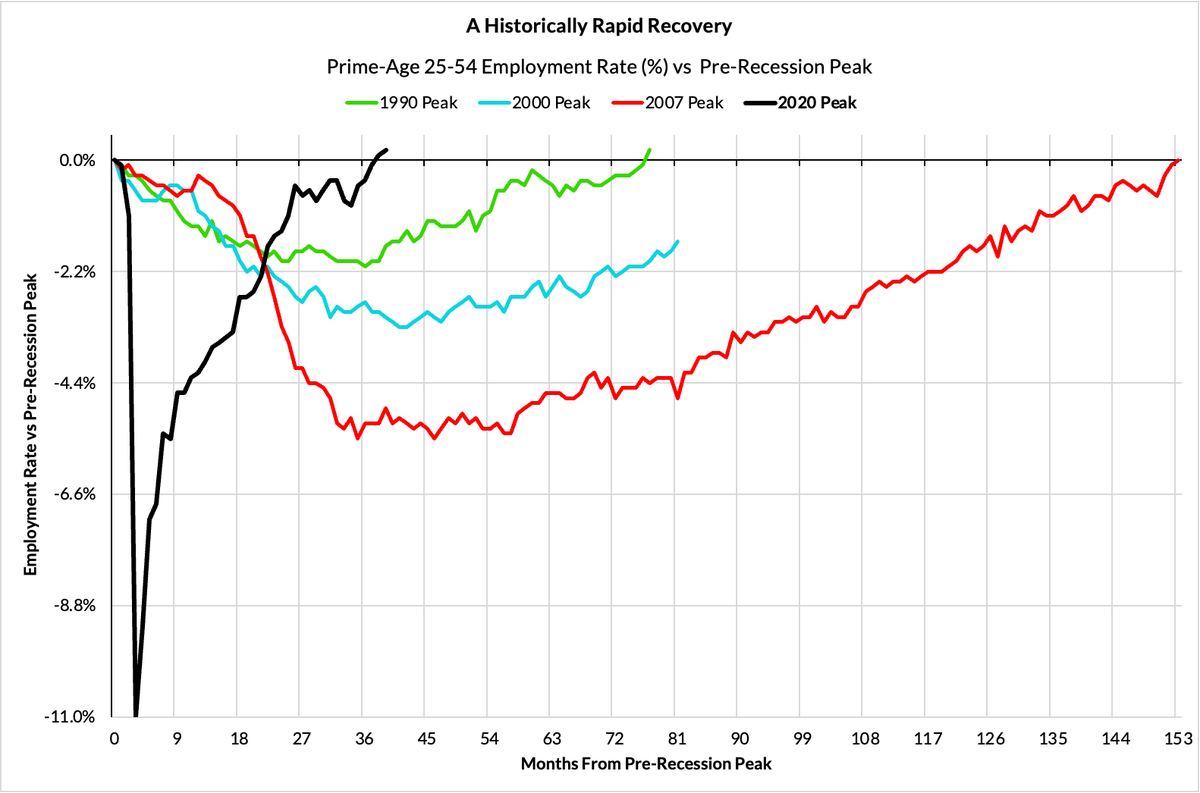
Given where the labor market was in the United States was in January 2021 (substantially deeper hole than most OECD countries, not as much low-hanging fruit)...
The scale of the prime-age employment recovery has been remarkable.
Blows every other recovery out the water
The scale of the prime-age employment recovery has been remarkable.
Blows every other recovery out the water
Folks who tell you that labor force participation (LFPR) is the critical variable need to take note:
Gains in age-adjusted participation coincide w/ (and are driven by) outright employment gains.
Prime-age LFPR made another historic high. We are not "running out of workers"
Gains in age-adjusted participation coincide w/ (and are driven by) outright employment gains.
Prime-age LFPR made another historic high. We are not "running out of workers"

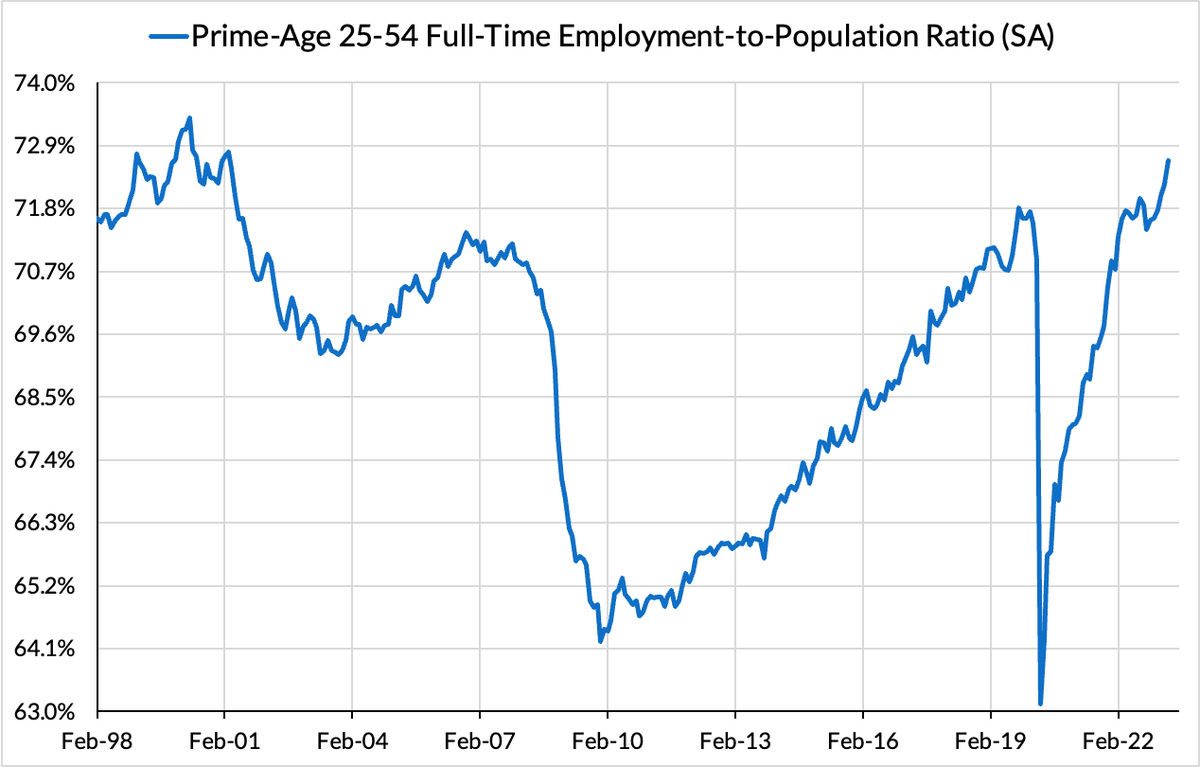
To the extent that we should disfavor part-time underemployment and favor full-time jobs, the quality of jobs in this recovery has also been strong.
Prime-age *FULL-TIME* employment rates made yet another high!
0.4% gain from 72.2% to 72.6%. Way better than last two decades.
Prime-age *FULL-TIME* employment rates made yet another high!
0.4% gain from 72.2% to 72.6%. Way better than last two decades.
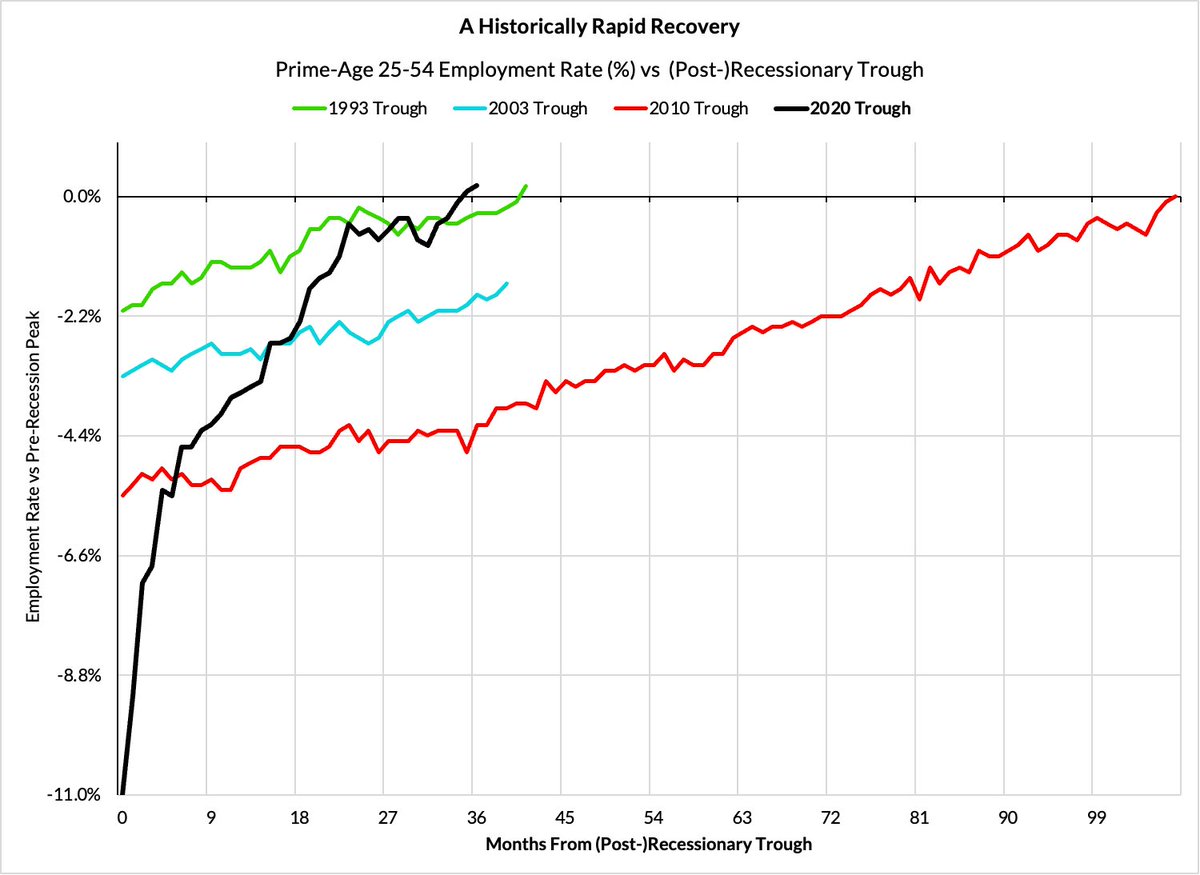
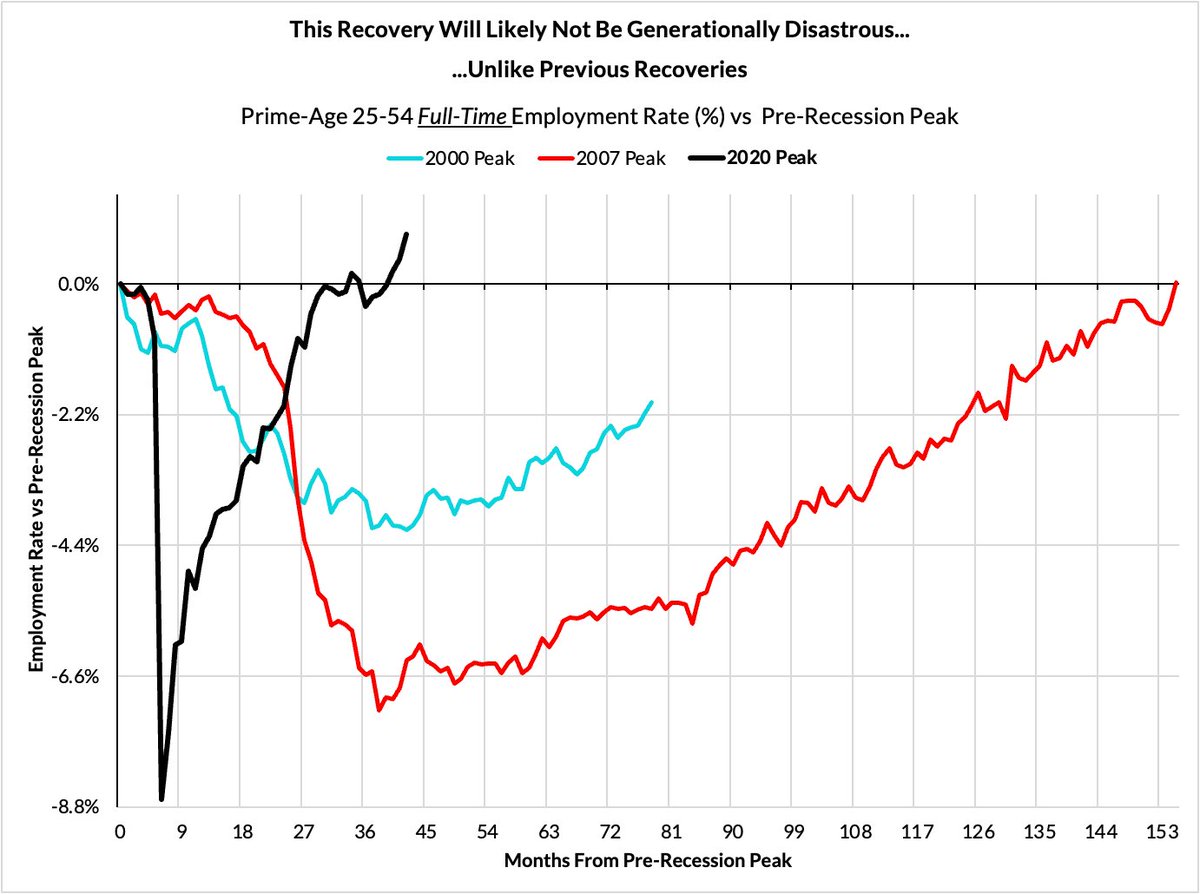
This recovery simply doesn't have the generationally disastrous qualities of the previous two recoveries.
The 2000s recovery was basically left incomplete.
The 2010s recovery took over a decade
The 2000s recovery was basically left incomplete.
The 2010s recovery took over a decade
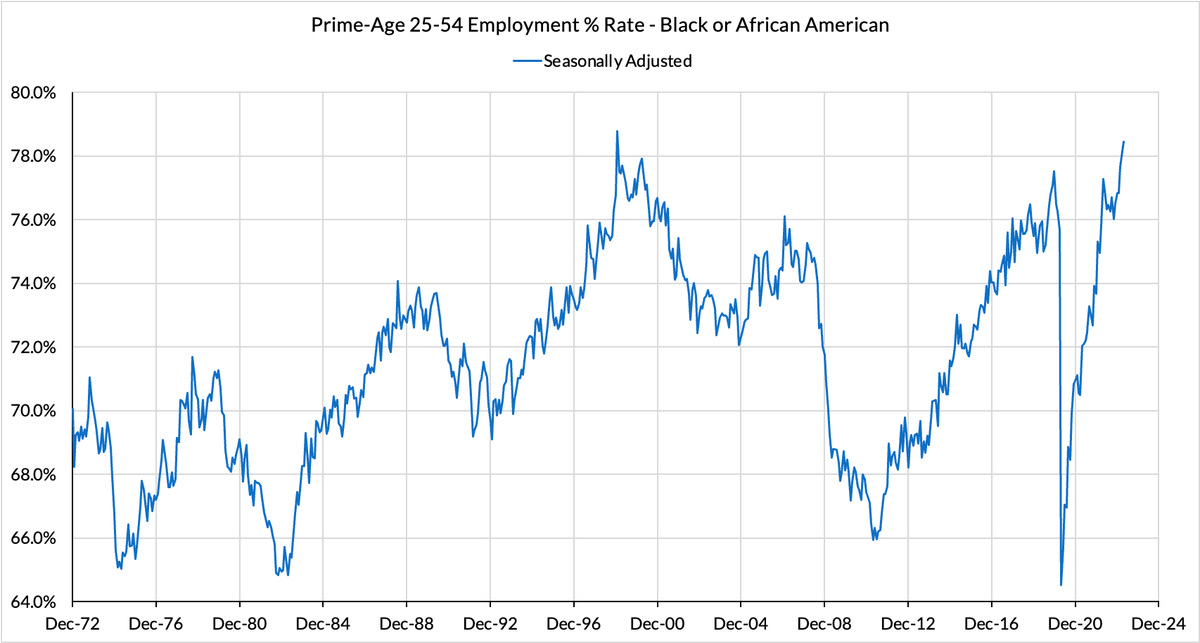
The prime-age employment rate among black and African American persons has been rocketing up, another 0.3% gain from March to April.
Now at 78.4%, just shy of its January 1999 high of 78.8%
So much about this recovery and expansion worth celebrating...*and defending*
Now at 78.4%, just shy of its January 1999 high of 78.8%
So much about this recovery and expansion worth celebrating...*and defending*
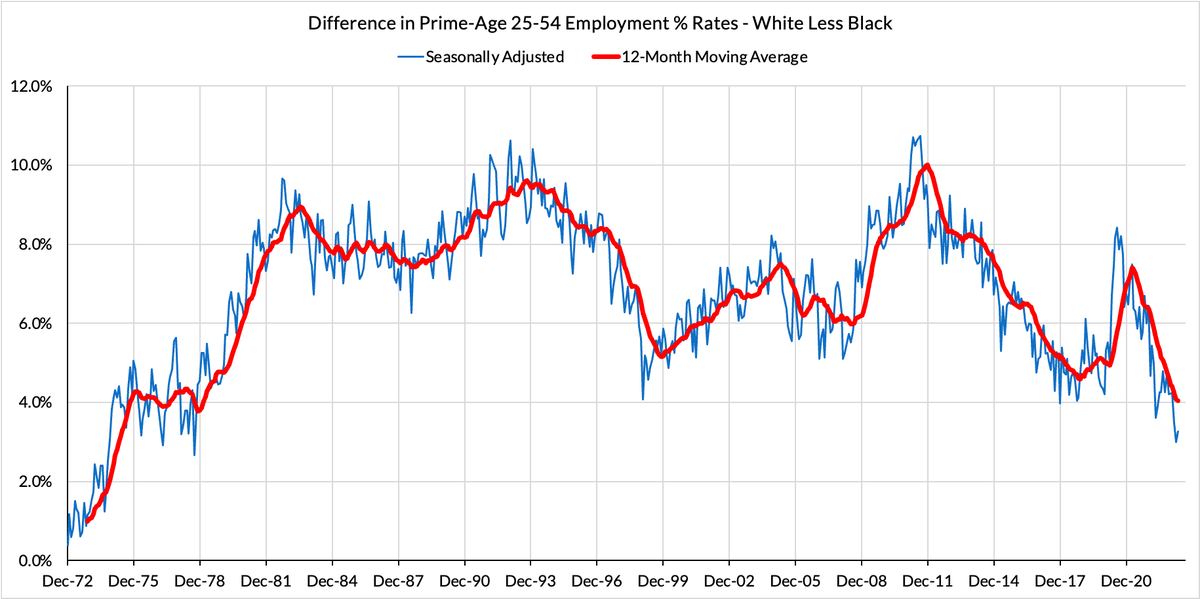
It's not as if employment gains among one group have come at the expense of other groups.
We are generally seeing a rising tide lift all groups, but especially powerful for those historically marginalized
Employment differentials keep narrowing, and are historically narrow
We are generally seeing a rising tide lift all groups, but especially powerful for those historically marginalized
Employment differentials keep narrowing, and are historically narrow
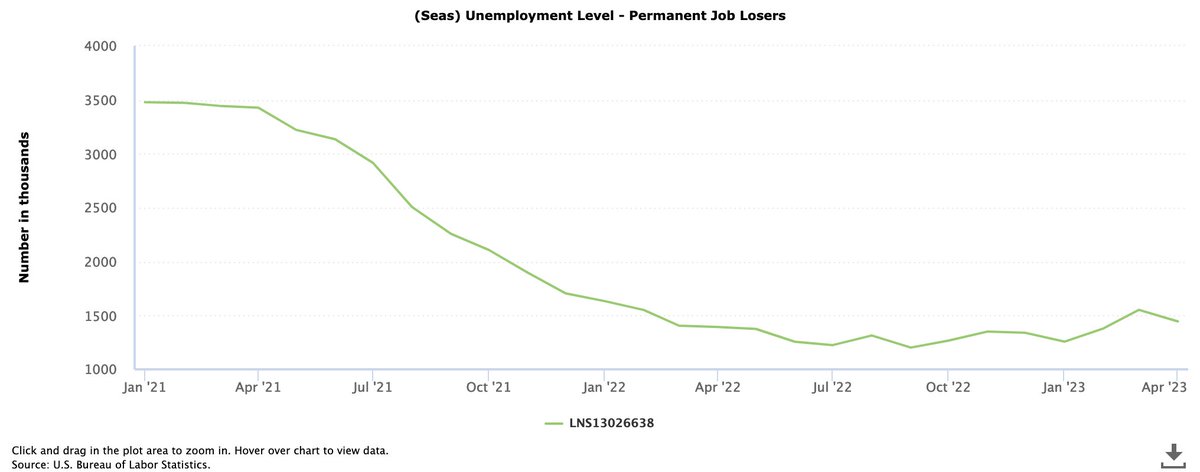
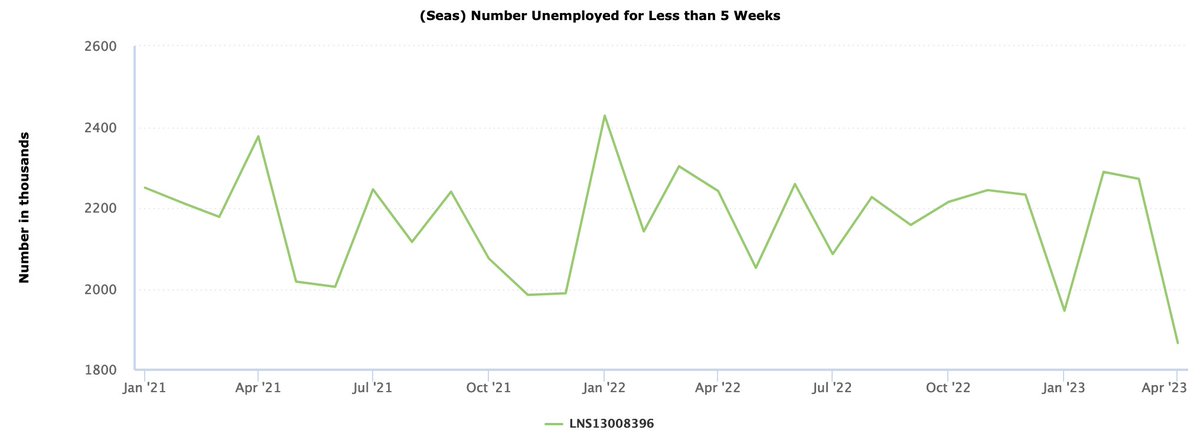
Coming into this report, biggest concern was in the "Permanent job losers" data that tracks layoff dynamics. (Job growth is about hiring vs layoffs)
The risk was rising layoffs might snowball, but permanent job losers fell in April, as did the # of people near-term unemployment
The risk was rising layoffs might snowball, but permanent job losers fell in April, as did the # of people near-term unemployment
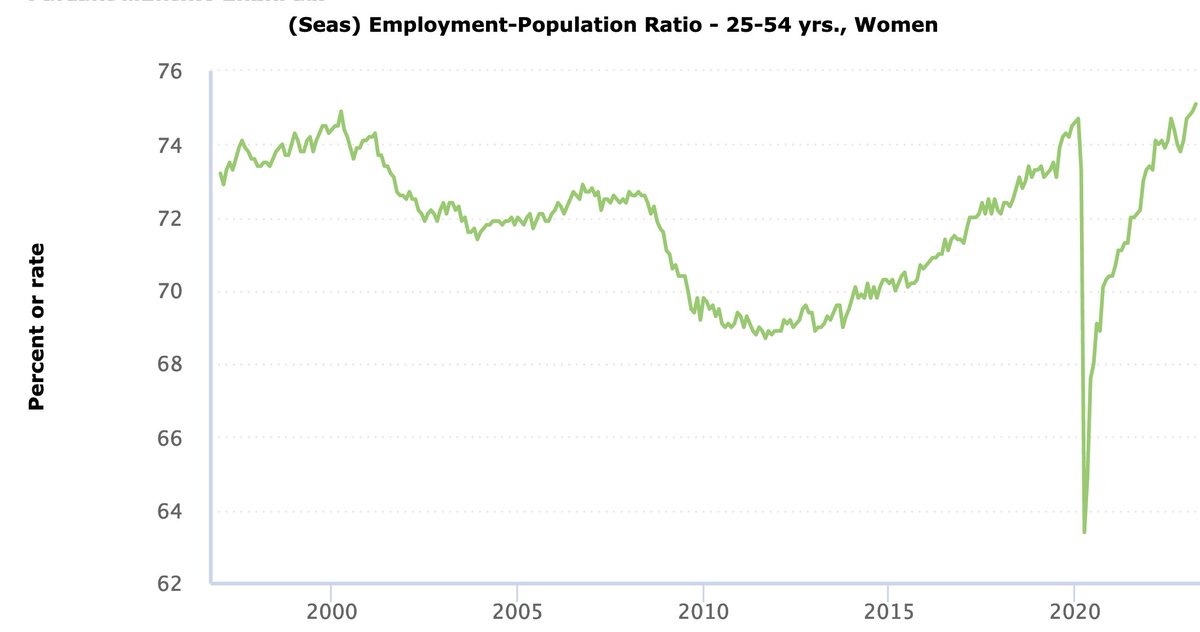
Prime-age 25-54 employment rate for women just cleared its April 2000 historical peak.
US remains a laggard vs advanced economies. Given likely household production incidence, need changes to both norms & policies to sustainably support further gains
academic.oup.com/sf/article/97/…
US remains a laggard vs advanced economies. Given likely household production incidence, need changes to both norms & policies to sustainably support further gains
academic.oup.com/sf/article/97/…
• • •
Missing some Tweet in this thread? You can try to
force a refresh