@LoganMohtashami has often talked about the structural decline in housing inventory that has been going on for quite some time. There are many arguments for why - too many landlords, STRs, population⬆️, etc.
🧵analyzing the DC Metro Real Estate using @AltosResearch Data.
🧵analyzing the DC Metro Real Estate using @AltosResearch Data.
The charts I will use mirror how @mikesimonsen shows national data. I call my report the "#Realtor and #LoanOfficer Misery Index" as I show new pending contracts compared to active inventory.
It is truly shocking the decrease in transactions on a weekly basis!
It is truly shocking the decrease in transactions on a weekly basis!
#MontgomeryCounty is a Maryland suburb just N of DC. I outline Active Inventory and New Pending Contracts using the same week in each measured year:
2023: 331/92
2021: 394/137
2020: 835/147
2019: 1,279/197
2018: 1,555/224
Inventory down 80%.
Contracts down 60%
2023: 331/92
2021: 394/137
2020: 835/147
2019: 1,279/197
2018: 1,555/224
Inventory down 80%.
Contracts down 60%

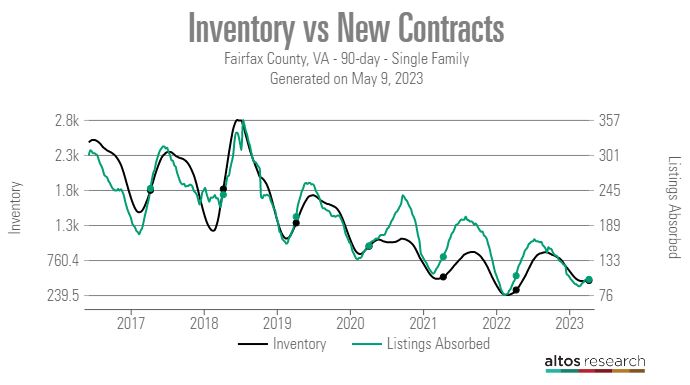
#FairfaxCounty is a Virginia suburb just W of DC.
2023: 456/102
2022: 315/107
2021: 509/138
2020: 985/160
2019: 1,366/218
2018: 1,946/243
Inventory down 76%.
Contracts down 58%
What is going on? It kind of looks like sellers aren't moving. I wonder why?
2023: 456/102
2022: 315/107
2021: 509/138
2020: 985/160
2019: 1,366/218
2018: 1,946/243
Inventory down 76%.
Contracts down 58%
What is going on? It kind of looks like sellers aren't moving. I wonder why?

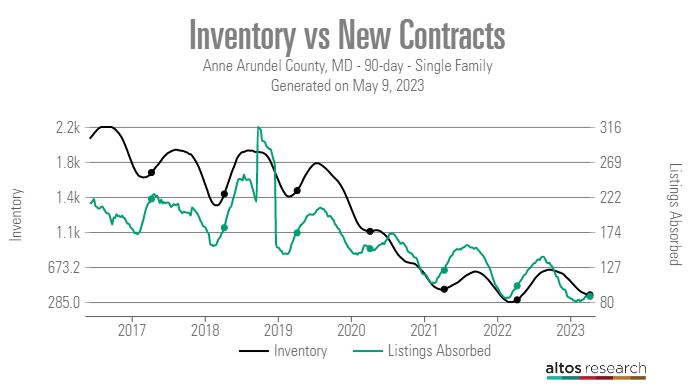
#AnneArundelCounty is a Maryland suburb 40 min E of DC.
2023: 365/88
2022: 309/102
2021: 427/123
2020: 1,070/152
2019: 1,520/173
2018: 1,483/180
Inventory down 75%.
Contracts down 51%
I'm noticing a pattern here...
2023: 365/88
2022: 309/102
2021: 427/123
2020: 1,070/152
2019: 1,520/173
2018: 1,483/180
Inventory down 75%.
Contracts down 51%
I'm noticing a pattern here...

Let's look at #DC. From 2016-2019, DC was on 🔥. LOs and #DMVRealtors posted insane #'s compared to their suburban peers. The competition was NUTS!
'23: 717/101
'22: 533/108
'21: 440/108
'20: 610/100
'19: 315/52
'18: 273/44
Inventory - ⬆️260%
Contracts - ⬆️ 230%
'23: 717/101
'22: 533/108
'21: 440/108
'20: 610/100
'19: 315/52
'18: 273/44
Inventory - ⬆️260%
Contracts - ⬆️ 230%

What about the DC #COndo market?
'23: 756/96
'22 – 876/127
'21 – 1,053/134
'20 – 619/87
'19 – 976/184
'18 – 1,107/181
Inventory - ⬇️32%
Contracts - ⬇️47%
'23: 756/96
'22 – 876/127
'21 – 1,053/134
'20 – 619/87
'19 – 976/184
'18 – 1,107/181
Inventory - ⬇️32%
Contracts - ⬇️47%

Data can tell compelling stories. For the #DMV area, it shows Covid stung the condo market. I believe ⬇️in inventory is a result of developers lack of investment in new units due to the Covid+WFH environment.
Those who wanted to stay in the city look to have become SFR Buyers.
Those who wanted to stay in the city look to have become SFR Buyers.
The suburbs of DC show inventory net unit decrease of 3,829 units along with 365 fewer new contracts.
This is why pricing is staying firm. Supply vs Demand is at play. Sellers are not in destress. Many also can't afford to move due to rates and affordability.
This is why pricing is staying firm. Supply vs Demand is at play. Sellers are not in destress. Many also can't afford to move due to rates and affordability.
This may end up being the healthiest, unhealthy market ever. As I drive around, I do not see much new construction either. This is part due to the lack of land and other lack of investment from developers/flippers due to economic risk and uncertainty.
From a recent survey with my clients, the rate that unlocks inventory appears to be around 5%. To me, this makes sense as when I run debt ratio analysis for these clients, their raises + current prices + rolling equity to the new home = similar debt ratios as 2019.
I'm curious to hear your thoughts on this analysis! There is no shortage of bears analyzing housing right now; I'm sure the argument exists in many sub-markets nationwide. I'm just not seeing it for the DC Metro region!
• • •
Missing some Tweet in this thread? You can try to
force a refresh

 Read on Twitter


