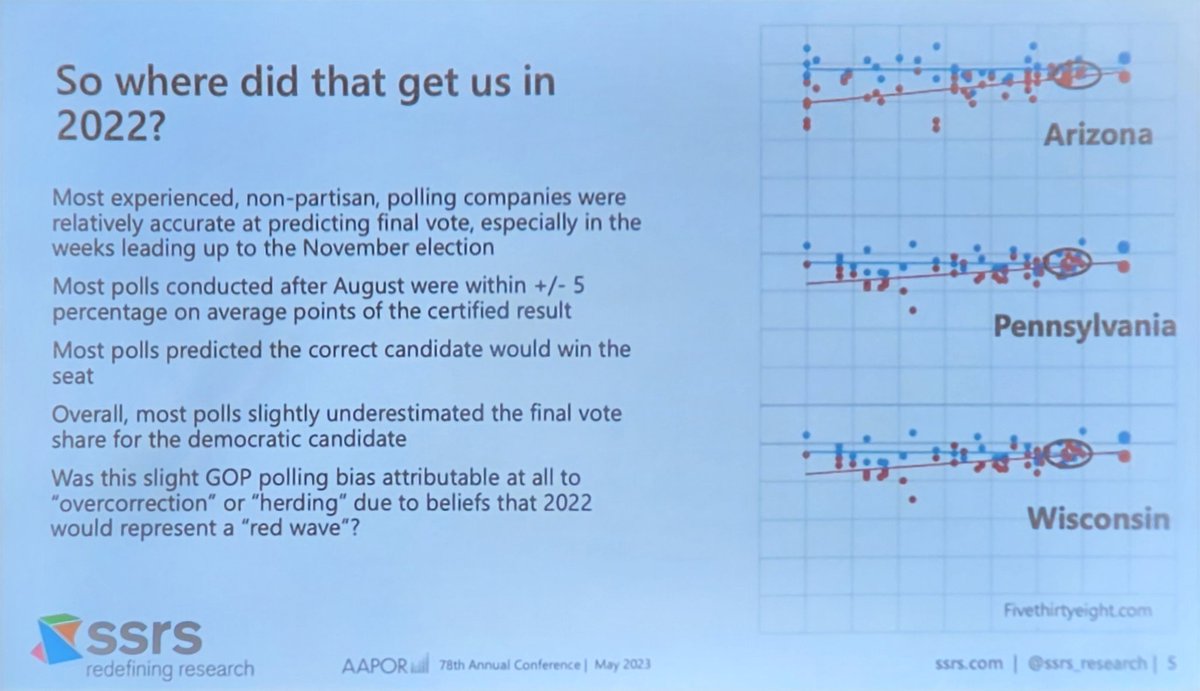
Tweeting now session "Come In and Stay a While: Recruiting and Measuring Attrition" at #AAPOR
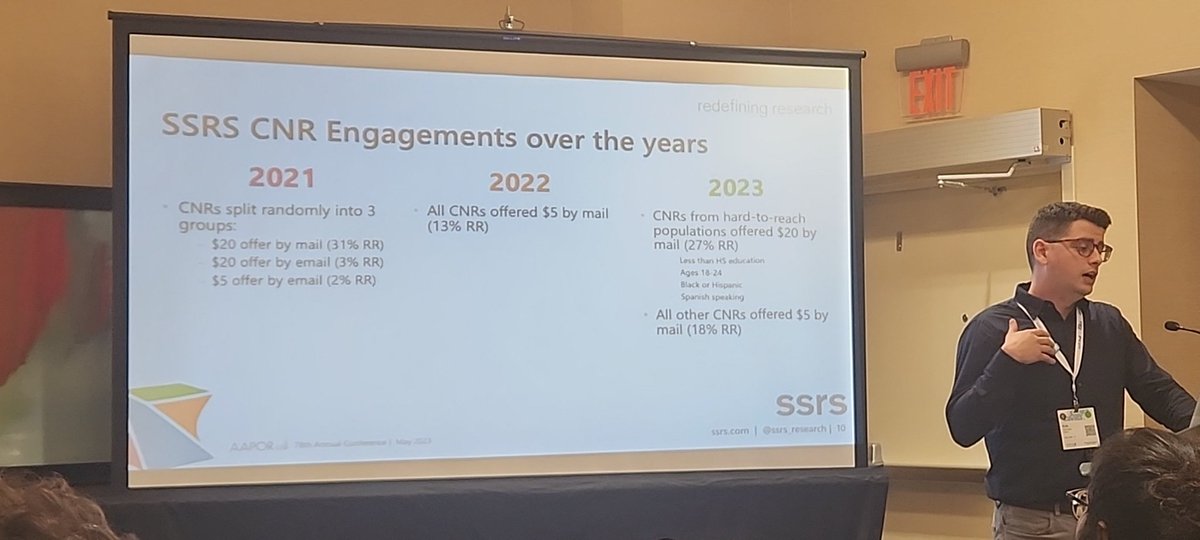
Defining chronic nonrespondents -- people who have not responded the survey after at least six invitation. 

Principals of re-engaging chronic nonrespondents
High-incentive: up to $20
Promise of short "5 questions survey"
Last chance to continue to be part of the panel
High-incentive: up to $20
Promise of short "5 questions survey"
Last chance to continue to be part of the panel
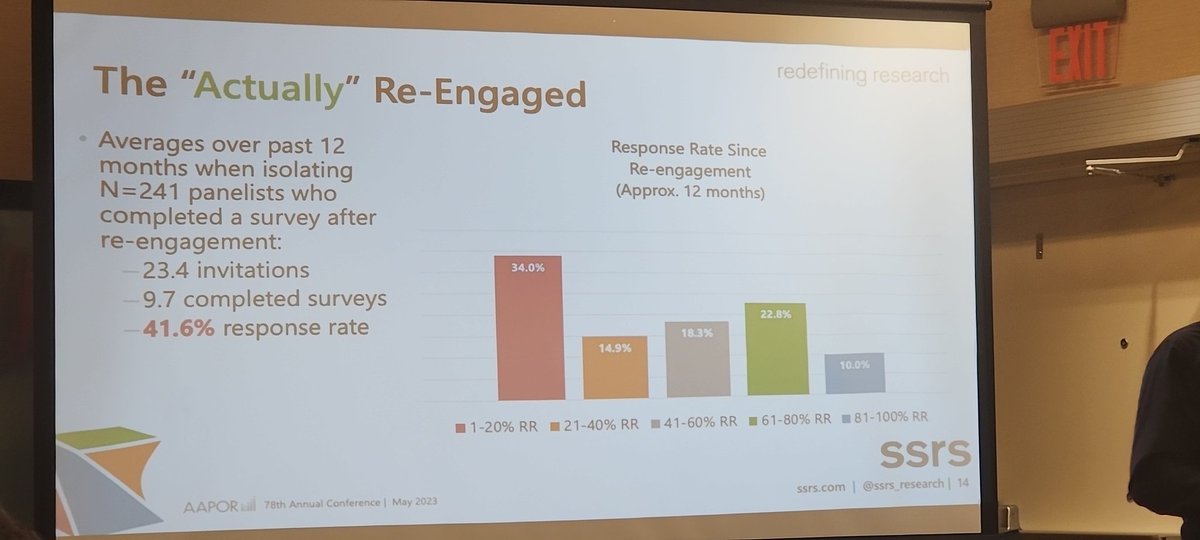
How to track chronic nonrespondents?
Do they actually continuing answering the survey or do they drop (hit-and-run)
Do they actually continuing answering the survey or do they drop (hit-and-run)

55.3% completed 1 or more surveys after re-engagements.
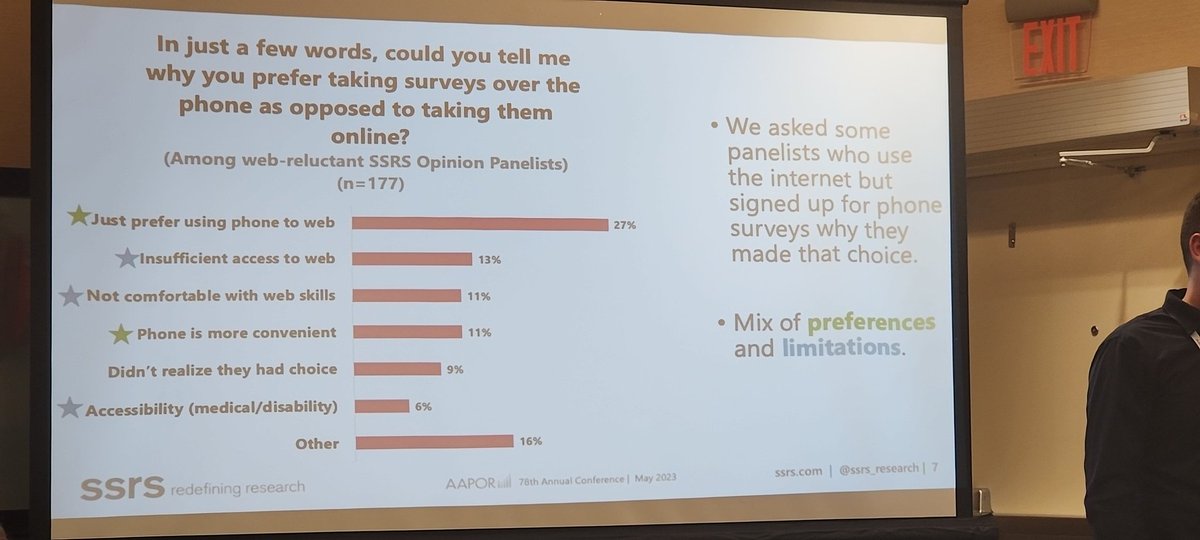
Kyle continues the session to compare non-internet and web-reluctant panelists. Some concerns regarding under-coverage here. 

Multi-mode vs Internet enabling approach
Pros and Cons with each approach:
Internet enabling is expensive at front cost, but cheaper later
Multi-mode allows respondents yo answer on their mode of preference, but measure error differences.
Pros and Cons with each approach:
Internet enabling is expensive at front cost, but cheaper later
Multi-mode allows respondents yo answer on their mode of preference, but measure error differences.
66% of the phone panelists says they prefer to continue taking the survey over the phone
54% for web-relunctant
91% for non-internet
54% for web-relunctant
91% for non-internet
Non-internet panelists are older and less educated than web-relunctant panelists
Summary/Take-aways
Non-internet users are different than web-relunctant users
Choice of mode allows to panelists answer the survey on the mode of their choice and capture non-internet users
Non-internet users are different than web-relunctant users
Choice of mode allows to panelists answer the survey on the mode of their choice and capture non-internet users
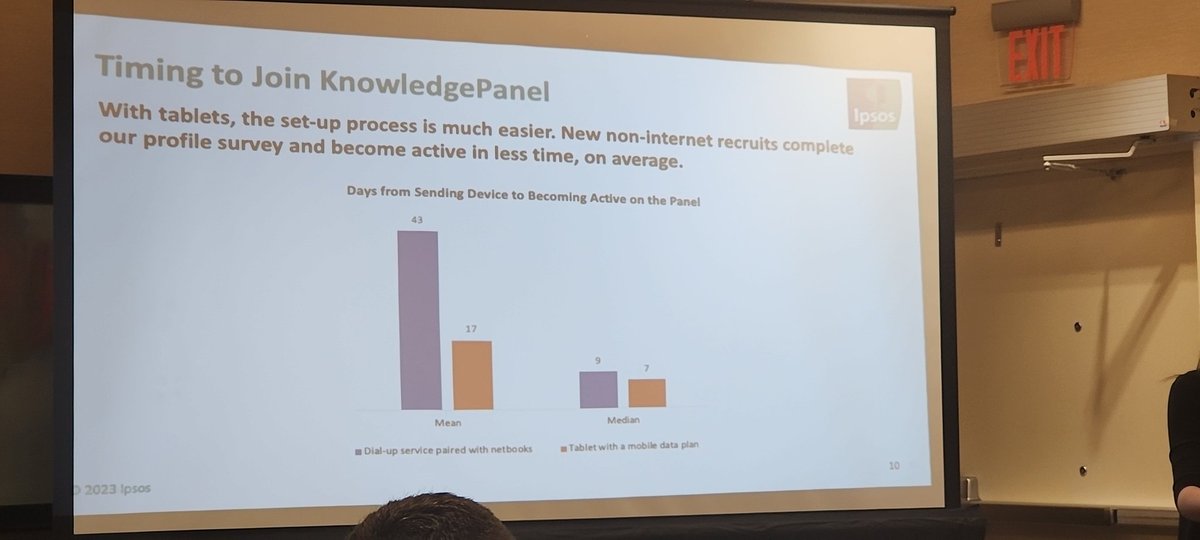
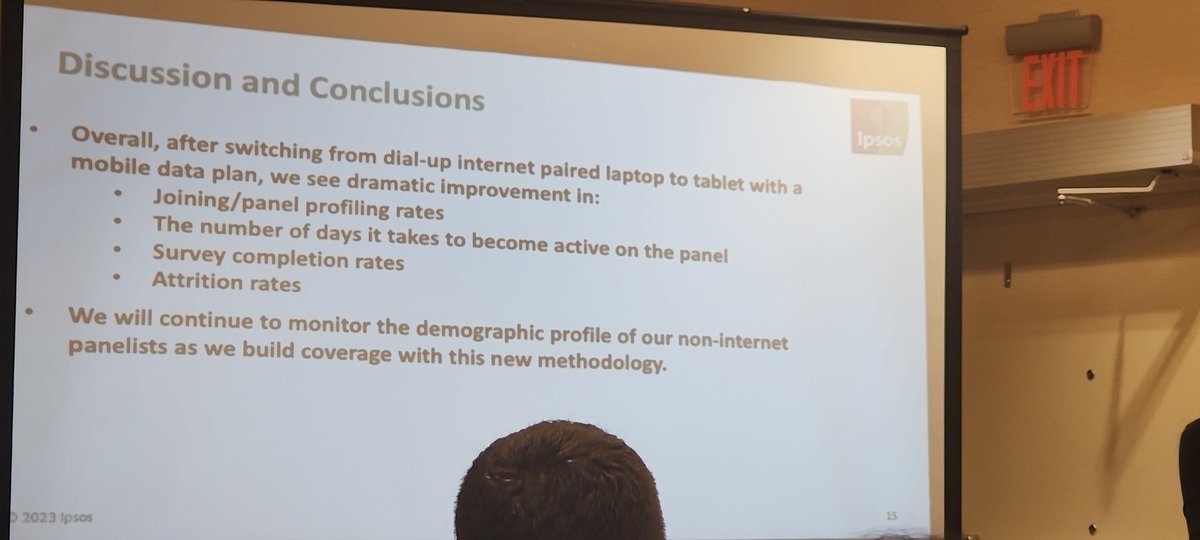
Next is Fei He (Ipsos) talking about innovations in recruiting non-internte households in KnowldgePanel 

6% adults in the US don't have internet at home. They then to ve older, less educated, low-income and Hispanic.
KnowledgePanel recruitment by a mail sample recruitment with a pre-paid incentive.
For the non-internet panelists, they are provided internet.
Older methodology: Dial-up service with notebooks
Nee methodology: Tablet with a mobile plan
For the non-internet panelists, they are provided internet.
Older methodology: Dial-up service with notebooks
Nee methodology: Tablet with a mobile plan
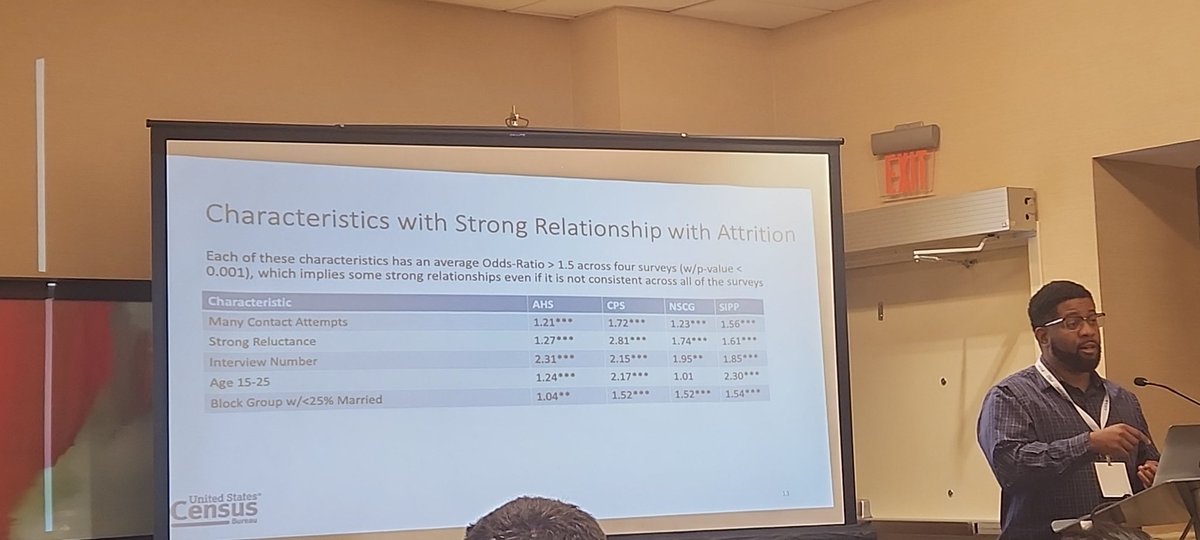
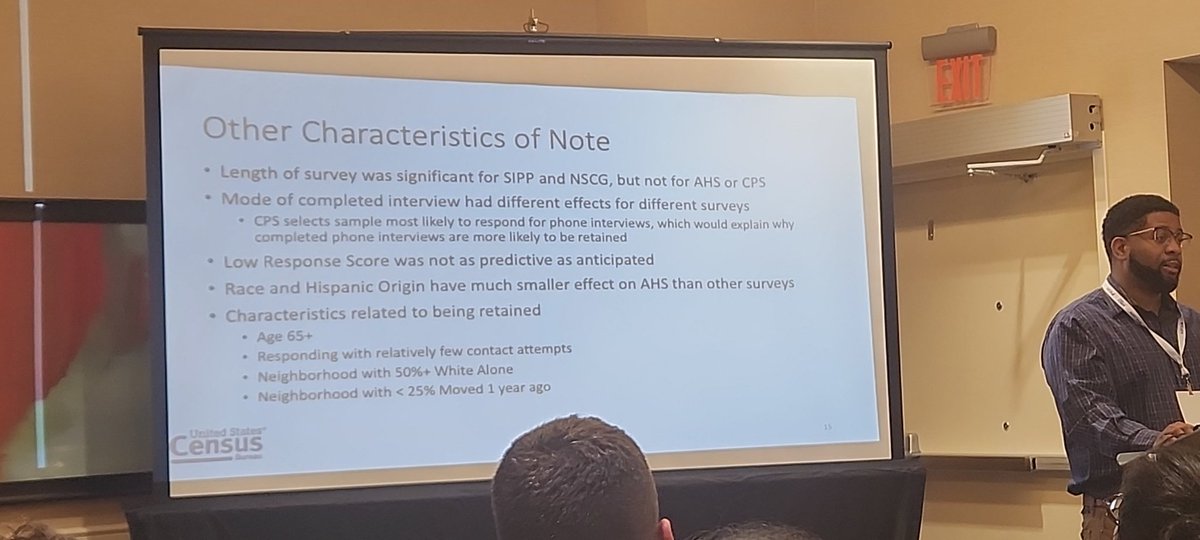
Next is Kevin Tolliver (US Census Bureau) talk about identifying key factors that lead to attrition in US Census Bureau demographic surveys 
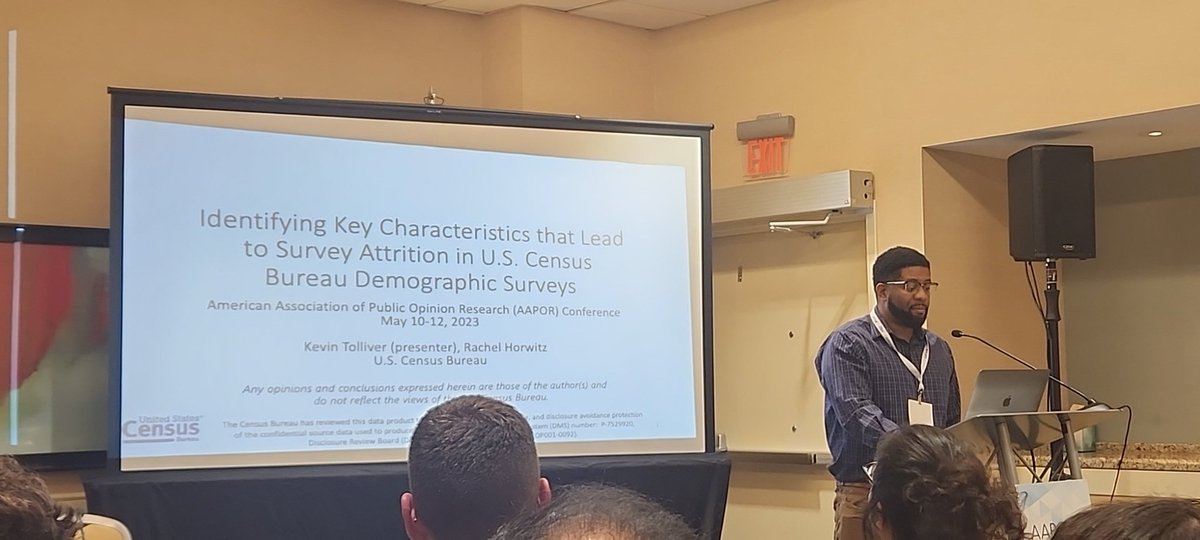
Analyzed the following surveys:
American Household Survey (AHS)
Current Population Survey (CPS)
National Survey of College Graduates (NSCG)
Survey of Income Program Participation (SIPP)
Four very different surveys!
American Household Survey (AHS)
Current Population Survey (CPS)
National Survey of College Graduates (NSCG)
Survey of Income Program Participation (SIPP)
Four very different surveys!
Tested various characteristics relation to attrition with Wald Chi-square test and corresponding odds ratio
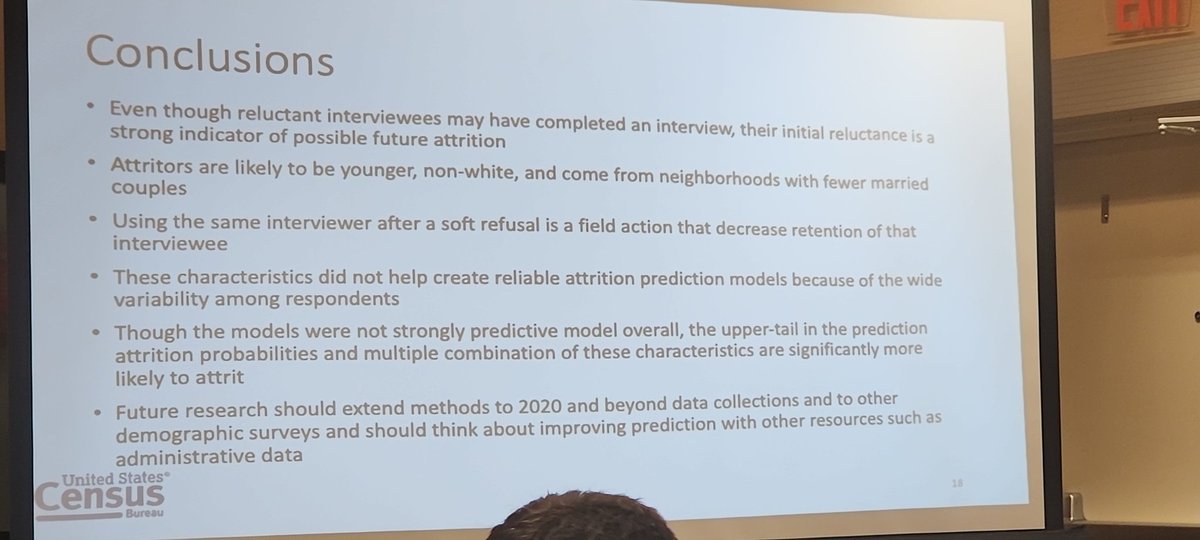
Based on these results, built attrition prediction models.
Objective is to predict attrition in one survey based on data of other survey
Objective is to predict attrition in one survey based on data of other survey
Then, these prediction models can be used to identify specific groups that have higher attrition propensity
Attrition prediction models were all not great 😭
And that's a wrap for this session
/TheEnd
/TheEnd
@threadreaderapp compile unroll thread
• • •
Missing some Tweet in this thread? You can try to
force a refresh


