🚧WRONG WAY🚧
No more excuses!
Read the whole thread to understand how CCSD has been driving #NVed in the WRONG direction
We'll review where we've come from and how we've gotten all turned around
- New national data
- Updated teacher exodus data
And More!
1/?
#Nved #NVLeg
No more excuses!
Read the whole thread to understand how CCSD has been driving #NVed in the WRONG direction
We'll review where we've come from and how we've gotten all turned around
- New national data
- Updated teacher exodus data
And More!
1/?
#Nved #NVLeg

2/?
This morning’s NY Times referenced data from The Educational Opportunity Project
They've charted the change in average reading scores since the pandemic
Each dot is a school district
Higher dot, reading performance improved.
Lower dot, reading performance worsened.
This morning’s NY Times referenced data from The Educational Opportunity Project
They've charted the change in average reading scores since the pandemic
Each dot is a school district
Higher dot, reading performance improved.
Lower dot, reading performance worsened.

3/?
The highlighted bubbles represent the 10 largest districts in the US (NY did not have data)
Higher bubbles = Students have done better in reading since the pandemic
Lower bubbles = Students have done worse in reading since the pandemic
Guess which one is Clark County…
The highlighted bubbles represent the 10 largest districts in the US (NY did not have data)
Higher bubbles = Students have done better in reading since the pandemic
Lower bubbles = Students have done worse in reading since the pandemic
Guess which one is Clark County…

4/?
Reading performance in CCSD has dropped by almost half a grade level since the pandemic
OVER DOUBLE the drop experienced by the next lowest district
Has it always been like this?
OR
Should the Board open its eyes to how disastrous this leadership has been for our students
Reading performance in CCSD has dropped by almost half a grade level since the pandemic
OVER DOUBLE the drop experienced by the next lowest district
Has it always been like this?
OR
Should the Board open its eyes to how disastrous this leadership has been for our students

5/?
Were we ever headed in the right direction???
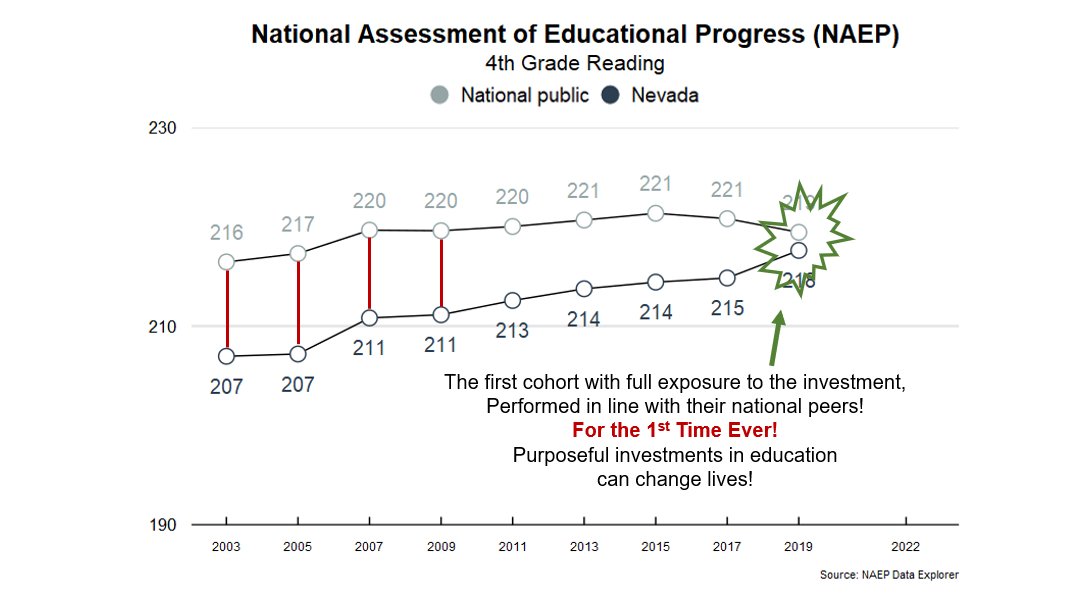
In the early 2000’s Nevada’s 4th graders were consistently performing about a year behind their national peers in 4th-grade reading.
But then…
Were we ever headed in the right direction???
In the early 2000’s Nevada’s 4th graders were consistently performing about a year behind their national peers in 4th-grade reading.
But then…

6/?
Nevada made massive investments in early literacy.
In 2019, Nevada’s 4th graders who had exposure to those investments from Kindergarten through 4th grade took the National Assessment of Educational Progress.
So, what happened….
#ThankALegislator #NVleg
Nevada made massive investments in early literacy.
In 2019, Nevada’s 4th graders who had exposure to those investments from Kindergarten through 4th grade took the National Assessment of Educational Progress.
So, what happened….
#ThankALegislator #NVleg

7/?
Wow!
In 2019, for the 1st time ever, Nevada’s 4th graders performed in line with their national peers
From 2009-2019, only 3 states in the US made more progress than Nevada
Our teachers, our administrators, and our community did that.
What do they all have to say now…
Wow!
In 2019, for the 1st time ever, Nevada’s 4th graders performed in line with their national peers
From 2009-2019, only 3 states in the US made more progress than Nevada
Our teachers, our administrators, and our community did that.
What do they all have to say now…
8/?
The teachers who improved early literacy outcomes and closed gaps with the national average have NO CONFIDENCE in the Superintendent.
The teachers who improved early literacy outcomes and closed gaps with the national average have NO CONFIDENCE in the Superintendent.

9/?
The principals who improved early literacy outcomes and closed gaps with the national average have NO CONFIDENCE in the Superintendent. #NVed #NVleg
The principals who improved early literacy outcomes and closed gaps with the national average have NO CONFIDENCE in the Superintendent. #NVed #NVleg

10/?
The business community that supported the massive investments in early literacy that closed national gaps has NO CONFIDENCE in the Clark County School District.
The business community that supported the massive investments in early literacy that closed national gaps has NO CONFIDENCE in the Clark County School District.

11/?
Just how disastrous has the leadership of the Clark County School District been?
Let’s look….
Just how disastrous has the leadership of the Clark County School District been?
Let’s look….

12/?
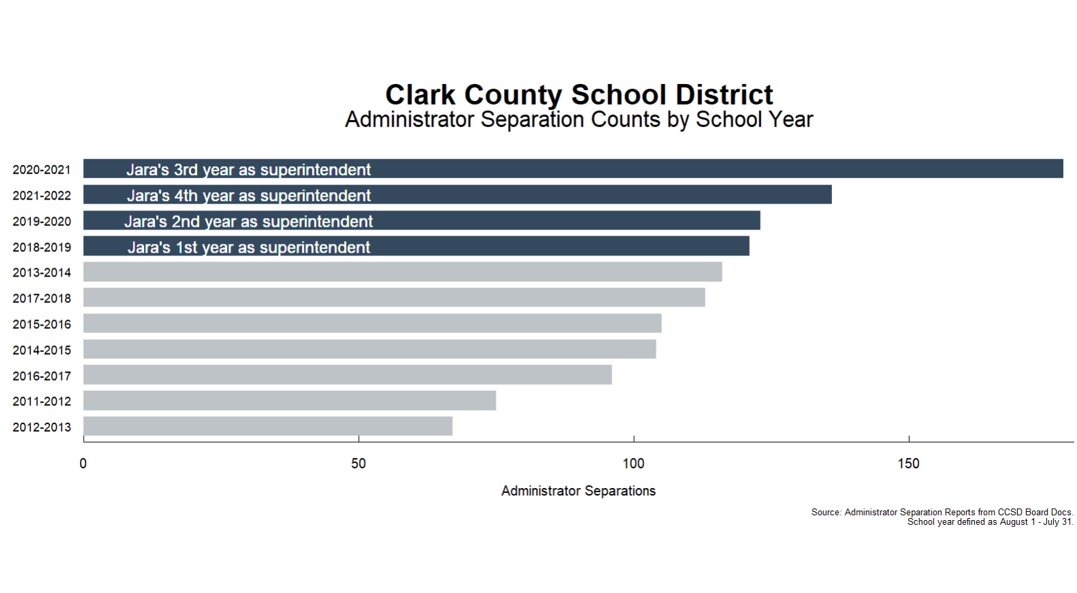
At the height of the pandemic, CCSD made the biggest blunder in education history
They PAID admin to retire early resulting in the largest exodus of administrators EVER
When needed most CCSD lost:
- Top Performing Principals
- Head of Transportation
- Head of Technology
At the height of the pandemic, CCSD made the biggest blunder in education history
They PAID admin to retire early resulting in the largest exodus of administrators EVER
When needed most CCSD lost:
- Top Performing Principals
- Head of Transportation
- Head of Technology
13/?
Last year, CCSD saw the largest exodus of teachers EVER
And this does not include all the teachers that moved to fill in all the vacant administrator positions.
Last year, CCSD saw the largest exodus of teachers EVER
And this does not include all the teachers that moved to fill in all the vacant administrator positions.

14/?
This year’s teacher exodus is second only to last year’s unprecedented disaster
Just how bad is it this year?
There’s a bigger difference between this year & the next highest year than there is between the next highest year & the lowest year
#ContinuedDisaster
This year’s teacher exodus is second only to last year’s unprecedented disaster
Just how bad is it this year?
There’s a bigger difference between this year & the next highest year than there is between the next highest year & the lowest year
#ContinuedDisaster

15/?
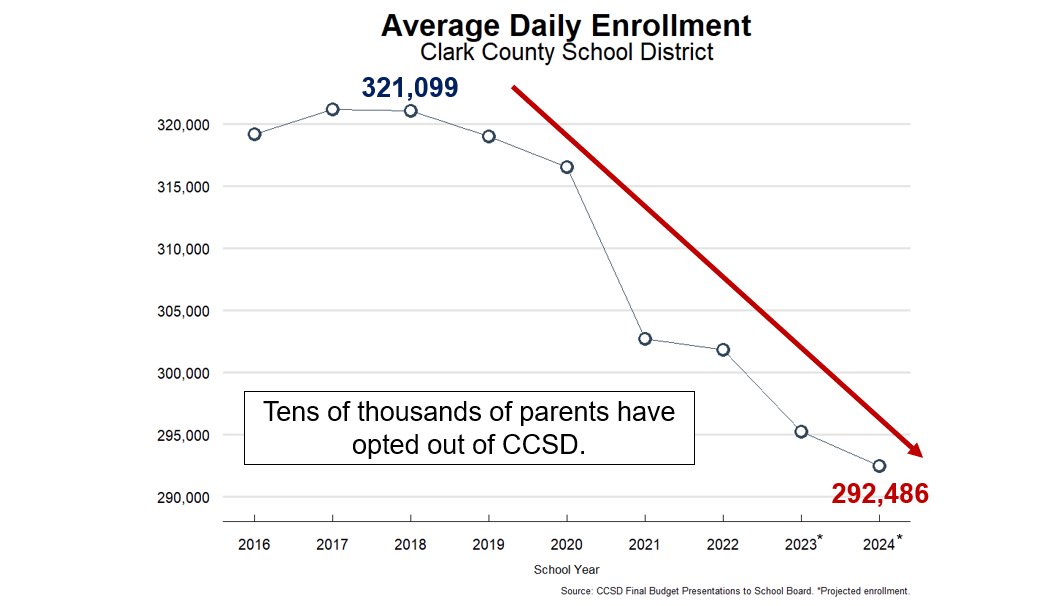
Tens of thousands of parents have opted out of CCSD for their children
This is happening while the school-aged population of Clark County CONTINUES TO GROW!!!
That’s right, there are MORE school-aged children in Clark County. We are growing. The District is NOT.
Tens of thousands of parents have opted out of CCSD for their children
This is happening while the school-aged population of Clark County CONTINUES TO GROW!!!
That’s right, there are MORE school-aged children in Clark County. We are growing. The District is NOT.
16/?
What has happened to early literacy since Nevada’s teachers, principals, and community closed seemingly insurmountable gaps for our students?
#NVed #NVleg
What has happened to early literacy since Nevada’s teachers, principals, and community closed seemingly insurmountable gaps for our students?
#NVed #NVleg

17/?
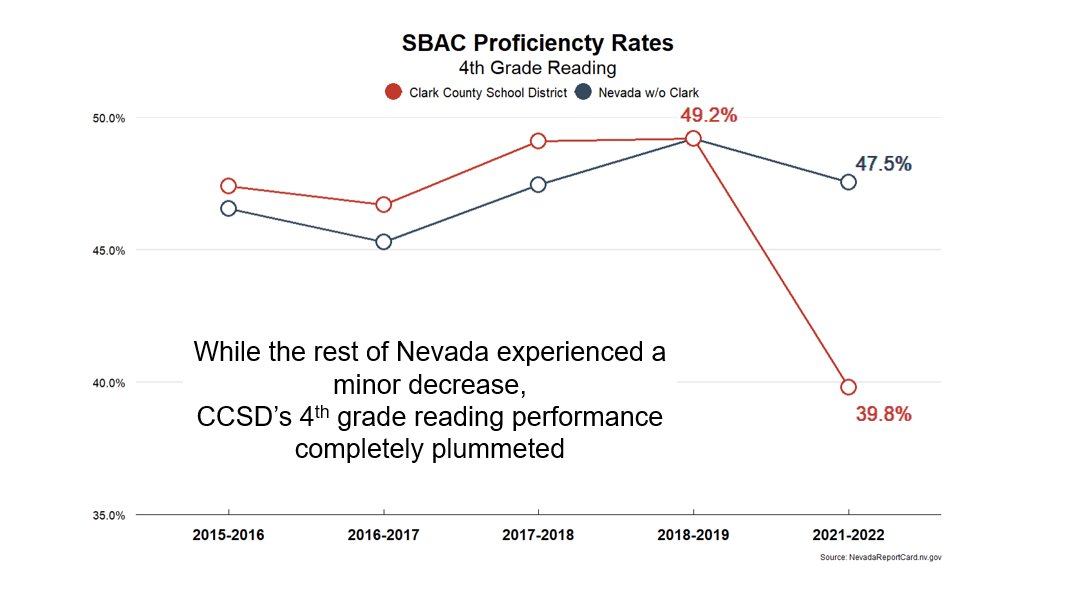
While the rest of Nevada experienced a minor decrease,
CCSD’s 4th-grade reading performance completely plummeted.
CCSD went from outperforming the rest of NV to significantly below the rest of the state.
While the rest of Nevada experienced a minor decrease,
CCSD’s 4th-grade reading performance completely plummeted.
CCSD went from outperforming the rest of NV to significantly below the rest of the state.
18/18
All we hear from CCSD leadership & the School Board are excuses
Blame the community
Blame the principals
Blame the teachers
Those being blamed have proven they can do right by students
We need leadership with solutions not excuses
#WhoWillStepUp
All we hear from CCSD leadership & the School Board are excuses
Blame the community
Blame the principals
Blame the teachers
Those being blamed have proven they can do right by students
We need leadership with solutions not excuses
#WhoWillStepUp

• • •
Missing some Tweet in this thread? You can try to
force a refresh