Live tweeting Methods and Election Polling at #AAPOR here
First is Mike Witherly presenting The Effect of Random Ballot Order in the 2018 and 2022 City of Vancouver Municipal Elections 

Vancouver municipal elections:
Rare instance of down ballot races
Rare instance of down ballot races
Viva Vancouver: "Random" ballots introduced in 2018 -- appear on the ballot by drawing lots
Reduce ABCD bias: alphabetical order would have a particular negative effect whose last name is Southeast Asian or Latino
Reduce ABCD bias: alphabetical order would have a particular negative effect whose last name is Southeast Asian or Latino

RQ:
Did randomized ballot matter?
Did candidate ethnicity matter?
Did randomized ballot matter?
Did candidate ethnicity matter?
In didn't matter in 2018, it had a very minor impact in 2022


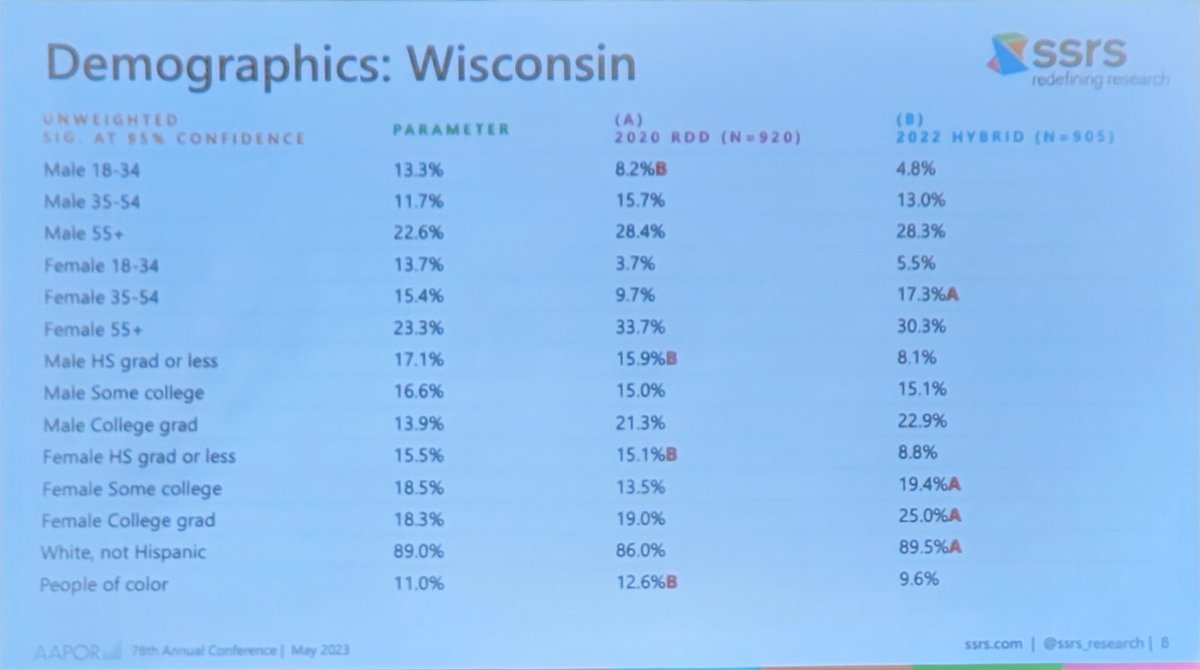
Next is Jennifer Su (SSRS) talking about Emailing Registered Voters: Effectiveness and Sample Representation in Pre-Election State Polling

RDD vs. Hybrid Mixed Mode
CNN/SSRS polls:
Focus in MI, PA, WI
2020: RDD
2022: SSRS Opinion Panel + RBS (Aristotle)
CNN/SSRS polls:
Focus in MI, PA, WI
2020: RDD
2022: SSRS Opinion Panel + RBS (Aristotle)
Demographic distribution

RBS design and contact protocols:
* 9 strata per state based on presence of email, phone number or both
* Undercoverage in RBS covered by inclusion SSRS Opion Panel (national probability-based panel recruited by ABS)
* 9 strata per state based on presence of email, phone number or both
* Undercoverage in RBS covered by inclusion SSRS Opion Panel (national probability-based panel recruited by ABS)

Demographic distribution:


Phone still needed to reach certain groups
Weighted by 2020 recalled presidential vote
Weighted by 2020 recalled presidential vote

Next is @kwcollins (Survey 160) presenting Dynamic Response-Rate Adjusted Stratified Sampling for Election Surveys

Sampling inversely proportional to response rates, but they are not always stable in time
Proposal: Dynamic Response-Rate Adjusted Stratified Sampling (DRASS)
Adjust probabilities of selection according to the observed response rate in the stratum
Adjust probabilities of selection according to the observed response rate in the stratum
Empirical test of this approach in NC, PA, AZ


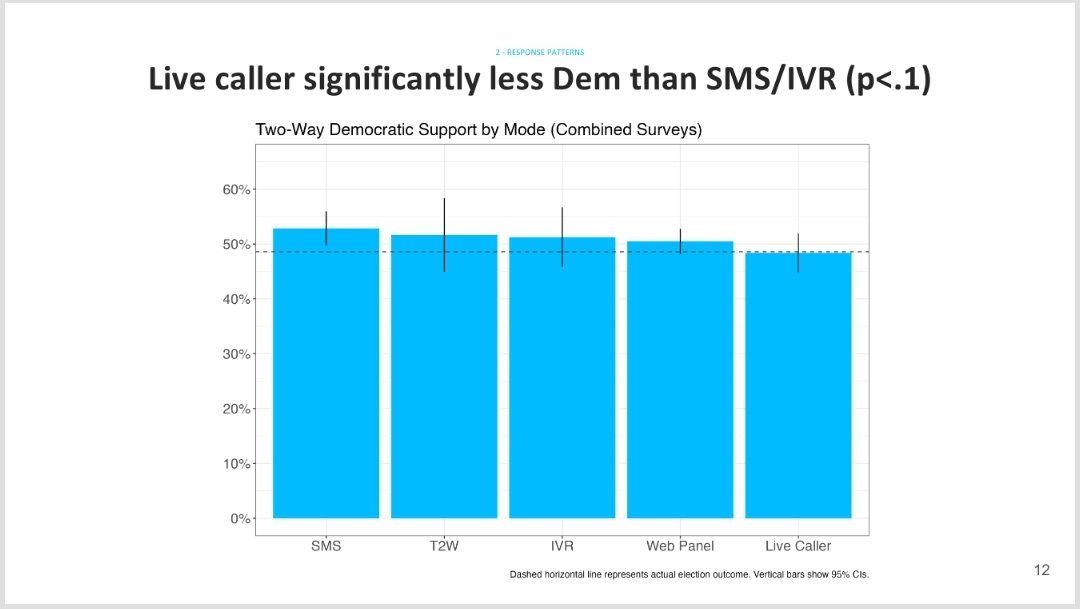
Next is @joywilke (BlueLabs) presenting Comparing Modes and Methodologies in Pre-Election Polling
Response rates can vary dramatically over the course of the campaign (presenting data from Mid-Sept and Early Nov 2022)

Cellphone was really reaching a different group

Significant difference across mode about how respondents answering being less motivated to vote by candidate party

And to the R-D margins on the elections estimates:
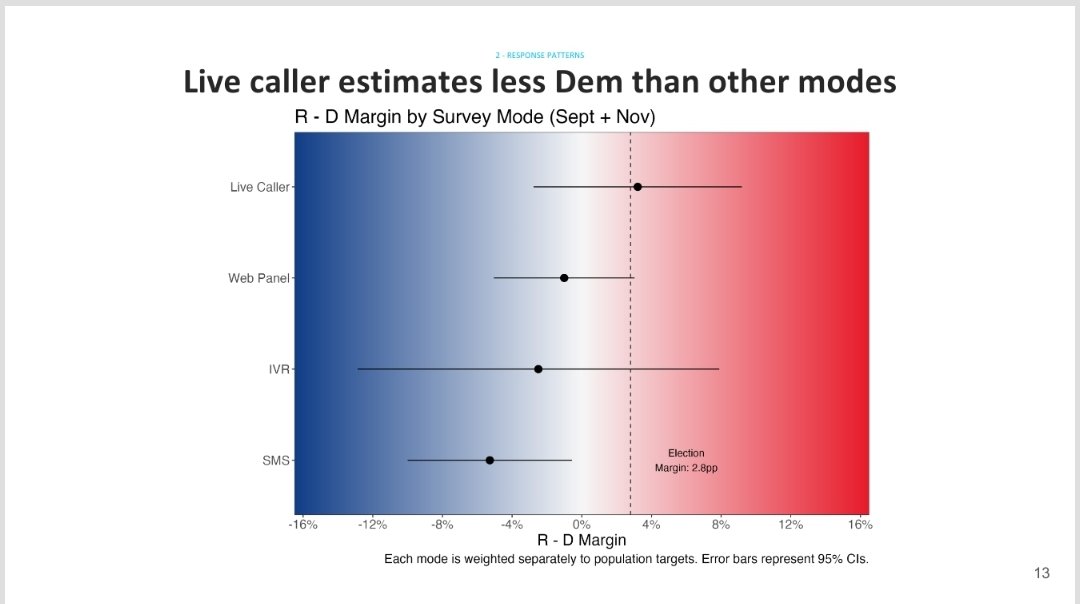
Very large differences in costs between modes!

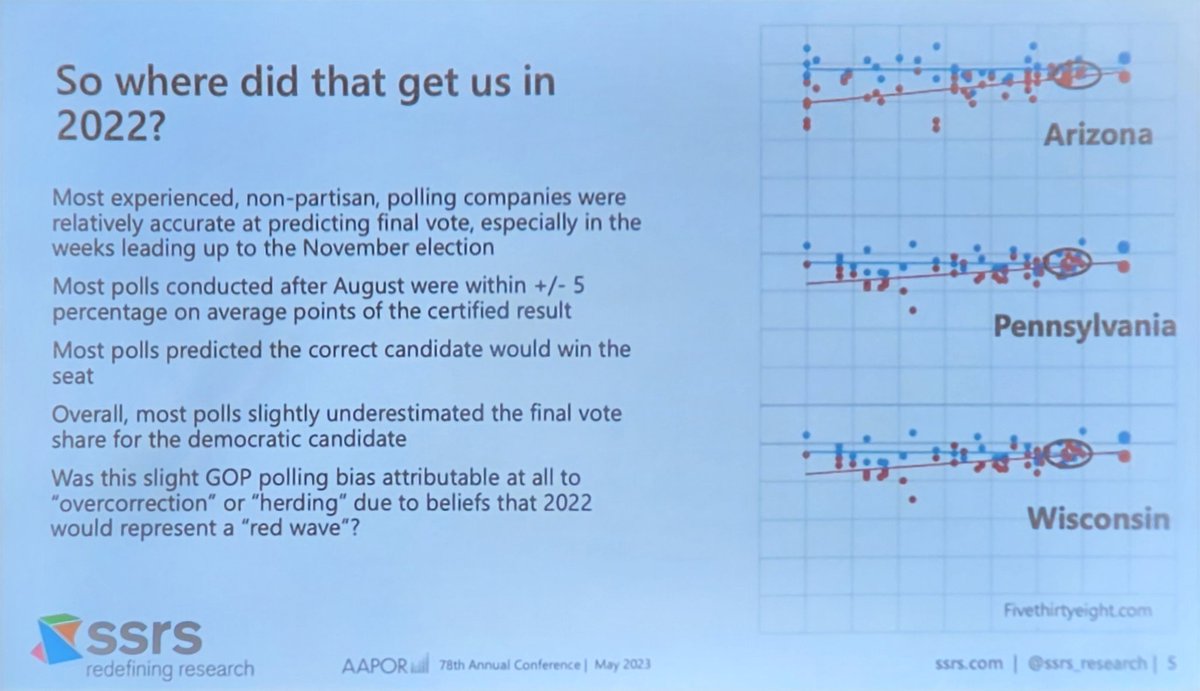
Next is Patrick Murray (Monmouth University) talking about The Media “Horse Race” Obsession: Can Polling Improve the Quality of Election Coverage?

Not a lot of research about media coverage of the election polls...
We have more tools to judge the quality of polls today.
Turnout models didn't capture voters that would typically only vote in federal elections

Polls were showing a close race, but media was not portraitying as such
Solution: present results in a different way, by level of support:

17% of media framed as a horse race "gap", which is not how the pollster originally presented the results
[This feels a lot like the media in Brazil showing the valid votes instead of total votes]
[This feels a lot like the media in Brazil showing the valid votes instead of total votes]

Next we have Donald Levy (Sienna College) and Spencer Kimball (Emerson College) presenting Comparing Modes and Methodologies in Pre-Election Polling

In the spirit of the conference, this is a good example of collaborations between two, presumably competitors, pollsters!
Two pollsters, Sienna and Emerson, polling during same time frame, same survey in NY
Differences in methodologies between the two polls:
Siena using a more traditional live-interviewer phone methodology
Emerson using a mixed-mode approach using IVR, online panel, and text to web
Siena using a more traditional live-interviewer phone methodology
Emerson using a mixed-mode approach using IVR, online panel, and text to web

Some differences between the two polls: unweighted Emerson more Democratic than Siena, but much closer when weighted

Siena's main takeaway: remain as a phone shop 😅
Key to this relationship was trust -- sharing methodologies, data, etc.
@threadreaderapp compile unroll thread
• • •
Missing some Tweet in this thread? You can try to
force a refresh