
The MONTHLY ChartStorm - May 2023
$SPX $SPY $ES_F $VIX $STUDY
(thread)
$SPX $SPY $ES_F $VIX $STUDY
(thread)
Welcome to the inaugural MONTHLY ChartStorm — basically a digest of some of the most intriguing charts of the past month from the (now paywalled) Weekly S&P500 #ChartStorm
1. Allocations vs Sentiment
Despite some of the most bearish sentiment readings in recent history, investors only slightly reduced equity allocations. And now they're reassessing the situation...
h/t @topdowncharts
Despite some of the most bearish sentiment readings in recent history, investors only slightly reduced equity allocations. And now they're reassessing the situation...
h/t @topdowncharts

2. Soft Landing?
Wall Street analysts are basically predicting a soft landing for earnings, with consensus seeing a small dip and then strong recovery...
h/t @MikeZaccardi $SPX $SPY $MACRO
Wall Street analysts are basically predicting a soft landing for earnings, with consensus seeing a small dip and then strong recovery...
h/t @MikeZaccardi $SPX $SPY $MACRO

3. Recession Trading
Recessionary bear markets often see substantial rallies and periods of ranging/stalemate (...seem familiar?)
Stock prices can thus be very misleading in terms of false dawns and false hopes.
h/t @businesscycle $SPX $MACRO
Recessionary bear markets often see substantial rallies and periods of ranging/stalemate (...seem familiar?)
Stock prices can thus be very misleading in terms of false dawns and false hopes.
h/t @businesscycle $SPX $MACRO

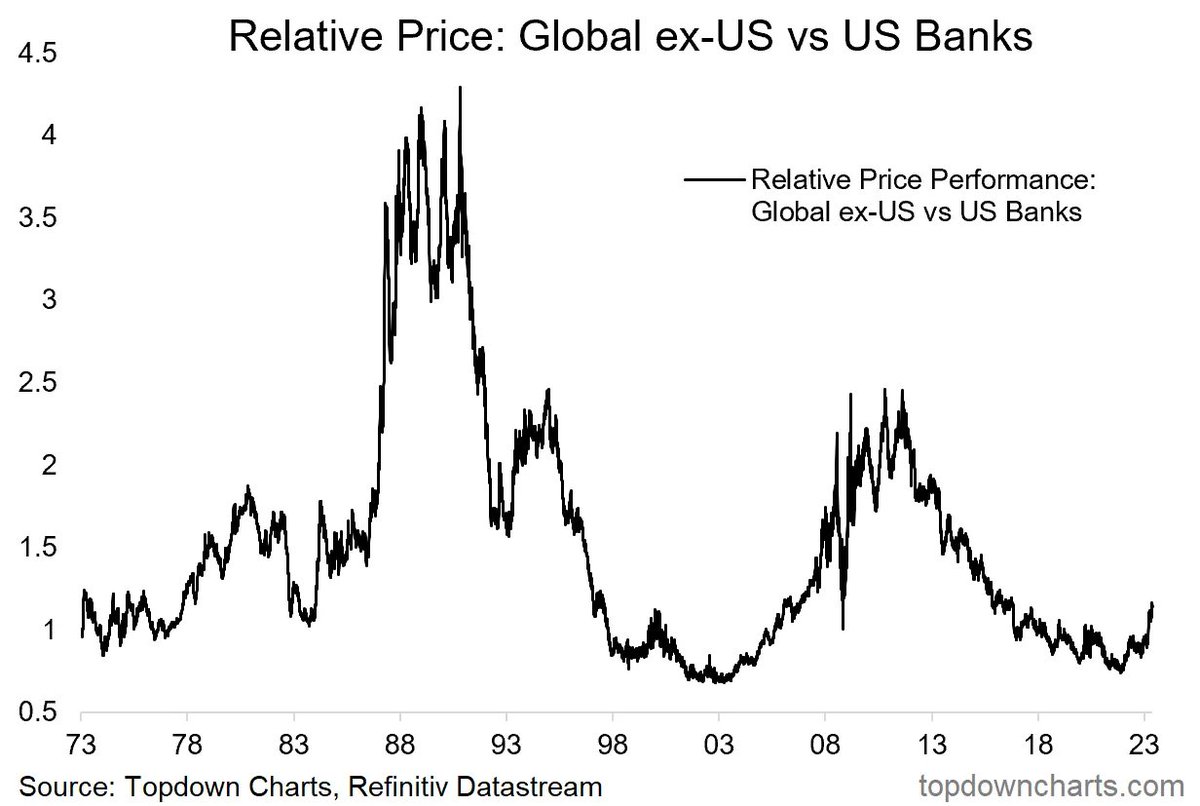
4. Global Banks Gain the Upper Hand
After a decade-long relative bear market, global banks are making a comeback (thanks to disastrous performance of US banks) — major turning point in progress?
h/t @topdowncharts $XLF $KRE $KBE
After a decade-long relative bear market, global banks are making a comeback (thanks to disastrous performance of US banks) — major turning point in progress?
h/t @topdowncharts $XLF $KRE $KBE
5. Tech vs The Rest: Peak or Plateau?
The dominance of tech relative performance can conclude with a bang (2000), a whimper (1970’s), or a plateau (1962)
h/t @Marlin_Capital $XLK $QQQ $NDX
The dominance of tech relative performance can conclude with a bang (2000), a whimper (1970’s), or a plateau (1962)
h/t @Marlin_Capital $XLK $QQQ $NDX

6. Lopsided Markets
Passive index-tracking investors are wildly concentrated in the top 10 stocks.
Will things like AI drive a rebalancing?
h/t @pkedrosky
Passive index-tracking investors are wildly concentrated in the top 10 stocks.
Will things like AI drive a rebalancing?
h/t @pkedrosky

7. Global Stockmarket Seasonality
This chart tracks the seasonal price patterns by month across a range of global equity indexes, and essentially goes to show that seasonality is a global thing.
And the seasons are changing…
h/t @laidler_ben
This chart tracks the seasonal price patterns by month across a range of global equity indexes, and essentially goes to show that seasonality is a global thing.
And the seasons are changing…
h/t @laidler_ben

8. It Was a Good Day
Would you believe me if I told you even-dated days historically outperformed odd-dated days?
h/t @buildalpha
Would you believe me if I told you even-dated days historically outperformed odd-dated days?
h/t @buildalpha

That's it for this month. 🤓
Check out the Weekly ChartStorm for more charts and timely updates on the market outlook: topdowncharts.com/chartstorm
Check out the Weekly ChartStorm for more charts and timely updates on the market outlook: topdowncharts.com/chartstorm
• • •
Missing some Tweet in this thread? You can try to
force a refresh


