WHY do we divide by n-1 when computing the sample variance?
I've never seen this way of explaining this concept anywhere else.
Read on if you want a completely new way of looking at this.
I've never seen this way of explaining this concept anywhere else.
Read on if you want a completely new way of looking at this.

BACKGROUND
This explanation is going to be confusing if you're rusty on summation notation. So here is a quick review.
If you're comfortable with this concept, skip to the next tweet.
Summation notation is a compact way of talking about adding up n values.
This explanation is going to be confusing if you're rusty on summation notation. So here is a quick review.
If you're comfortable with this concept, skip to the next tweet.
Summation notation is a compact way of talking about adding up n values.

We should also quickly review the "sample mean" or "sample average".
If you are comfortable with this concept, skip ahead to the next tweet.
We compute the sample mean by adding up all our observations and then dividing by the total number of observations.
If you are comfortable with this concept, skip ahead to the next tweet.
We compute the sample mean by adding up all our observations and then dividing by the total number of observations.

Here are two key insights which will be important later.
INSIGHT 1: Notice that in the formula for the sample variance, we are subtracting the sample mean from each observation.
INSIGHT 1: Notice that in the formula for the sample variance, we are subtracting the sample mean from each observation.

INSIGHT 2: We can think of the sample variance as computing the average distance to the sample mean but with an extra correction factor.
Our question then changes from "Why divide by n-1?" to "Where did the correction factor come from?"
Our question then changes from "Why divide by n-1?" to "Where did the correction factor come from?"

IDEA: THE SAMPLE MEAN IS NOT INDEPENDENT OF OUR OBSERVATIONS
Each observation and the sample mean are slightly correlated because the sample mean is computed using all the observations.
Each observation and the sample mean are slightly correlated because the sample mean is computed using all the observations.
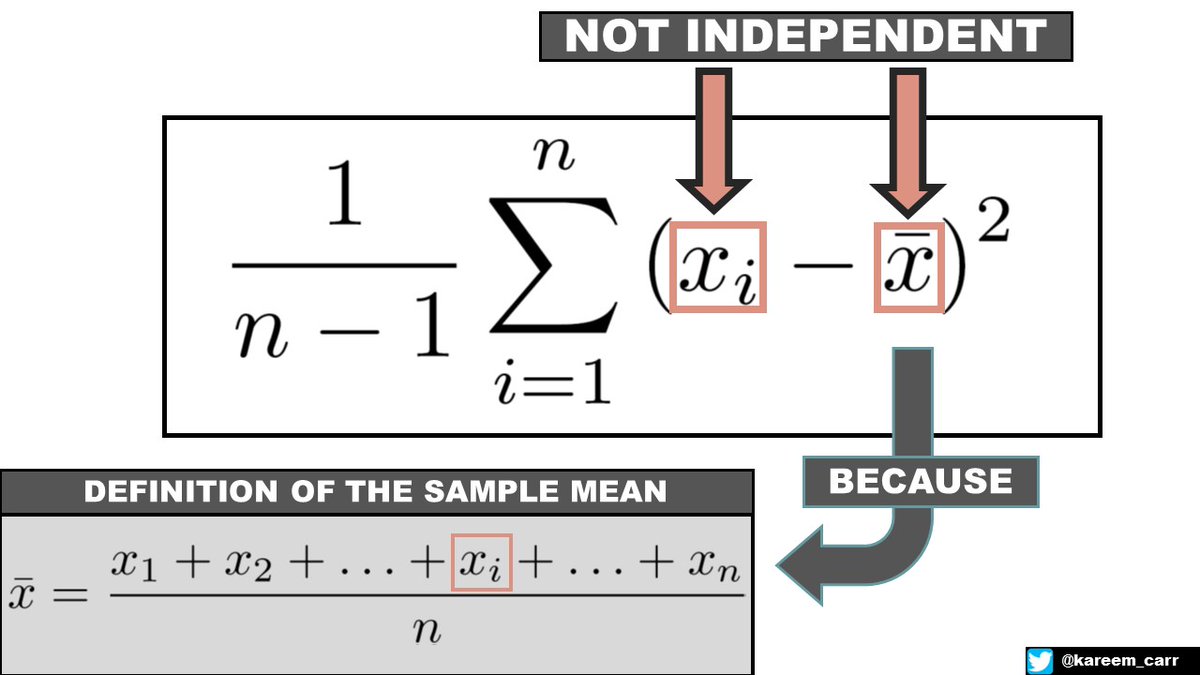
The way I like to think about it is we're subtracting -1/n of the observation when we subtract the sample mean. Since we do this n times for each observation, n times -1/n equals 1. We are effectively subtracting 1 observation. This is why we effectively have n-1 observations.
This way of thinking about it is not mathematically rigorous but we can make it more rigorous.
What if we try to decorrelate the sample mean and each observation?
What if we try to decorrelate the sample mean and each observation?
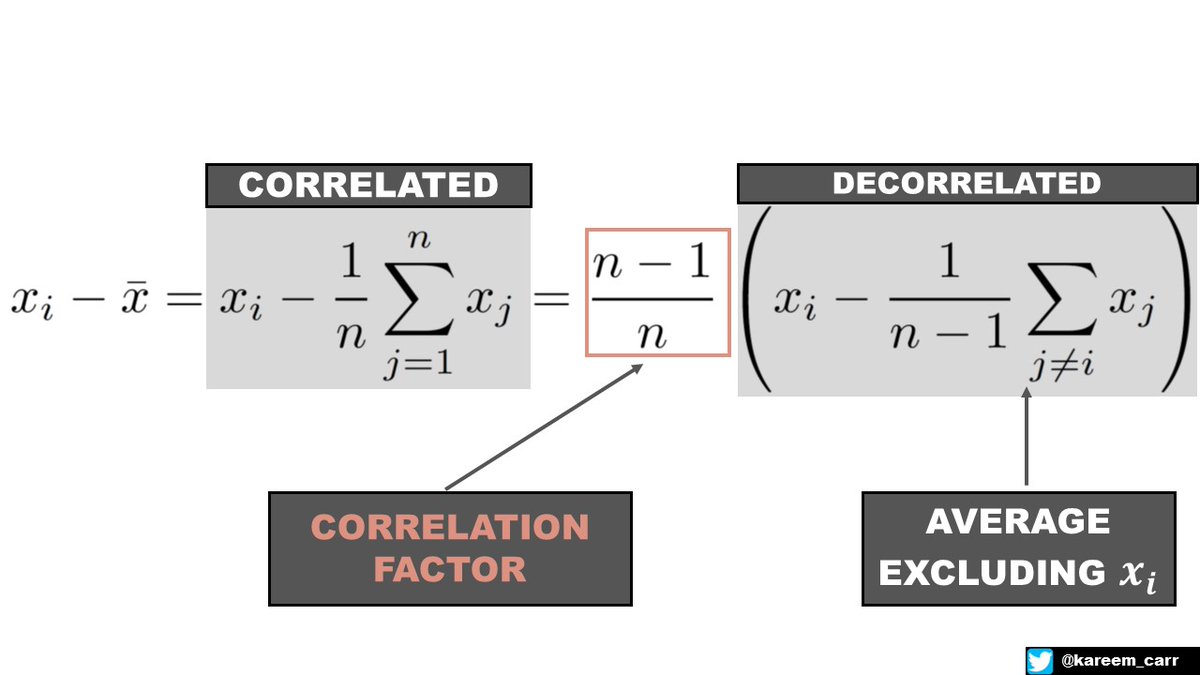
IDEA: DECORRELATING THE VALUES WITH ALGEBRA
I will use the first observation as an example.
STEP 1: We rearrange the terms so the mean no longer contains the first observation.
STEP 2: We rearrange the remaining expression to involve the average of the remaining n-1 values
I will use the first observation as an example.
STEP 1: We rearrange the terms so the mean no longer contains the first observation.
STEP 2: We rearrange the remaining expression to involve the average of the remaining n-1 values

The decorrelation procedure makes intuitive sense.
The average of the n-1 remaining values is uncorrelated with the first observation, and since it's just a sample containing n-1 values, it's also a reasonable estimate of the average of the total population.
The average of the n-1 remaining values is uncorrelated with the first observation, and since it's just a sample containing n-1 values, it's also a reasonable estimate of the average of the total population.
IDEA: WE DON'T NEED TO ACTUALLY DECORRELATE. WE CAN JUST USE A CORRECTION FACTOR
Subtracting the sample mean from the first observation is identical to subtracting the average of all the values excluding the first observation times an extra correlation factor.
Subtracting the sample mean from the first observation is identical to subtracting the average of all the values excluding the first observation times an extra correlation factor.

This applies to every other observation not just the first.
As you can imagine, recomputing the average of the n-1 remaining observations for each observation is tedious. It's much easier to subtract the same sample mean each time and then account for the correlation afterwards.
As you can imagine, recomputing the average of the n-1 remaining observations for each observation is tedious. It's much easier to subtract the same sample mean each time and then account for the correlation afterwards.
IDEA: BESSEL'S CORRECTION CANCELS THE CORRELATION FACTOR
Notice that the correlation factor and Bessel's correction cancel each other out when multiplied.
So that's the story of where the Bessel's correction comes in and why we divide by n-1.
Notice that the correlation factor and Bessel's correction cancel each other out when multiplied.
So that's the story of where the Bessel's correction comes in and why we divide by n-1.

This isn't the whole story. There is one more twist of mathematical luck that makes the algebra work out.
But this is the main idea.
I hope this makes the appearance of n-1 feel less mysterious.
But this is the main idea.
I hope this makes the appearance of n-1 feel less mysterious.
I enjoy explaining math and statistics ideas. Follow me for more content like this, and don't forget to click the little notification bell so you don't miss out on future threads.

• • •
Missing some Tweet in this thread? You can try to
force a refresh